AMD Zen 4 Ryzen 9 7950X and Ryzen 5 7600X Review: Retaking The High-End
by Ryan Smith & Gavin Bonshor on September 26, 2022 9:00 AM ESTSPEC2017 Single-Threaded Results
SPEC2017 is a series of standardized tests used to probe the overall performance between different systems, different architectures, different microarchitectures, and setups. The code has to be compiled, and then the results can be submitted to an online database for comparison. It covers a range of integer and floating point workloads, and can be very optimized for each CPU, so it is important to check how the benchmarks are being compiled and run.
We run the tests in a harness built through Windows Subsystem for Linux, developed by Andrei Frumusanu. WSL has some odd quirks, with one test not running due to a WSL fixed stack size, but for like-for-like testing it is good enough. Because our scores aren’t official submissions, as per SPEC guidelines we have to declare them as internal estimates on our part.
For compilers, we use LLVM both for C/C++ and Fortan tests, and for Fortran we’re using the Flang compiler. The rationale of using LLVM over GCC is better cross-platform comparisons to platforms that have only have LLVM support and future articles where we’ll investigate this aspect more. We’re not considering closed-sourced compilers such as MSVC or ICC.
clang version 10.0.0

clang version 7.0.1 (ssh://git@github.com/flang-compiler/flang-driver.git

 24bd54da5c41af04838bbe7b68f830840d47fc03)
-Ofast -fomit-frame-pointer

-march=x86-64

-mtune=core-avx2

-mfma -mavx -mavx2
Our compiler flags are straightforward, with basic –Ofast and relevant ISA switches to allow for AVX2 instructions.
To note, the requirements for the SPEC licence state that any benchmark results from SPEC have to be labelled ‘estimated’ until they are verified on the SPEC website as a meaningful representation of the expected performance. This is most often done by the big companies and OEMs to showcase performance to customers, however is quite over the top for what we do as reviewers.
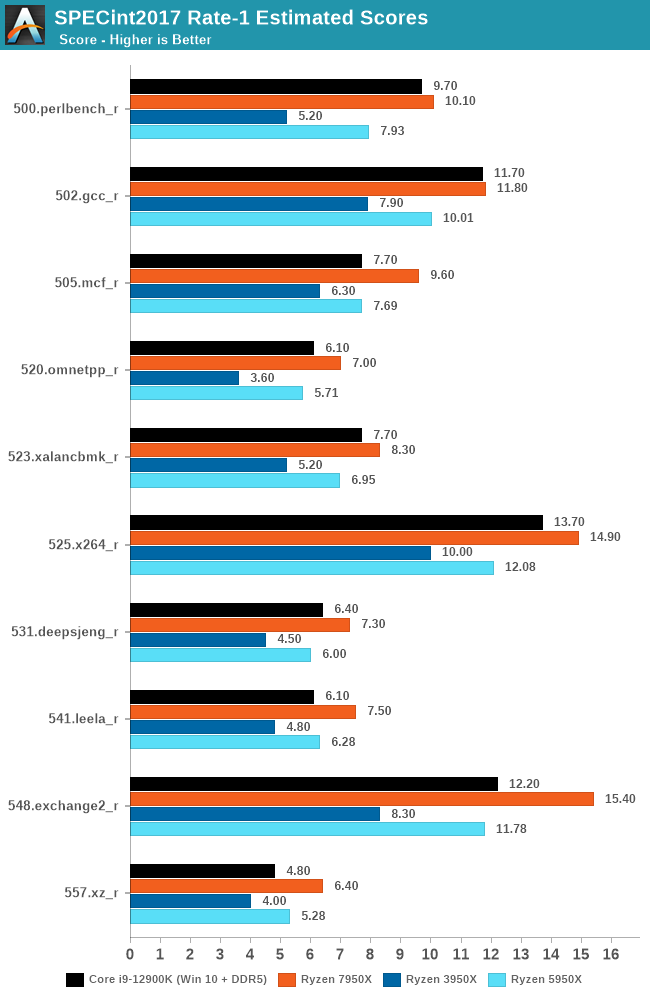
Starting off with single-threaded performance in SPECint2017, we can see that AMD's new Zen 4 core performs when compared directly with its previous Zen 3 and even more so, its Zen 2 microarchitecture. In 500.perlbench_r, the Ryzen 9 7950X has a 27% uplift over the previous Zen 3 based Ryzen 9 5950X, with a massive 94% uplift in single-threaded performance over the Zen 2 based Ryzen 9 3950X. This in itself is impressive, with similar levels of performance increase in other SPECint2017 tests such as a 23% increase over the previous generation in 525.x264_r and 30% in the 548.exchange2_r test.
The performance increase can be explained by a number of variables, including the switch from DDR4 to DDR5 memory, as well as a large increase in clock speed.
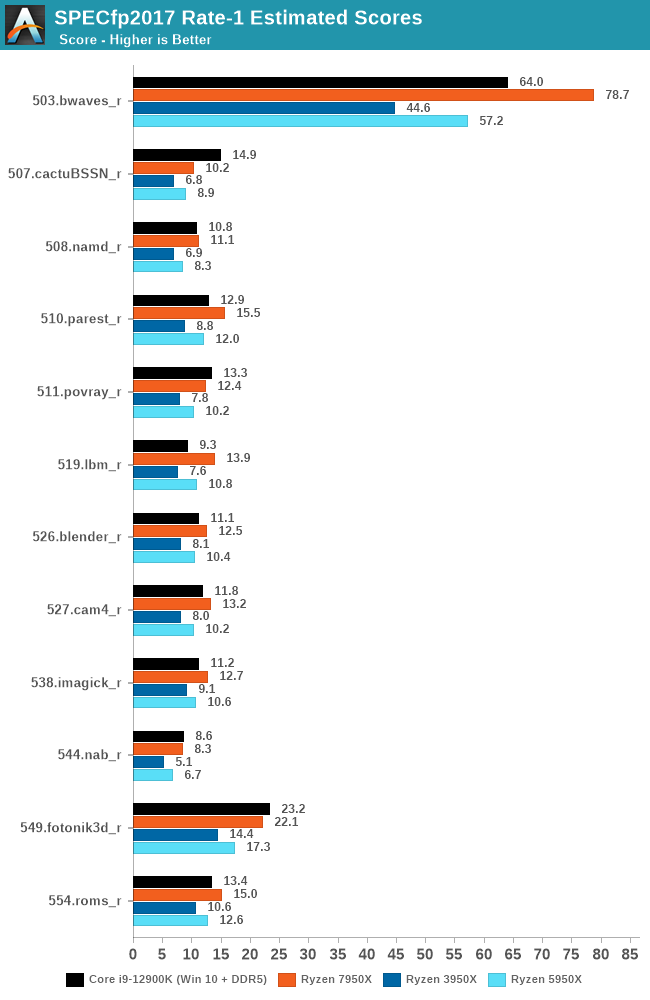
Moving onto our SPECfp2017 1T results, we see a similar increase in performance as in the previous set of 1T-tests. Focusing on the 503.bwaves_r, we are seeing an uplift of 37% over Zen 3. Interestingly, the performance in 549.fotonik3d, we see an increase of around 27% over the Ryzen 9 3950X, although Intel's Alder Lake architecture which is also on DDR5 is outperforming the Ryzen 9 7950X.
Perhaps the biggest increase in Zen 4's improvement in IPC over Zen 3 is through doubling the L2 cache on the 7950X (16MB) versus the 5950X (8MB). Similarly, both the Ryzen 9 7950X and 5950X have a large pool of L3 cache (64MB), but the 7950X boosts up to 5.7 GHz on a single core providing the core temperature is below 50°C, or 5.6 GHz if above 50°C.
As it stands at the time of writing, AMD's Ryzen 9 7950X is the clear leader in single-core IPC performance, with a pretty comprehensive increase in IPC performance over Zen 3. Although Intel's Alder Lake (12th Gen) provided gains over AMD's Ryzen 5000 series in a multitude of ways including frequency, optimizations, and its complex hybrid architecture. There is no doubt that the latest Zen 4 microarchitecture using TSMC's 5 nm node gives AMD the single-thread performance crown, and in terms of single-threaded applications, it's the most powerful x86 desktop processor right now.


205 Comments
View All Comments
Iketh - Thursday, October 6, 2022 - link
why are you giving so much credit to ddr5? moving to new memory has always given very small gains (if any) in the beginningtjunction is an arbitrary number set by AMD, so using that as an argument is irrational Reply
xol - Tuesday, September 27, 2022 - link
..but my main criticism was of the article - eg phrases like " increase the overall TDP ... without too much penalty" doesn't really make any sense - increase TDP is the penaltyBut much of the article is written as if letting TDP go *much* higher is some sort of gift from AMD -eg the examples I gave
The article is full of nothin-burgers like this statement :
" We feel that the higher all-core frequencies under maximum load, 95°C is a sufficient level of heat for what is on offer when it comes to overall performance" Reply
kwrzesien - Monday, September 26, 2022 - link
Whomever was the last to edit the front page needs to disable the trackpad and clean their mouse ball! 🤣 ReplyThreska - Monday, September 26, 2022 - link
"But now with AMD’s modern RDNA 2 graphics architecture and TSMC fabrication process, AMD has finally seen the (ray traced) light, and is building a small GPU block into the IOD to offer integrated graphics throughout the Ryzen 7000 product stack."I see things like SAM and HSA being a future trend.
https://www.electronicdesign.com/technologies/micr... Reply
erotomania - Wednesday, September 28, 2022 - link
Yes, AMD thought so too, in 2012...https://www.tomshardware.com/reviews/fusion-hsa-op...
and in 2014 here at AT...
https://www.anandtech.com/show/7677/amd-kaveri-rev...
Hopefully this time! Reply
nandnandnand - Monday, September 26, 2022 - link
It seems that going up by 1 GHz didn't help it that much in gaming benchmarks.Meanwhile, the 65W results show that any Zen 4 and later APUs are going to be absurdly powerful. Especially Dragon Range. Reply
Josh128 - Monday, September 26, 2022 - link
Any way you guys can add the single core ECO mode results to the conclusion page or to the R23 results on its respective page? Replydonquixote42 - Monday, September 26, 2022 - link
Single threaded workload would not use more than 65W anyway. So performance should be the same in ECO and non-ECO mode. ReplyJosh128 - Monday, September 26, 2022 - link
Still using a 2080Ti for the games testing is not good. Most certainly many of these results are GPU bound. Replysnowdrop - Monday, September 26, 2022 - link
No power consumption numbers? Will the article be updated with these when they're ready? Reply