Intel Alder Lake DDR5 Memory Scaling Analysis With G.Skill Trident Z5
by Gavin Bonshor on December 23, 2021 9:00 AM ESTCPU Performance, Short Form
To show the performance and scaling of DDR5 memory, we've opted for a more selective and short-form selection of benchmarks from our test suite.
Compression – WinRAR 5.90: link
Our WinRAR test from 2013 is updated to the latest version of WinRAR at the start of 2014. We compress a set of 2867 files across 320 folders totaling 1.52 GB in size – 95% of these files are small typical website files, and the rest (90% of the size) are small 30-second 720p videos.
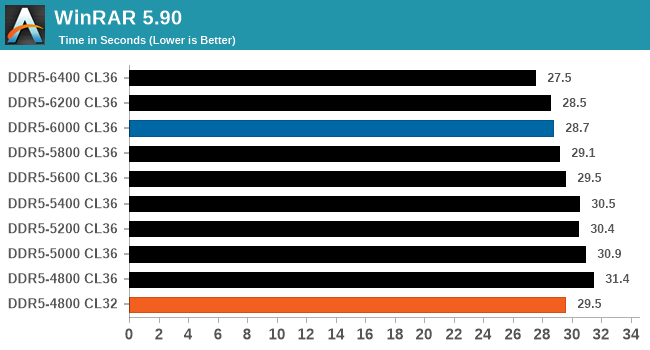
Blue is XMP; Orange is JEDEC at Low CL
In our WinRAR 5.90 benchmark, this is where we saw the most effective and conclusive levels of performance, From DDR5-4800 CL36 to DDR5-6400 CL36, we saw an impressive 14.1 % increase in throughput. Even at the DDR5-6000 CL36 XMP, there was a 9.4% jump in performance in terms of scale from the baseline.
The DDR5-4800 CL32 also provided a good uplift in performance here. It should also be noted that WinRAR 5.90 performance can be very memory dependant, and it shows in our results.
Rendering - Blender 2.79b: 3D Creation Suite
A high-profile rendering tool, Blender is open-source allowing for massive amounts of configurability, and is used by a number of high-profile animation studios worldwide. The organization recently released a Blender benchmark package, a couple of weeks after we had narrowed our Blender test for our new suite, however their test can take over an hour. For our results, we run one of the sub-tests in that suite through the command line - a standard ‘bmw27’ scene in CPU only mode, and measure the time to complete the render.
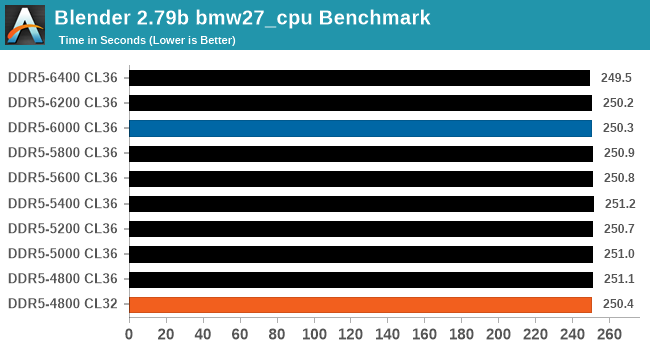
Blue is XMP; Orange is JEDEC at Low CL
In terms of scaling performance in our Blender benchmark, we saw very little variation in performance from top to bottom. Although the Trident Z5 at DDR5-6400 CL36 did perform best, it was a modest 0.6% jump in performance from our lowest result to the best.
Rendering - Cinebench R23: link
Maxon's real-world and cross-platform Cinebench test suite has been a staple in benchmarking and rendering performance for many years. Its latest installment is the R23 version, which is based on its latest 23 code which uses updated compilers. It acts as a real-world system benchmark that incorporates common tasks and rendering workloads as opposed to less diverse benchmarks which only take measurements based on certain CPU functions. Cinebench R23 can also measure both single-threaded and multi-threaded performance.
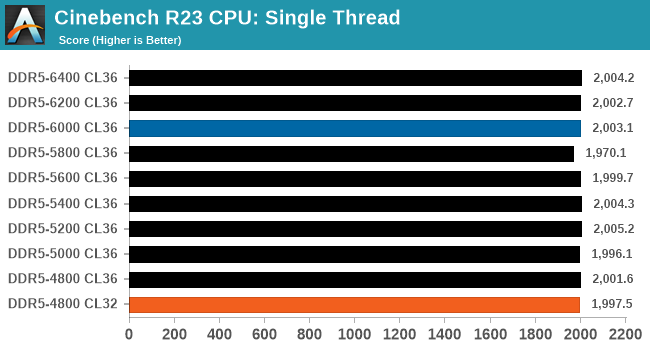
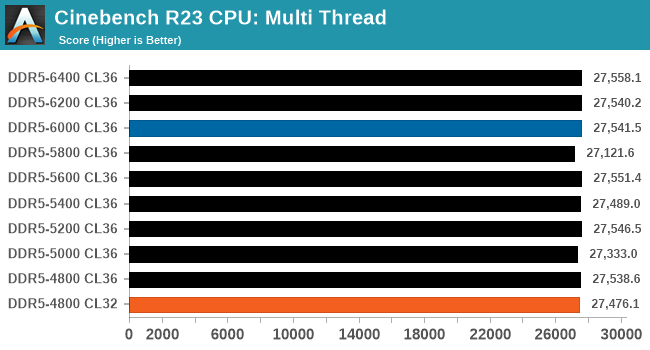
Blue is XMP; Orange is JEDEC at Low CL
Looking at performance in Cinebench R23, the results were a little sporadic, in both the single-threaded and multi-threaded testing. All of the results in the single-threaded test were within a margin of 1.8%, with the multi-threaded results within a 1.6% level of variation from top to bottom.
3DPMv2.1 – 3D Movement Algorithm Test: link
3DPM is a self-penned benchmark, taking basic 3D movement algorithms used in Brownian Motion simulations and testing them for speed. High floating point performance, MHz, and IPC win in the single thread version, whereas the multithread version has to handle the threads and loves more cores. For a brief explanation of the platform agnostic coding behind this benchmark, see my forum post here.
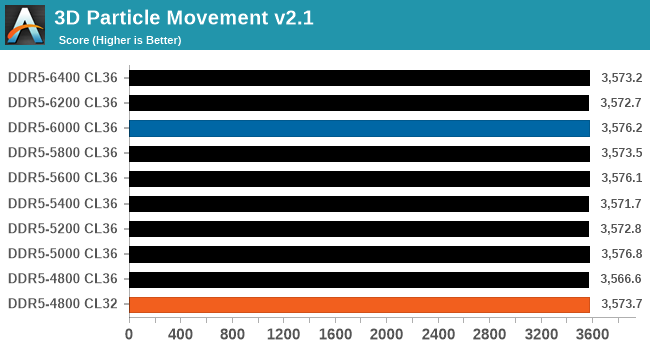
Blue is XMP; Orange is JEDEC at Low CL
Similar to what we saw in both Cinebench R23 and in our Blender benchmarks, performance in our 3DPM v2.1 testing shows little to no improvement with faster memory across the range of results. The level of variation between the best result and the worst result was around 0.3%.


82 Comments
View All Comments
Makaveli - Thursday, December 23, 2021 - link
I'd have to agree I'm not sure about the component choices here. Tech spot same article today provide alittle more useful information when it comes to games.https://www.techspot.com/review/2387-ddr4-vs-ddr5/
Notmyusualid - Thursday, December 23, 2021 - link
I'd have to disagree.7 of the top 10 GPUs in usage on this months Steam H/W survey are all deployed with Nvidia's Pascal architecture.
So clearly, for most gamers, the results contained here are relevant.
As to your other comment - my buddy runs 3440x1440 on his Seahawk (w/c) 1080, and it runs very well indeed.
Makaveli - Thursday, December 23, 2021 - link
3440x1440p with a 1080 at ultra settings?at 144hz? And what games? that comment doesn't have any details.
mikk - Thursday, December 23, 2021 - link
By this logic they shouldn't even bother testing a 12900k or any other ADL-S, the market share is even lower on Steam, much lower. It makes no sense what you are saying. The chance someone combines a new 12900k with an old GTX 1080 is rather slim, only Anandtech does this. This RAM test in heavy GPU limit is a complete waste of time. A typical Anandtech test.Oxford Guy - Friday, December 24, 2021 - link
I have a Fury-X that I obtained used for a low price coupled with a 9700K. Not everyone is willing to pay obscene prices for PC GPUs.TheinsanegamerN - Monday, January 3, 2022 - link
The price people are willing to pay has absolutely nothing to do with scaling performance reviews. Talk about a red herring argument.TheinsanegamerN - Tuesday, December 28, 2021 - link
Yes, but this is not a GPU test, it is a RAM scaling test. Running GPU limited scenarios is not going to provide useful data for RAM scaling.Oxford Guy - Friday, December 24, 2021 - link
It’s fine data, hardly useless. It’s incomplete, though.dicobalt - Thursday, December 23, 2021 - link
DDR5's latency is higher than 1970s Ozzy Osbourne.bananaforscale - Thursday, December 30, 2021 - link
Those are cycles, not time.