Multi-chip Intel Core i9-11900K Overclocking Review: Four Boards, Cryo Cooling
by Gavin Bonshor on August 30, 2021 9:00 AM ESTOverclocking Results
With our test setup and methodology employed, we will be splitting the results extrapolated from our testing on each of the four Z590 motherboards. We feel this is fair due to each motherboard vendor enforcing each of its own tweaks via multi-core enhancement settings and we believe this is enough to make subtle differences to performance. We've split the results into four graphs per test, so one for each Z590 model we've tested on, with both stock and overclocked results for comparison.
All our testing on Intel Z590 is using Windows 10 64-bit with the 20H2 update.
Rendering - POV-Ray 3.7.1: Ray Tracing
The Persistence of Vision Ray Tracer, or POV-Ray, is a freeware package for as the name suggests, ray tracing. It is a pure renderer, rather than modeling software, but the latest beta version contains a handy benchmark for stressing all processing threads on a platform. We have been using this test in motherboard reviews to test memory stability at various CPU speeds to good effect – if it passes the test, the IMC in the CPU is stable for a given CPU speed. As a CPU test, it runs for approximately 1-2 minutes on high-end platforms.
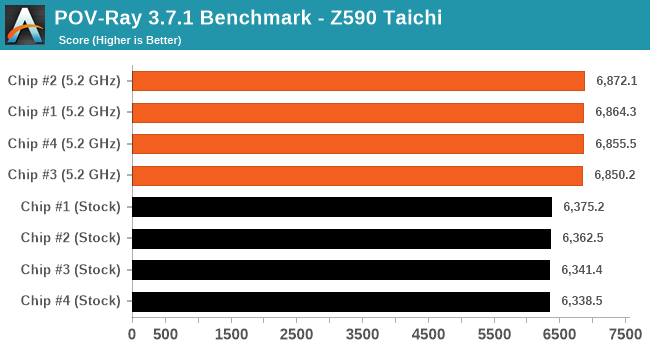
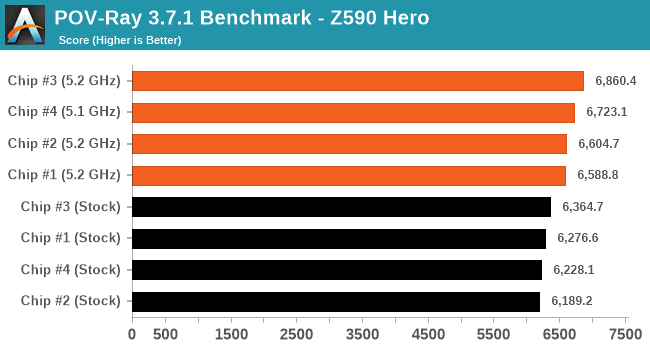
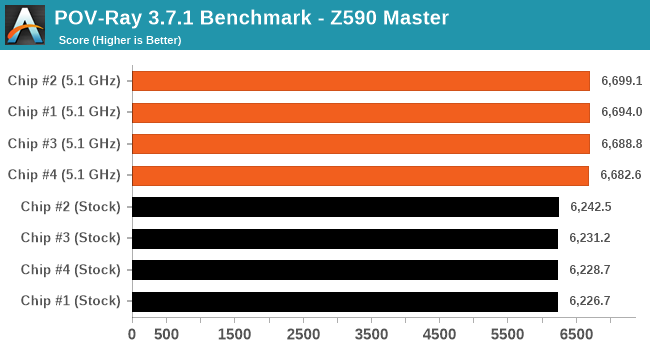
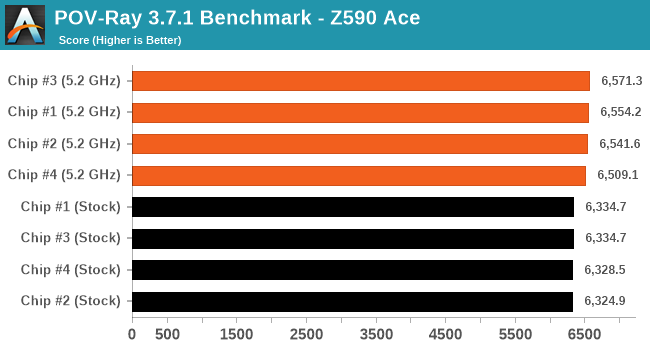
In our POV-Ray testing, all four of the processors on each board managed to beat default performance convincingly with an average increase of 6.4%.
Rendering - Cinebench R23: Link
Maxon's real-world and cross-platform Cinebench test suite has been a staple in benchmarking and rendering performance for many years. Its latest installment is the R23 version, which is based on its latest 23 code which uses updated compilers. It acts as a real-world system benchmark that incorporates common tasks and rendering workloads as opposed to less diverse benchmarks which only take measurements based on certain CPU functions. Cinebench R23 can also measure both single-threaded and multi-threaded performance.
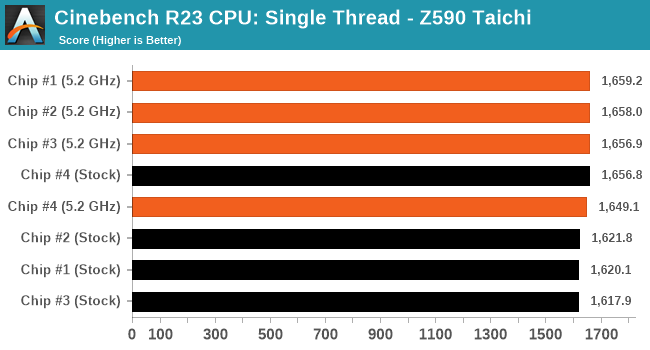
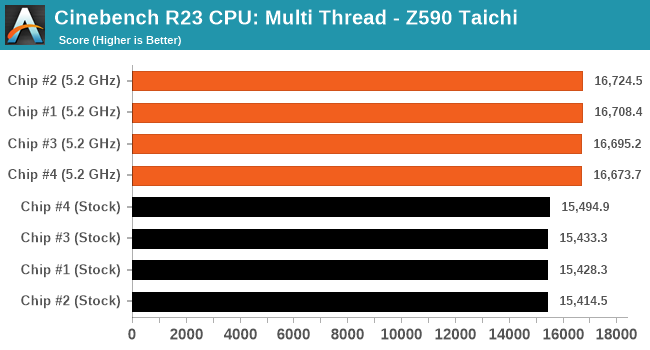
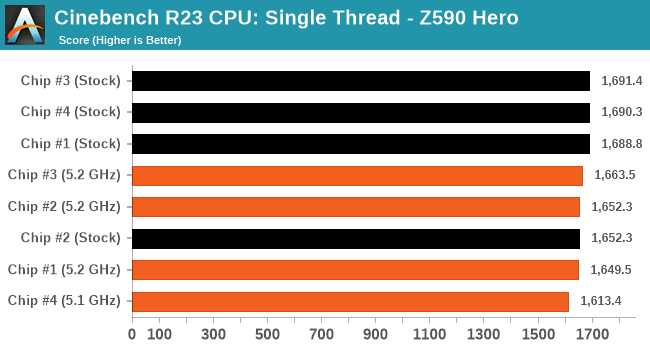
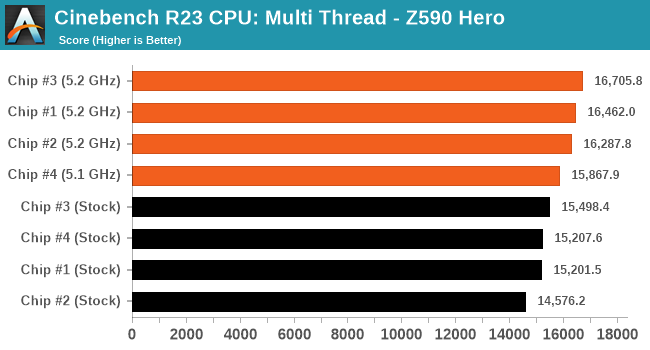
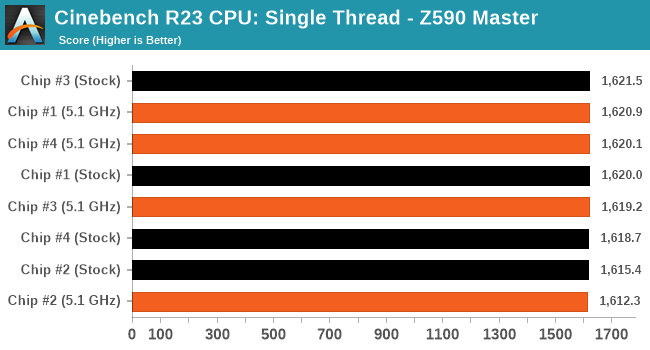
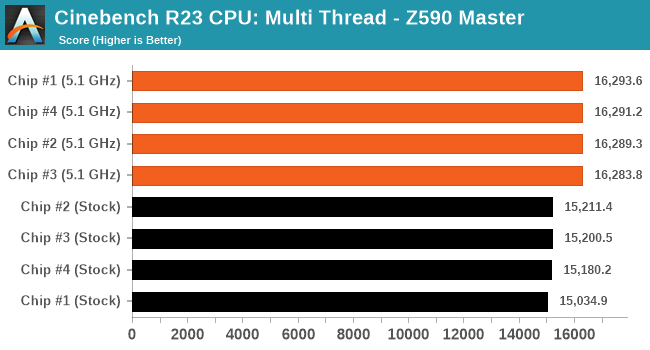
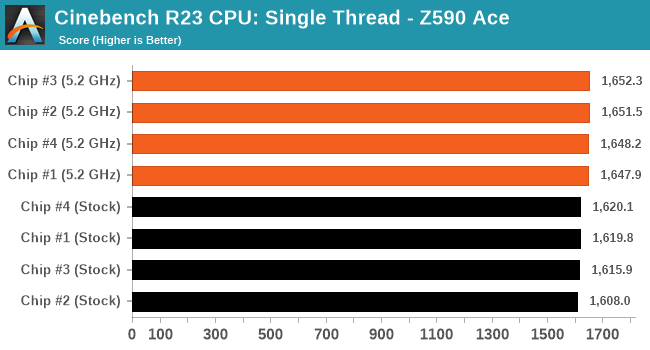

In CineBench R23, we saw a marginal uplift in performance in single-thread performance on average, but the biggest gains were in the multi-thread test with an average increase of 6% over default values. In perspective, the single-threaded performance gains in CB23 were around 0.04%. The reason why the ST values aren't popping here is because the stock CPU enables turbo with TVB to 5.3 GHz, whereas we are fixing each chip to 5.2 GHz all-core.


54 Comments
View All Comments
yeeeeman - Tuesday, August 31, 2021 - link
don't wanna be closed in an ecosystemikjadoon - Monday, August 30, 2021 - link
424 W under peak nT overclocked load. Those VRMs were earning their stripes!53W per core. Per core!
Is there a reason besides voltage why Chip #3 significantly beat Chips #1, 2 in POV-Ray + Cinebench R23 nT + GB5 nT on the Z590 HERO ? All were 5.2 GHz. Higher voltage = better clock stability?
//
Is it a typo or a really good deal on the first page chart at the bottom—i9-11900K to be $374, though earlier written as $545.
ceomrman - Monday, August 30, 2021 - link
This is a great article, nice work! The gains are very modest, but more surprising to me was how variable they were. As a consumer buying top-shelf parts, you could easily end up with worse overclocked performance than you'd get at stock settings with a different random CPU and/or expensive, high quality motherboard. Even for uses that would benefit from overclocking, there are very specific configuration choices to navigate. That's not to mention that the kind of tasks that would benefit from absolute max multi-core performance are noticeable faster on a Ryzen or even on older Intel HEDT chips with more cores, anyway. The 11900K is for gaming. Overclocking it yields no gaming improvement. So yeah, don't bother.mode_13h - Monday, August 30, 2021 - link
> using current average US energy prices, assuming the system was at full-load for the> full duration, 10 hours a day over 300 days a year equates to an extra $41 in energy bills.
Please specify what figure you're using for "current average US energy prices". They vary by a lot (in terms of location, time of day (for some), and time of year).
Also, it'd be worth noting that you're not taking into account additional A/C costs. During the winter, some might not need air conditioning, although electric heat is nearly always more expensive that gas or oil (making this an inefficient substitute). However, during the summer, if the A/C is already taxed, the marginal increase in power utilization is probably nonlinear.
Although this sort of matrix testing sheds a little light into variations between boards and CPUs, you should probably use multiple samples of each board to draw any strong inferences about them. More importantly, I think a greater number of readers would be better-served by doing a proper GPU review.
mode_13h - Monday, August 30, 2021 - link
BTW, when estimating energy costs, did you account for PSU losses? If we assume the PSU is 80+ Platinum and running near full-load, it'd amount to another 11% or so.TheinsanegamerN - Monday, August 30, 2021 - link
"The average electricity rate is 13.19 cents per kilowatt hour (kWh)."https://www.electricchoice.com/electricity-prices-...
Dug - Monday, August 30, 2021 - link
"map provides a good representation"Well every site has different averages, so it's misleading.
And most are done by location, not by population. So 100 people paying 9cents and 1 million paying 13cents averages out to 11cents. Which isn't a realistic average.
mode_13h - Tuesday, August 31, 2021 - link
I typically pay about twice that.And if we consider the case of Texas, they typically have lower energy prices. However, during peak-demand season, the spot price really shoots up. During the summer, A/C is so essential that people there will cut back on food expenditures before they completely forego air-conditioning.
Wrs - Monday, August 30, 2021 - link
Or you could back-calculate what kWh rate they were assuming. I suspect a miscalculation somewhere by the quoted… In any case, a TEC is horribly inefficient for substantial active load, and in this case rather ineffective due to being undersized. 200w for 88 C at approx. 300w heat load? Just get a faster water pump to beat that with ambient liquid cooling. Electric cost would be pennies on the dollar!thestryker - Monday, August 30, 2021 - link
It sure seems like some sort of adaptive core overclocking would be key on these processors. On my 6800k, and now 6900k, I definitely have my overclock set for 2 and all cores just to keep the voltage down, but gain extra clockspeed for lightly threaded. It's not perfect, but assuming this type of setup works on z590 properly it would at the very least keep that stock boost if not allow for higher.In general from what I've read regarding both AMD and Intel's recent processors though it just seems like overclocking for a daily driver just isn't particularly worth it. Maybe with the upcoming ADL there'll be something extra to squeeze out of the E cores, but otherwise the future sure seems like minimal OC gains.