Testing the New 3DMark CPU Benchmark: For the Boids
by Dr. Ian Cutress on July 15, 2021 9:00 AM EST- Posted in
- CPUs
- Gaming
- Futuremark
- GPUs
- Benchmarks
- 915
- UL

A couple of weeks ago, UL (formerly Futuremark) released the latest test in its ongoing 3DMark gaming benchmark suite, CPU Profile. The premise behind this new CPU-specific test is a simulation to measure how processor performance scales with cores and threads. Normally 3DMark tests are designed to measure overall gaming performance – and thus are largely a GPU benchmark – however this one is a little different since it focuses more specifically on CPU performance. So we wanted to take a look at UL's latest test to get a better idea of what exactly it is testing, what exactly it is trying to accomplish, and just how useful it might be.
UL’s 3DMark and the New Test
The 3DMark software (with the tagline 'The Gamer's Benchmark') has been a staple of the synthetic benchmarking community for its variety of tests designed to emulate different levels of gaming complexity. From a singular interface, users can run simple tests aimed at mobile and integrated graphics performance, to mid-level gaming at reasonable resolutions and detail, up to overengineered tests for systems that don’t exist yet. Each of the tests provides a baseline set of graphics calculations designed to emulate video game performance and produces a composite number to represent that performance for that market. If you’ve ever heard of Time Spy or Fire Strike, two popular benchmarking tests particularly for overclockers, then 3DMark is where it comes from.

3DMark also acts as a vehicle for new feature tests. Over the years UL has introduced separate specific tests to find draw call limitations, DirectX Raytracing processing performance, Variable Rate Shading (VRS) performance, PCIe 4.0 testing, and NVIDIA DLSS performance. The newest test to this portfolio is the CPU Profile, the point of this article.
What is the CPU Test Measuring
The CPU Profile test showcases a simple low resolution scene derived from the imagery of the latest gaming tests. The rate limiter of this scene is the raw CPU calculations in the background – the test runs an effective 150 frames of images, however each frame involves a parallel compute framework based on the flocking of birds.
Bird flocking, also known in simulation as boids (bird-oid object, not an accent thing), involves the interaction of a large number of objects in movement to each other depending on small random movement and rules regarding separation, alignment, and cohesion. Each boid has to:
- be wary of its distance to other boids in a pack (separation),
- the direction of travel relative to others (alignment), and
- the desire to move towards an average position within line of sight (cohesion)
We’ve all seen how birds move in mass flocks, or fish in shoals, and there are actual mathematical models that can be used to simulate it. A minor adjustment in separation, alignment, and cohesion can adjust exactly how they all interact and move.
From a simulation standpoint, each boid is independent in its movements such that it can be calculated in parallel to others, however each boid needs to have knowledge of its local environment and the positions and directions of other boids inside that environment. The more boids in the local environment, the bigger the lookup table for that individual has to be – the size of that lookup table on each time step is often a mix between separation distance and line of sight: the more objects an individual can see/is interacting with at once, the bigger that calculation. The data for this lookup table has to be polled from many different places in cache and memory, almost at random, and for perfect simulation, on every timestep as well.
For anyone that wants to play with a 100 boid simulation in their browser, Ben Eater has a good one, or users can play with Github code here with a Javascript version. This is a single threaded design, and easily can scale to a few thousand on a single core without any optimized code.

Boids with simple edge boundary conditions
Beyond that, boid simulation isn’t usually run on CPU cores anyhow. Users can interact with a GPU version in their browser today, with 65000+ boids running very happily.
So with all this talk about boids, the CPU Profile test in 3DMark is doing exactly this simulation exclusively*. The workload outlined on 3DMark’s states that they have a simple, highly optimized simulation of boids split into two parts.
- One: Half the boids use SSSE3 optimized instructions
- Two: Half the boids use AVX2 optimized instructions, otherwise SSSE3
The benchmark does six separate sub-tests based on the number of threads: 1, 2, 4, 8, 16, max. Rather than giving an overall score, the test hands the user six different scores, based on a simple calculation:
- Score = 350,000 / average frame time
The simulation lasts for a fixed 150 frames, so each sub-test has the same fixed calculation simulation (and we assume the same fixed seeds for RNG). On the fastest processors, the max threads section can take under 10 seconds, allowing the simulation to run with CPUs operating entirely within turbo clockspeeds (we’ll get back to why this matters later), while the single thread section on the slowest processors can take five minutes or so.
The end results page is something that looks like this:
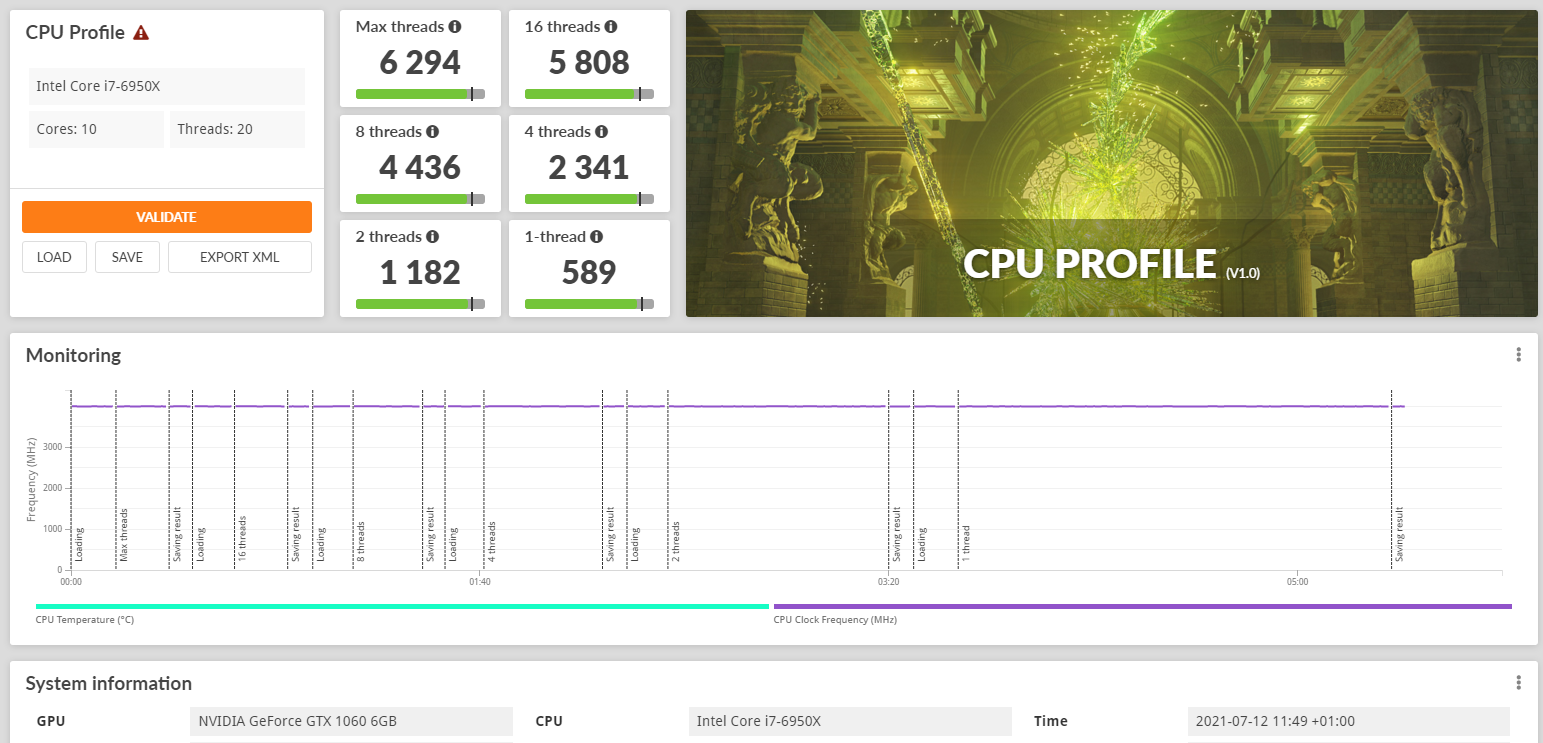
The test gives you six different results along with a system info tracker if it was enabled.
The ultimate purpose of the test being to benchmark CPU performance at several different thread counts, making a test that can scale up to use all of the threads a consumer CPU can provide, but also offers a look at performance with lower thread counts, which is where many games lie today. Put another way, on deciding whether to have a single-threaded or multi-threaded gaming test, UL decided to do both by testing with multiple thread counts.
*On launch UL's website said the test was in two parts with a physics engine, however UL has clarified to us in email that this was a copy/paste error from a previous test. The website has since been updated.
Discussion of the Test
Normally when probing a new test for our benchmark suite, it pays off to take a critical eye to what exactly the test is measuring and how it relates to the real world. Every benchmark has a place in a review lineup, though it is always important to quantify where it should be, and what weight should be given to the results. For example, we have real-world tests that assist in performance on that software, but we also have a mix of synthetic tests for overall performance perception. Usually we focus more on the real world tests for analysis and recommendation, but the small portion of synthetics help in maintaining baselines and for those that want to see them.
Normally we filter 3DMark’s gaming tests into that latter portion of synthetic testing. With the same program version and the same video drivers, we can see how different processors and graphics cards scale in light of the synthetic workload, even if the synthetic workload is trying to emulate an average gaming experience. UL has been quite clear that the goal of 3DMark’s gaming tests is to do just that – emulate real world performance.
Unfortunately, the commentary around the CPU Profile test is rather unclear. You might be forgiven for thinking that the test is designed to showcase where a processor might be limited in gaming; after all the test is shipped alongside a half-dozen other GPU gaming tests and during the test itself, we’re treated to some very game-looking imagery.

The arrows on the left look to be boids (300-ish?), but unsure if related to the simulation at all
In practice, it's unclear whether the images shown on screen have anything to do with the simulation at hand (while UL has responded to a couple of emails, they haven’t answered this directly yet). We only see 300 or so boids on screen, and yet a simple simulation on a single core of a Core i7-6950X can easily do a few thousand.
If we go into UL’s press release for the test, the headline for the page is ‘New CPU benchmarks for gamers and overclockers’, the page describes that it runs a CPU simulation across 1,2,4,8,16, max threads. For each of those sub-tests, it also gives a brief indication of what the test is useful for. Here is our summary of UL’s press release on the sub-tests:
- 1 Thread: Raw CPU performance, but others scores are better indicators of gaming.
- 2 Threads: Best for DX9 games such as DOTA2, League, and CS:GO
- 4 Threads: Best for DX9 games such as DOTA2, League, and CS:GO
- 8 Threads: Modern DX12 games, correlates will with 3DMark TimeSpy
- 16 Threads: Computational tasks, less relevant for gaming
- Max Threads: Full Performance, not relevant for gaming
In gaming workloads, we would generally agree with this. However, the underlying workload used in CPU Profile is not a gaming workload. This is where the confusion kicks in. UL says that its boid simulation is akin to similar situations in games, even to the point where having half using SSSE3 and half using AVX2 is more akin to game engines using different optimizations; however it completely skips over the fact that in every one of its sub-tests, the ‘game’ is CPU limited, even at 8 threads, and at 16 threads. This is fine for a CPU-speciifc test, but it is naive of how most games function on high-end hardware.
As mentioned above, UL hasn’t stated how dense its boid simulation is, nor how it scales; by AnandTech’s estimates you need at least 2000+ to saturate a single thread with unoptimized code, so with optimized code scaled across 8 threads or 16 threads, we need to be looking at 50000 or 100000 flocking objects in a simulation space. For games that showcase boid flocking environments, most of them are using secondary physics, i.e. unable to be influenced by the character, but those that do have interacting physics, they are unlikely to be simulating on this scale. Moreover, there’s nothing to say that a game engine won’t simply increase/decrease the boids in the simulation based on performance.
Orthogonal to all of this is the length of the test. Because the test is a fixed 150 frames regardless of how many threads are working, it means the best processors can churn through the max threads in a few seconds, while the slowest processors take several minutes in 1T mode. The discussion point here is down to how each processor induces its Turbo modes.
At various times in the past decade, Intel and AMD has privately expressed concern for big max thread workloads that take only a few seconds to complete - usually max thread workloads require enough time for a processor to hit a steady state frequency, and so completing within the turbo window makes the test an unrepresentative metric. Take, for example, CineBench R20 that can complete in 5 seconds with a higher average pixels per second than a Cinema4D test that might take a few hours. Moreover, gaming is a while ride of turbo results, and not a fixed workload constantly at turbo. If Intel and AMD have previously stated that these sorts of in-turbo max thread tests are irrelevant for performance comparisons, then the new CPU Profile test would fall to a similar fate.
We approached UL with this, along with the idea that the CPU Profile simulation should be a fixed time instead of a fixed set of frames, but in the end UL disagreed. One of the goals of the test was apparently having a short test length. They wanted the 8 thread result to correlate to Time Spy Extreme results, which meant finding a time that worked while also being short was a goal of the project. UL also stated that a 150 fixed frame test results in a fixed amount of work, and suggested that slower systems will process less with fixed time steps - I should point out this is irrelevant if you're taking an average when fixed time steps are in place. Over 150 frames, UL stated they could guarantee a balanced workload across all threads (something which doesn't happen in gaming), and beyond that the consistency of the test would diverge in its results.
Ultimately, I disagree with some of UL's choices here, and find that a lot of these arguments seem arbitrary at best – especially given my own experience in building our in-house tests such as 3DPM (which incidentally does do fixed time, not fixed compute). This also means that I’m having a hard time correlating what this benchmark is doing to how a user can interpret the results for a gaming workload. What UL has done here is create a CPU benchmark, first and foremost, and it appears that simply using a simulation mechanic ‘that can be used in games’ is being described as a tool to help identify gaming performance. At this stage, with the knowledge I have at hand, I remain unconvinced that the workload is gaming-relevant.
Results
Typical for a UL benchmark, CPU Profile generates a series of dimensionless scores. These scores directly correlate to the underlying benchmark, but they aren't a specific measurement in and of themselves. Complicating matters a bit for CPU profile, the benchmark generates half a dozen scores – so unless you read the documentation, the data can come off as glut of numbers that are lacking context.

Example from UL's website
Taking a look at these numbers, UL states on its website that the results help showcase the result compared to others, but also the overclocking potential for your processor. This is a hint that this benchmark is actually better for overclockers than anyone else, as having six different results numbers and six different recommendations for CPU overclocking doesn’t help how to interpret gaming much, especially given the bar showcasing the score is quite small and not offering any additional context.

Results from one of our CPUs, hard to see those bars
There’s also the matter of presenting the result as a score. All of UL’s tests give a score at the end, and as we’ve showcased above the results for this test a calculation of an arbitrary number (350000) divided by the average frame time (in milliseconds). The reason for not giving the results as a raw frame time is simple psychology – bigger numbers look better on graphs and are easier to interpret. So by dividing a number by the average frame time, everything gets a scale. It also helps that removing the units of the result might reduce confusion. The downside here is that the initial number is very arbitrary.
On the website, UL calls it a reference value using ‘a time constant set to 70 multiplied by a score constant set to 5000’, which comes to 350000. There are no explanations as to why these numbers exist, though we can interpret that 70 meant to be 70 milliseconds, and if a score achieves 70 milliseconds (note you need an 8 core processor to get that) then the final result is 5000 points. Almost all processors in all sub-tests will score under this, showcasing that the pivot for the results scaling is actually higher than most processors will achieve.
With the data, UL could have simply represented the data as an average frame rate. For example, here are some results for the Ryzen 7 2700X, an 8 core/16 thread processor, running at stock with JEDEC memory. The table showcases the raw average frame time, UL’s score, and an average frame rate metric.
| 3DMark CPU Profile AMD Ryzen 7 2700X |
|||
| AnandTech | Average Frame Time (milliseconds) |
3DMark CPU Score | Average Frames Per Second |
| 1T | 660.9 ms | 530 | 1.5 fps |
| 2T | 380.8 ms | 919 | 2.6 fps |
| 4T | 217.3 ms | 1611 | 4.6 fps |
| 8T | 121.5 ms | 2881 | 8.2 fps |
| 16T | 78.6 ms | 4453 | 12.7 fps |
| nT | 78.0 ms | 4487 | 12.8 fps |
Note that if your game is running at 12 frames per second on a Ryzen 7 2700X, then something is set too high anyway.
But as we start listing multiple processors, this data gets excessive and dense very fast.
| 3DMark CPU Profile Results Given as Average FPS |
||||||
| AnandTech | R9 5950X |
R9 3950X |
R7 2700X |
i9 11900K |
i9 9900KS |
|
| 1T | 2.7 | 2.2 | 1.5 | 3.1 | 2.3 | |
| 2T | 5.1 | 4.0 | 2.6 | 6.2 | 4.7 | |
| 4T | 8.4 | 6.4 | 4.6 | 11.7 | 9.2 | |
| 8T | 14.1 | 11.0 | 8.2 | 20.7 | 17.2 | |
| 16T | 22.4 | 19.1 | 12.7 | 24.8 | 20.7 | |
| nT | 31.1 | 28.6 | 12.8 | 24.8 | 20.7 | |
How should we order this table? Should it be ordered by 1T results, or by max thread results? If we’re focusing on gaming, perhaps we should order by 2T/4T or 8T instead, which makes the other results extra data that we’re discarding for being irrelevant or making it too complex. As is usually the case, the downside to offering multi-dimensional data – in this case, results with multiple quantities of threads – is that it becomes a whole lot harder to present it in a simple manner.
To date I’ve run the test on 24 processors, from a 64-core Threadripper down to a dual core Apollo Lake. Rather than a table of results, these results are ordered in which processor scores the highest for each of the sub-tests. There’s even a Sandy and Ivy Bridge in there.
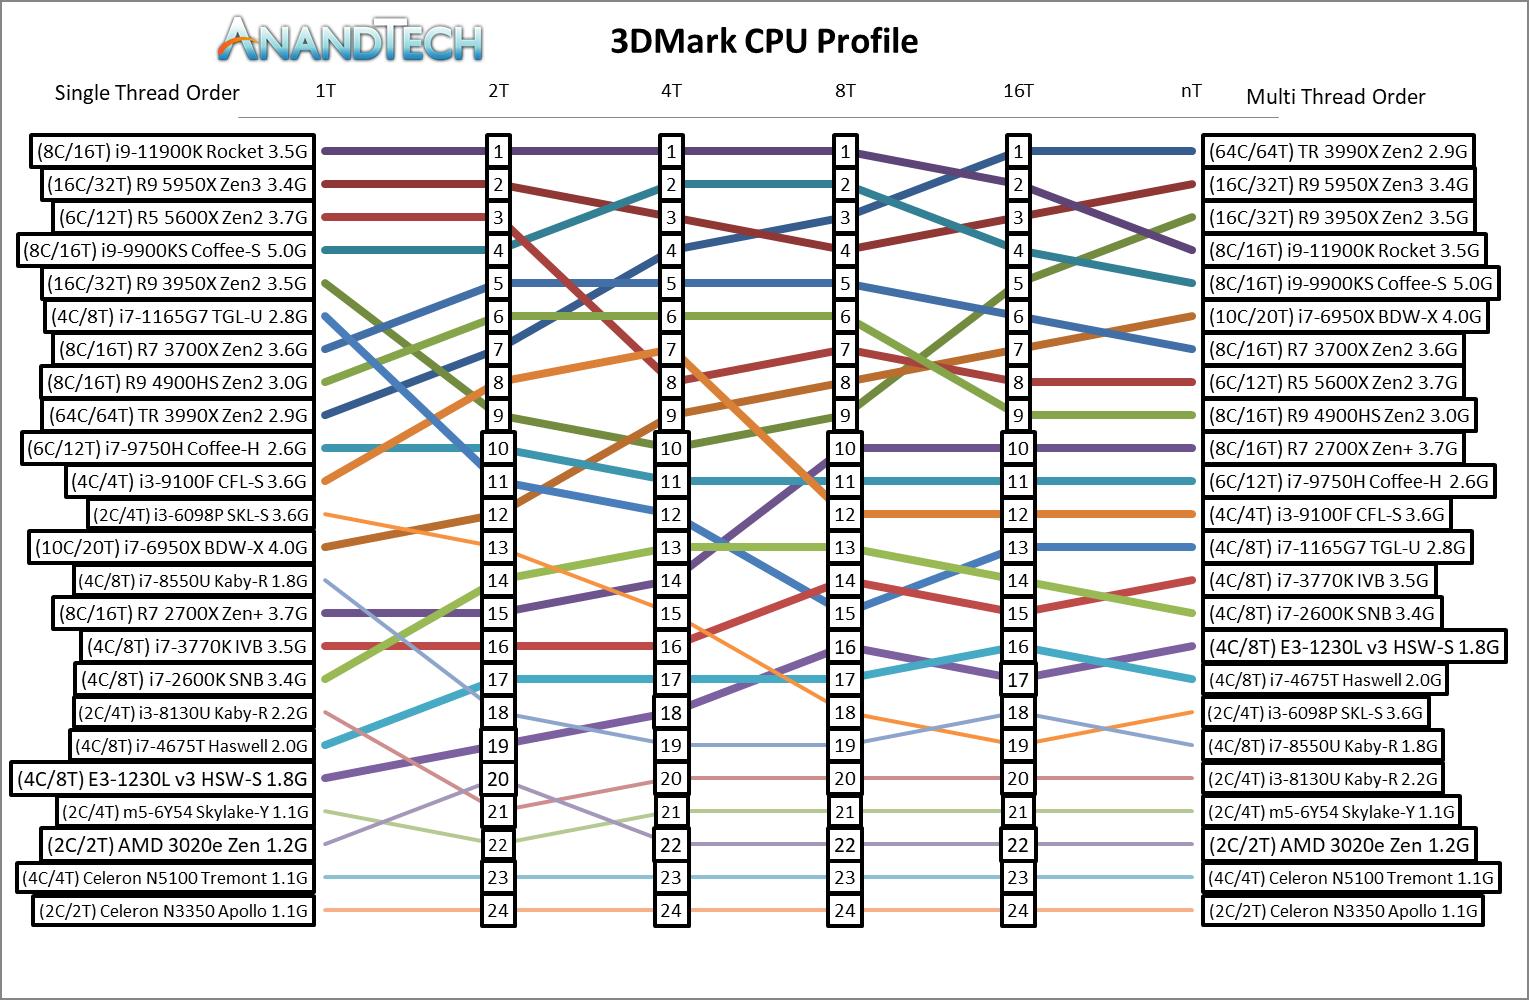
The resulting graph is quite noisy, especially as the fastest high thread count processors are not the fastest low thread count processors (and vice versa). Ultimately a graph like this might look better with just a few elements on it, such as here:
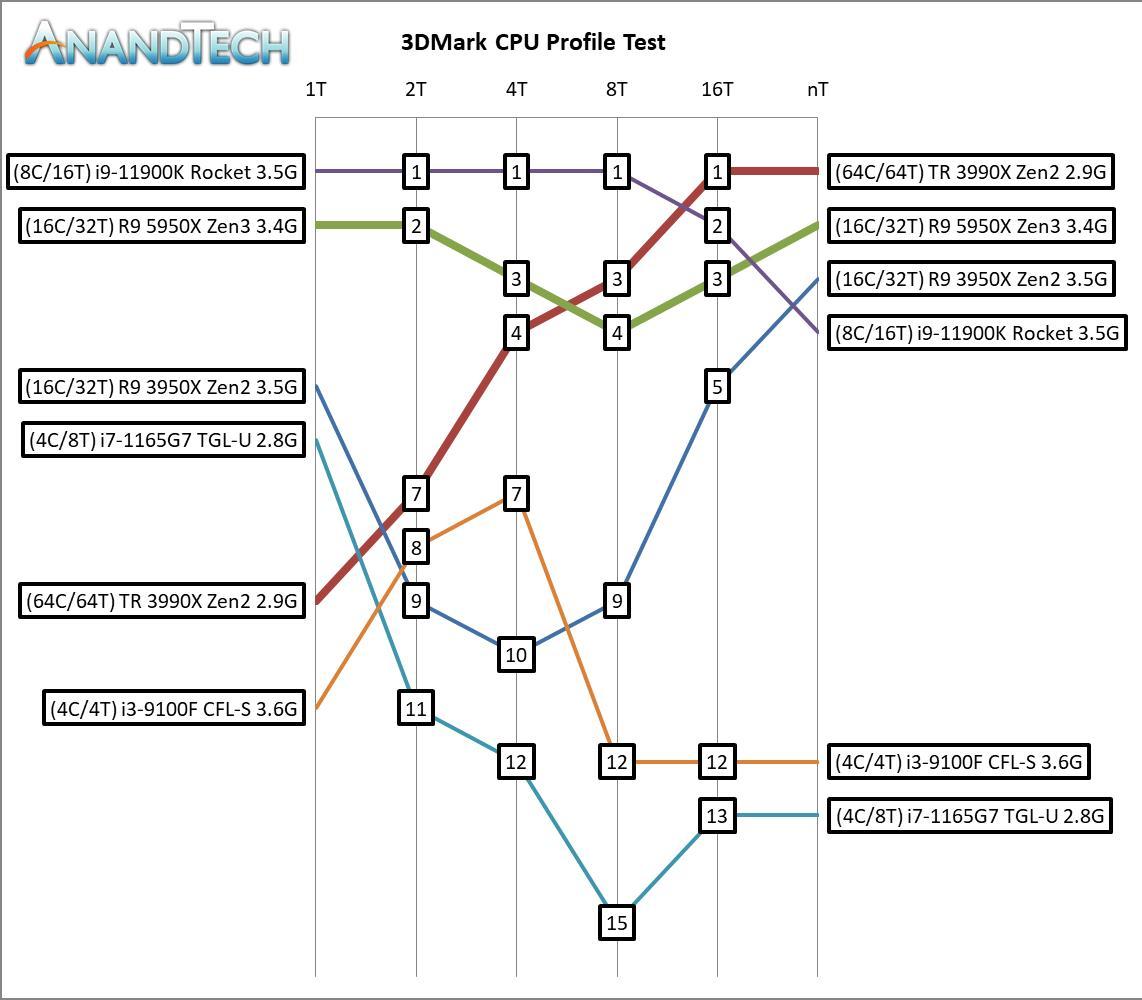
This showcases that the Core i9-11900K scores best on this test, until it hits 16 threads when the extra memory bandwidth of the 3990X takes over. It should be noted that Tiger Lake does abysmal on this test, just behind the R9 3950X in 1T and behind the i3-9100F in max threads, as the power limits of the mobile processor matter more than the extra threads. I will need to check with a U-series AMD to see what the difference is here.
By and large when we scale out to more threads, we see that having a more complete system helps on this test, however in the single threaded mode, it doesn’t all seem to be about IPC, which is perhaps one of the limits of the boid simulation. We can actually see the Core i3 perform better in 2T/4T compared to the Ryzen 9 3950X, perhaps due to cross-thread talk over the chiplets being more of a concern.

The benchmark in full: unsure if any of this relates to what's actually being calculated...
How this all relates to gaming though is a question left unanswered. It’s a strong CPU test, and as a simulation of flocking behavior, has the right elements for a scientific workload worth examining. However, interpreting the performance scaling as a function of gaming performance with a CPU-limited workload isn’t really relevant here, I feel – at least not without more information from UL about how they are interpreting this test. We have been emailing with UL back and forth to understand the test, and we are waiting to see if any further information will be made available. The thing is that most games that are CPU limited, especially DX9 esports titles, are bottlenecking on draw calls from the processor to the GPU, and aren't waiting on CPU compute except in a few fractional scenarios. This makes the CPU Profile test more for the extreme overclockers in that regard, trying to eke out performance across CPU and memory.


29 Comments
View All Comments
Oxford Guy - Monday, July 26, 2021 - link
‘Zen / Zen+ both feature full AVX and AVX2 feature compatibility. The older Phenom CPUs, however, do not, which has contributed (further) to making them age rather poorly.’Piledriver ‘improved’ upon Bulldozer by making AVX slower than SSE-2. In other words, it broke AVX. Yet, AMD chose to keep Piledriver on the market as the only ‘high-performance’ CPU for many many years.
HarryVoyager - Tuesday, July 27, 2021 - link
I'll have to go check that then. I know the Zen 1 and Zen 1+ chips had reputations of very poor performance in flight sims and were specifically advised against, and I recalled it was tied to their AVX2 performance, but it's been a few years, so will need to go dig up the tests and see.The Zen 2 to Zen 3 transition was also pretty significant, with my CPU bound numbers going up by about 40%. I think that was more due to the memory latency improvements. Il-2 appears to be super sensitive to memory latency.
Oxford Guy - Wednesday, July 28, 2021 - link
All I know is that AVX was broken when AMD released the Piledriver revision of the Bulldozer architecture. Zen was supposed to do AVX vastly better, although perhaps you’re correct about AVX-2. My hazy recollection is that Zen 1 only could do 128-bit at a time. To do 256-bit required more latency. I used to know all these details but age is catching up with me quickly.CZEfanyz - Tuesday, August 3, 2021 - link
Zen/Zen+ cores do support AVX/AVX2 indeed, but in case of AVX2, the execution takes two cycles instead of one on these generations ( https://www.anandtech.com/show/14525/amd-zen-2-mic... ). Full AVX2 support (meaning AVX2 instruction takes one cycle) is present from Zen 2 onwards.Thunder 57 - Monday, July 19, 2021 - link
What are you talking about? Even Bulldozer supports AVX.mode_13h - Thursday, July 22, 2021 - link
Yeah, but only Excavator supported AVX2.WaltC - Friday, July 16, 2021 - link
This is just another 3dMK synthetic benchmark which may or may not depend on the game code itself to define whether this particular bench is relevant to a particular game, or it isn't, in the sense of evaluating the performance value of particular hardware combinations. Often, synthetic benchmarks may have little if any actual relevance to a particular game engine (or CPU/GPU), and 3DMk is no stranger to such benchmarks, imo! This looks to be the case here as a matter of fact. It's never going to happen that the majority of 3dMk's benches are going to be terribly useful for judging the performance and/or the usefulness of specific hardware or specific games, etc. But, then, 3dMK's best use is a sort of general synthetic benchmark grab-bag that most people seem to run for itself, every now and then! The history of 3dMK's benchmark base and development is a long and convoluted one, imo, with no particular design agenda as its "guiding hand."mode_13h - Thursday, July 22, 2021 - link
Is it that hard to type out "3DMark"? At first, I didn't even know what you meant by 3DMk.I just think they're cool demos to watch. It'd be interesting to see how well their different benchmarks correlate with actual game performance.
Alexvrb - Sunday, July 18, 2021 - link
Oh thank goodness, we were running low on useless synthetic benchmarks that spit out nearly meaningless numbers.boozed - Sunday, July 18, 2021 - link
But pretty colours!