AMD Threadripper Pro Review: An Upgrade Over Regular Threadripper?
by Dr. Ian Cutress on July 14, 2021 9:00 AM EST- Posted in
- CPUs
- AMD
- ThreadRipper
- Threadripper Pro
- 3995WX
CPU Tests: Rendering
Rendering tests, compared to others, are often a little more simple to digest and automate. All the tests put out some sort of score or time, usually in an obtainable way that makes it fairly easy to extract. These tests are some of the most strenuous in our list, due to the highly threaded nature of rendering and ray-tracing, and can draw a lot of power. If a system is not properly configured to deal with the thermal requirements of the processor, the rendering benchmarks is where it would show most easily as the frequency drops over a sustained period of time. Most benchmarks in this case are re-run several times, and the key to this is having an appropriate idle/wait time between benchmarks to allow for temperatures to normalize from the last test.
Blender 2.83 LTS: Link
One of the popular tools for rendering is Blender, with it being a public open source project that anyone in the animation industry can get involved in. This extends to conferences, use in films and VR, with a dedicated Blender Institute, and everything you might expect from a professional software package (except perhaps a professional grade support package). With it being open-source, studios can customize it in as many ways as they need to get the results they require. It ends up being a big optimization target for both Intel and AMD in this regard.
For benchmarking purposes, we fell back to one rendering a frame from a detailed project. Most reviews, as we have done in the past, focus on one of the classic Blender renders, known as BMW_27. It can take anywhere from a few minutes to almost an hour on a regular system. However now that Blender has moved onto a Long Term Support model (LTS) with the 2.83 release, we decided to go for something different.

We use this scene, called PartyTug at 6AM by Ian Hubert, which is the official image of Blender 2.83. It is 44.3 MB in size, and uses some of the more modern compute properties of Blender. As it is more complex than the BMW scene, but uses different aspects of the compute model, time to process is roughly similar to before. We loop the scene for at least 10 minutes, taking the average time of the completions taken. Blender offers a command-line tool for batch commands, and we redirect the output into a text file.
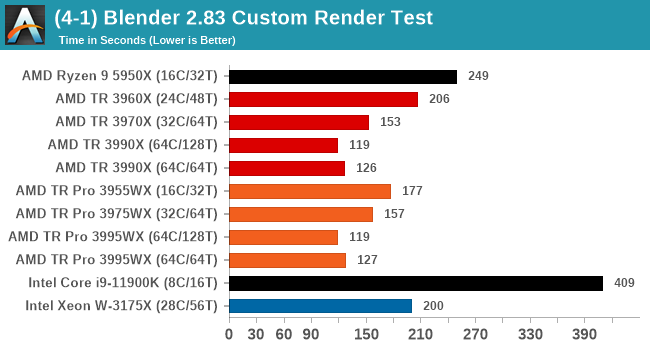
For Blender, we're seeing that SMT gives some extra performance in 64C mode, and comparing TR to TR Pro shows a big jump for the 3955WX over the 3960X despite having fewer cores, whereas the 32c TR is slightly faster than the 32c TR Pro. At 64c, there's little difference.
Corona 1.3: Link
Corona is billed as a popular high-performance photorealistic rendering engine for 3ds Max, with development for Cinema 4D support as well. In order to promote the software, the developers produced a downloadable benchmark on the 1.3 version of the software, with a ray-traced scene involving a military vehicle and a lot of foliage. The software does multiple passes, calculating the scene, geometry, preconditioning and rendering, with performance measured in the time to finish the benchmark (the official metric used on their website) or in rays per second (the metric we use to offer a more linear scale).
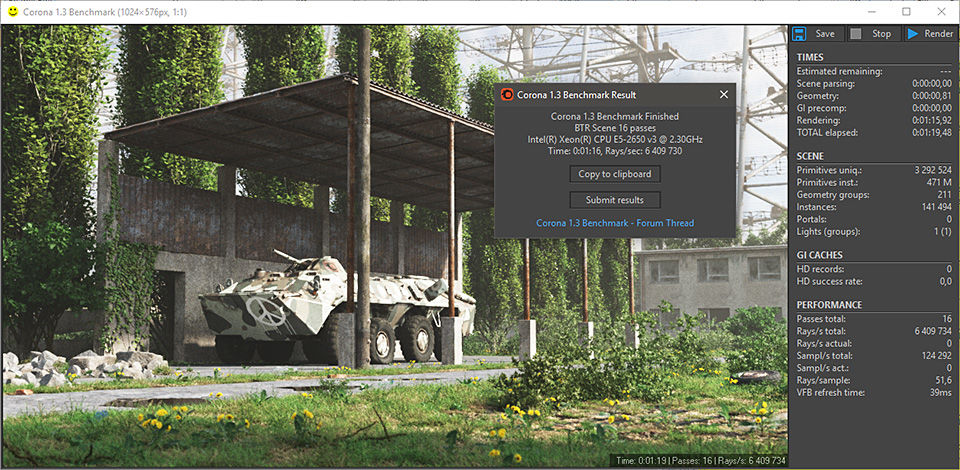
The standard benchmark provided by Corona is interface driven: the scene is calculated and displayed in front of the user, with the ability to upload the result to their online database. We got in contact with the developers, who provided us with a non-interface version that allowed for command-line entry and retrieval of the results very easily. We loop around the benchmark five times, waiting 60 seconds between each, and taking an overall average. The time to run this benchmark can be around 10 minutes on a Core i9, up to over an hour on a quad-core 2014 AMD processor or dual-core Pentium.
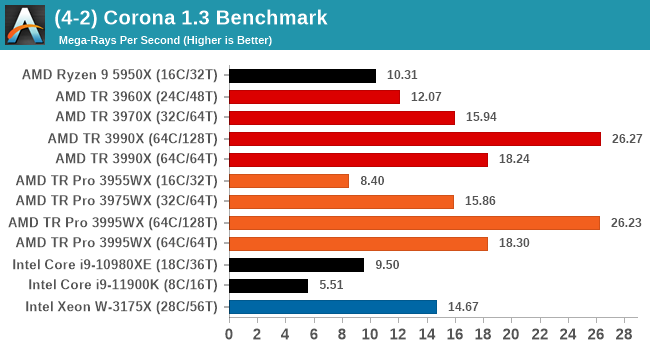
Corona is another bencmark where having SMT enabled does push the results higher, and there's no real difference between TR and TR Pro here.
Crysis CPU-Only Gameplay
One of the most oft used memes in computer gaming is ‘Can It Run Crysis?’. The original 2007 game, built in the Crytek engine by Crytek, was heralded as a computationally complex title for the hardware at the time and several years after, suggesting that a user needed graphics hardware from the future in order to run it. Fast forward over a decade, and the game runs fairly easily on modern GPUs.
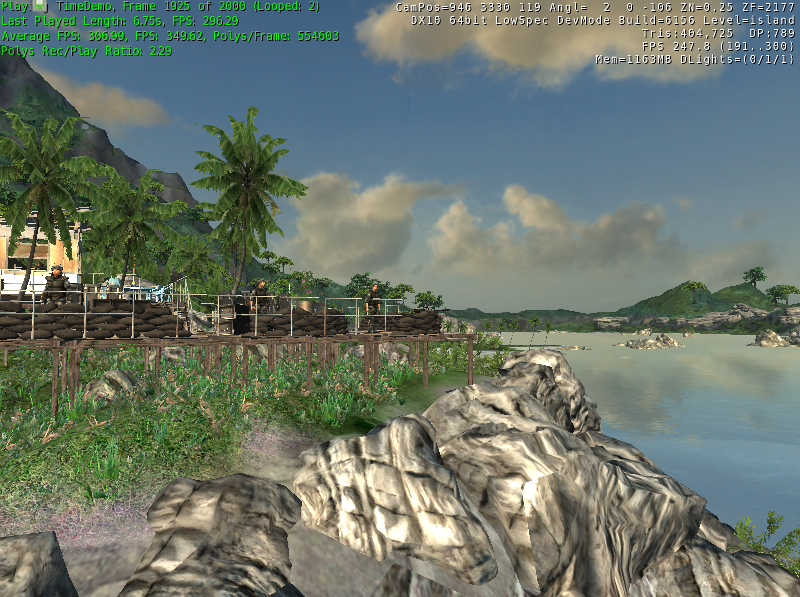
But can we also apply the same concept to pure CPU rendering? Can a CPU, on its own, render Crysis? Since 64 core processors entered the market, one can dream. So we built a benchmark to see whether the hardware can.
For this test, we’re running Crysis’ own GPU benchmark, but in CPU render mode. This is a 2000 frame test, with medium and low settings.
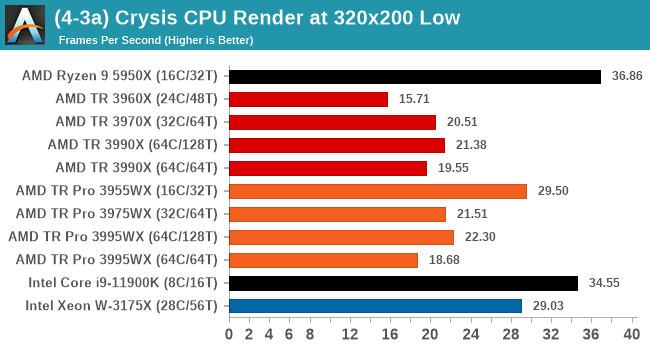
Crysis CPU only has two main limitations: either 32 threads, or 23 cores. We typically run across 16 cores with all threads, and this benchmark tends to prefer cores with high IPC. The 3955WX seems to perform best here, although the Intel options come out ahead.
POV-Ray 3.7.1: Link
A long time benchmark staple, POV-Ray is another rendering program that is well known to load up every single thread in a system, regardless of cache and memory levels. After a long period of POV-Ray 3.7 being the latest official release, when AMD launched Ryzen the POV-Ray codebase suddenly saw a range of activity from both AMD and Intel, knowing that the software (with the built-in benchmark) would be an optimization tool for the hardware.
We had to stick a flag in the sand when it came to selecting the version that was fair to both AMD and Intel, and still relevant to end-users. Version 3.7.1 fixes a significant bug in the early 2017 code that was advised against in both Intel and AMD manuals regarding to write-after-read, leading to a nice performance boost.
The benchmark can take over 20 minutes on a slow system with few cores, or around a minute or two on a fast system, or seconds with a dual high-core count EPYC. Because POV-Ray draws a large amount of power and current, it is important to make sure the cooling is sufficient here and the system stays in its high-power state. Using a motherboard with a poor power-delivery and low airflow could create an issue that won’t be obvious in some CPU positioning if the power limit only causes a 100 MHz drop as it changes P-states.
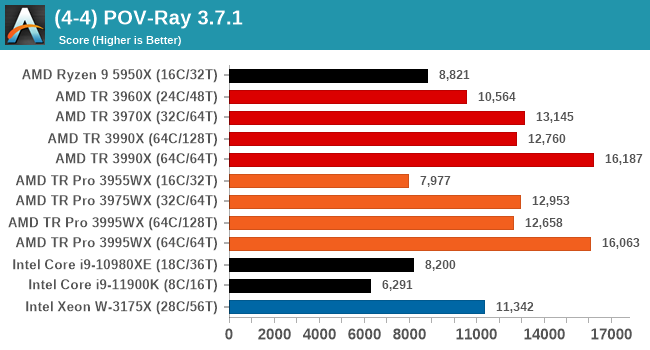
POV-Ray seems to prefer the 64C/64T variants of Threadripper, but the difference between TR and TR Pro is ever so slightly in favor of the higher frequency TR processors.
V-Ray: Link
We have a couple of renderers and ray tracers in our suite already, however V-Ray’s benchmark came through for a requested benchmark enough for us to roll it into our suite. Built by ChaosGroup, V-Ray is a 3D rendering package compatible with a number of popular commercial imaging applications, such as 3ds Max, Maya, Undreal, Cinema 4D, and Blender.
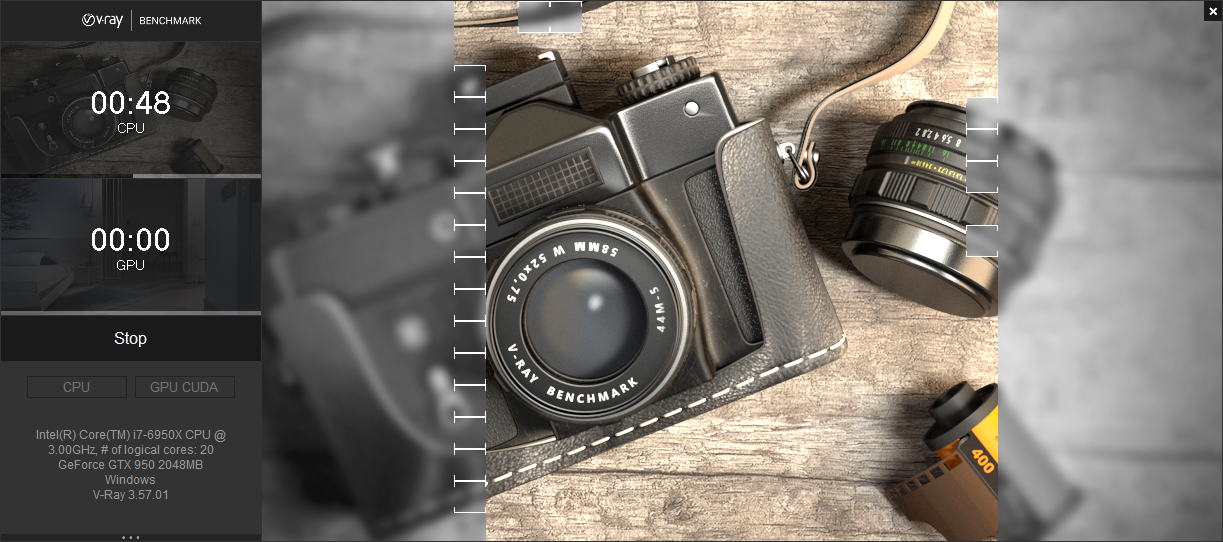
We run the standard standalone benchmark application, but in an automated fashion to pull out the result in the form of kilosamples/second. We run the test six times and take an average of the valid results.
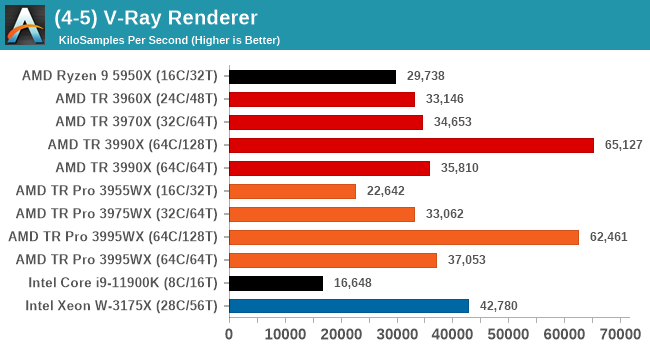
V-Ray shows benefit from having all 128 threads enabled, and it is interesting here that the performance difference between the 32c and 64c/64t options is next to zero. The W-3175X does well here by contrast, beating out the 32c variants.
Cinebench R20: Link
Another common stable of a benchmark suite is Cinebench. Based on Cinema4D, Cinebench is a purpose built benchmark machine that renders a scene with both single and multi-threaded options. The scene is identical in both cases. The R20 version means that it targets Cinema 4D R20, a slightly older version of the software which is currently on version R21. Cinebench R20 was launched given that the R15 version had been out a long time, and despite the difference between the benchmark and the latest version of the software on which it is based, Cinebench results are often quoted a lot in marketing materials.
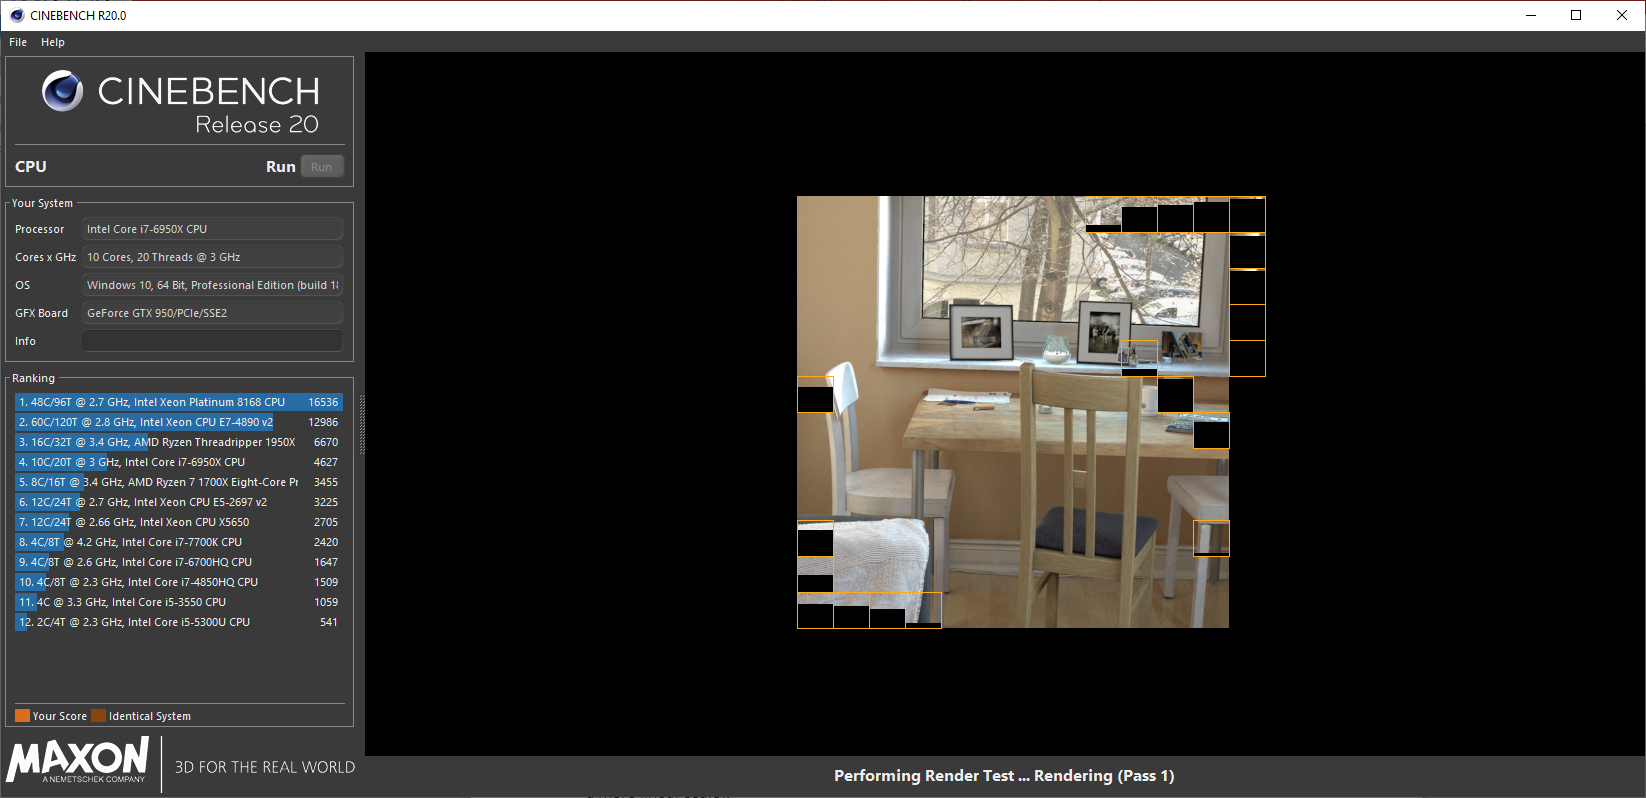
Results for Cinebench R20 are not comparable to R15 or older, because both the scene being used is different, but also the updates in the code path. The results are output as a score from the software, which is directly proportional to the time taken. Using the benchmark flags for single CPU and multi-CPU workloads, we run the software from the command line which opens the test, runs it, and dumps the result into the console which is redirected to a text file. The test is repeated for a minimum of 10 minutes for both ST and MT, and then the runs averaged.
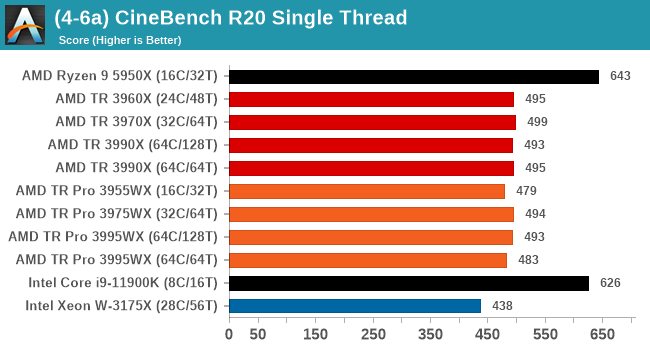
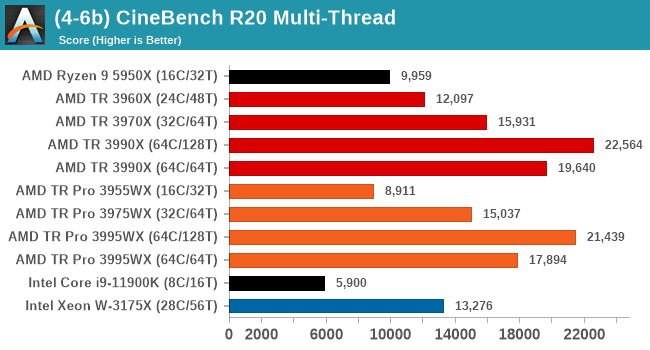
CBR20 scales up to 128 threads no problem, but we're seeing a preference in TR over TR Pro in this test where memory bandwidth doesn't matter much.


98 Comments
View All Comments
Rocket_Scientist - Friday, July 16, 2021 - link
I want to know who spends 5 grand on a processor but doesn't spend the few extra dollars to utilize all 8 memory channels!Mikewind Dale - Friday, July 16, 2021 - link
The 3955WX processor "only" costs $1,150, while each stick of 64 GB RAM costs $350.And I wanted to keep some empty slots in case 128 GB RDIMMs became affordable. But I didn't know that using 6 channels would cause so much performance degradation.
mode_13h - Saturday, July 17, 2021 - link
> who spends 5 grand on a processor but doesn't spend> the few extra dollars to utilize all 8 memory channels!
Although I tend to agree, the article did reveal some benchmarks where the additional bandwidth provides negligible benefit.
lmh - Tuesday, July 27, 2021 - link
Can you share what memory bandwidth you actually measured in the 3955WX 8-channel configuration?McFig - Wednesday, July 14, 2021 - link
There’s an error in the table “AMD 32-Core Zen 2 Comparison”: The MSRPs are mixed up.McFig - Wednesday, July 14, 2021 - link
Also: “code bath”; “Undreal” (I’m guessing should be “Unreal”?); “but also the updates” (e.g. could be “but also there were significant updates”)SarahKerrigan - Wednesday, July 14, 2021 - link
I kind of like "Code Bath."Threska - Wednesday, July 14, 2021 - link
" This is part of AMD’s guaranteed supply chain process, allowing OEMs to hard lock processors into certain vendors for supply chain end-to-end security that is requested by specific customers."I ASSUME that's a feature a certain OS vendor can't access.
"Only select vendors seem to have access/licenses to make WRX80 motherboards, and your main options are:"
I've seen the Giga offered as a burn-in special with a bundled processor, making it a better deal. The Asus is nice but I have to wonder if it's worth all the features.
DesireeTR - Wednesday, July 14, 2021 - link
No, It's worse. There's article about AMD Platform Secure Boot Feature (PSB) by servethehome together with Dell EMC. It basically burns permanently a public key of the OEM into the EPYC processor. It creates a guarantee that both motherboard and processor are not tampered. If you move your processor from OEM A that enabled PSB to motherboard of OEM B, AMD Secure Processor considers that as tampering and stops it working. The reverse is true.Some OEM are very strict (Dell EMC does this by hardware burn-in), some are less strict (HPE use
DesireeTR - Wednesday, July 14, 2021 - link
HPE only locks the public key in the firmware, and perform tamper check on BIOS only). And I guess before long, all PRO processor might get the same PSB feature too.