Sabrent Rocket Q4 and Corsair MP600 CORE NVMe SSDs Reviewed: PCIe 4.0 with QLC
by Billy Tallis on April 9, 2021 12:45 PM ESTBurst IO Performance
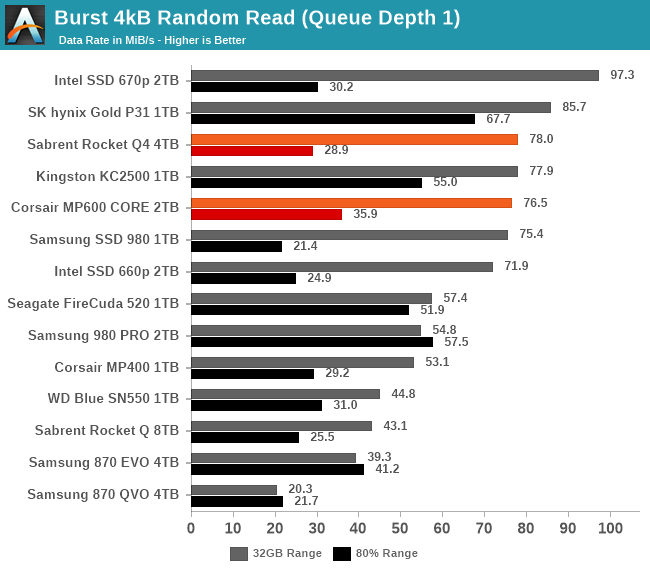
Our burst IO tests operate at queue depth 1 and perform several short data transfers interspersed with idle time. The random read and write tests consist of 32 bursts of up to 64MB each. The sequential read and write tests use eight bursts of up to 128MB each. For more details, please see the overview of our 2021 Consumer SSD Benchmark Suite.
 |
|||||||||
| Random Read | Random Write | ||||||||
| Sequential Read | Sequential Write | ||||||||
The random read performance from the SLC caches on the Rocket Q4 and MP600 CORE are plenty fast, albeit still not able to match the Intel SSD 670p. Outside the cache, the two Phison E16 QLC drives are definitely slower than mainstream TLC drives, but their performance is fine by QLC standards.
For short bursts of writes that don't overflow the SLC cache, these drives are very fast and their caches are still useful even when the drive as a whole is 80% full.
As is often the case for Phison-based drives, the low queue depth sequential read performance is still not great, but sequential writes are very fast and do reach PCIe Gen4 speeds.
Sustained IO Performance
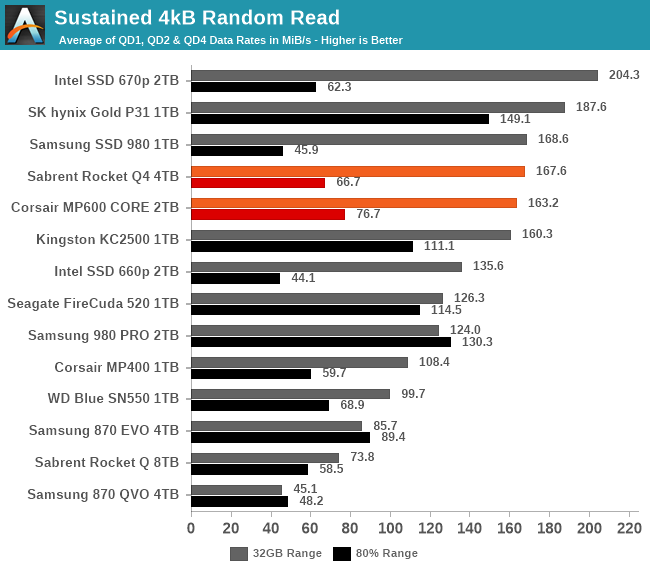
Our sustained IO tests exercise a range of queue depths and transfer more data than the burst IO tests, but still have limits to keep the duration somewhat realistic. The primary scores we report are focused on the low queue depths that make up the bulk of consumer storage workloads. For more details, please see the overview of our 2021 Consumer SSD Benchmark Suite.
 |
|||||||||
| Random Read | Throughput | Power | Efficiency | ||||||
| Random Write | Throughput | Power | Efficiency | ||||||
| Sequential Read | Throughput | Power | Efficiency | ||||||
| Sequential Write | Throughput | Power | Efficiency | ||||||
The random read performance from the Rocket Q4 and MP600 CORE is greatly improved over the earlier Phison E12 QLC SSDs, at least when the test is hitting a narrow slice of the drive that should be entirely within the SLC cache. Random and sequential write results are both decent given that these are in many ways still low-end drives. These two drives are large enough (and have enough SLC cache) to handle much larger bursts of writes than 1TB models, even when the drives are 80% full.
 |
|||||||||
| Random Read | |||||||||
| Random Write | |||||||||
| Sequential Read | |||||||||
| Sequential Write | |||||||||
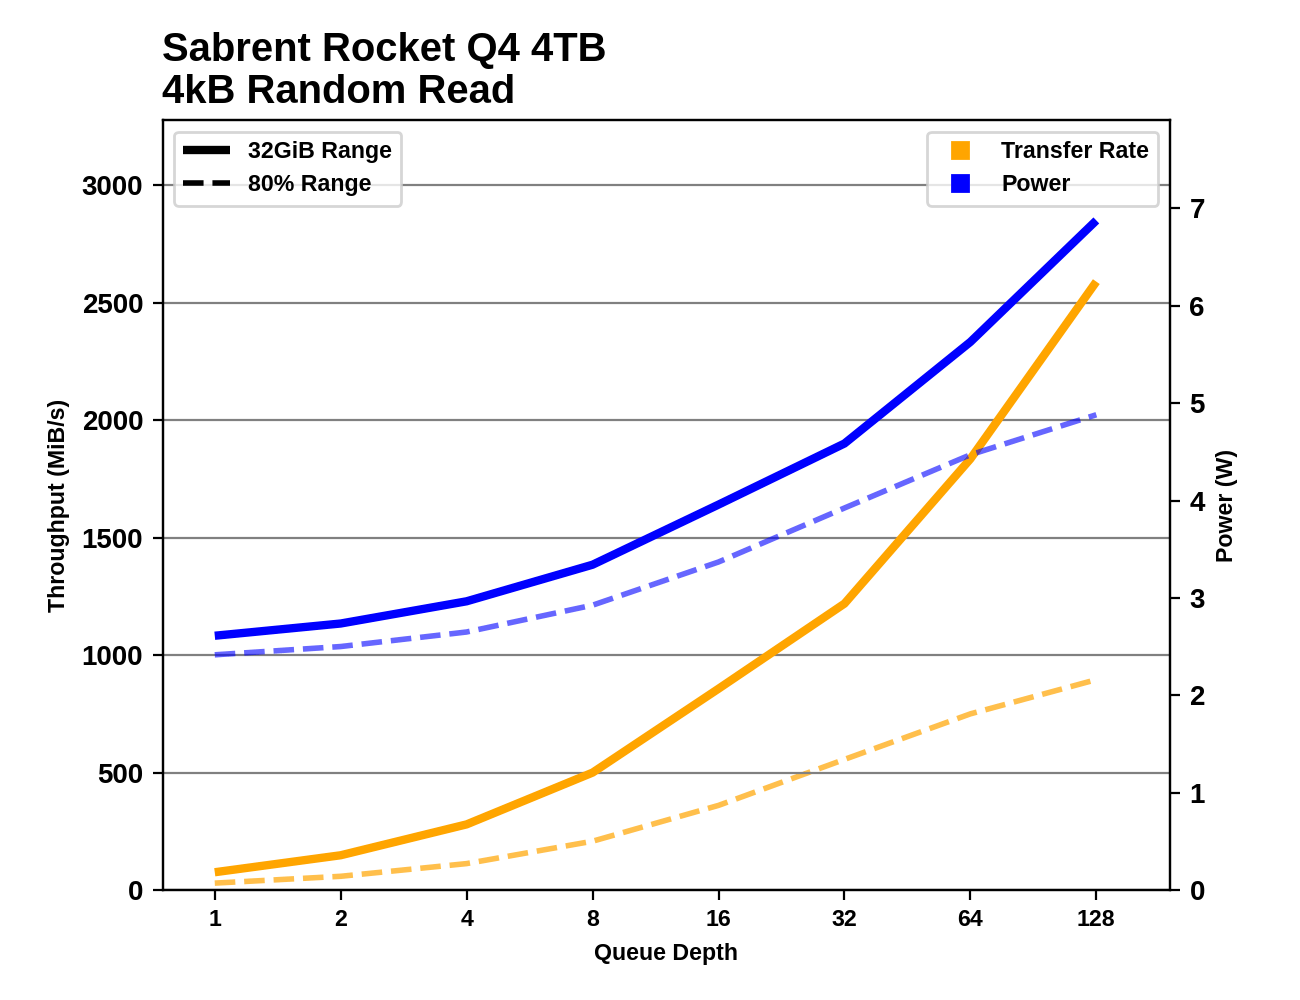
The E16-based QLC drives are able to continue scaling up random read throughput (from the SLC cache, at least) long past the points where other QLC drives hit a performance wall. The 4TB Rocket Q4 scales better than the 2TB MP600 CORE, and by QD128 it is handling random reads at 2.5GB/s and still has headroom for more performance. For random writes, the Rocket Q4 and MP600 CORE saturate around QD4 or a bit later, which is fairly typical behavior.
When testing sequential reads, we get the characteristic behavior from Phison controllers: poor throughput until around QD16 or so, at which point there's enough data in flight at any given time to allow the SSD controller to stay properly busy. The sequential write results are messy since both drives run out of SLC cache frequently during this test, and that makes it hard to identify what the performance limits would be in more favorable conditions. But it appears that sequential write speed is saturating around QD2, and stays flat with increasing queue depth except when the caching troubles come up.
Random Read Latency
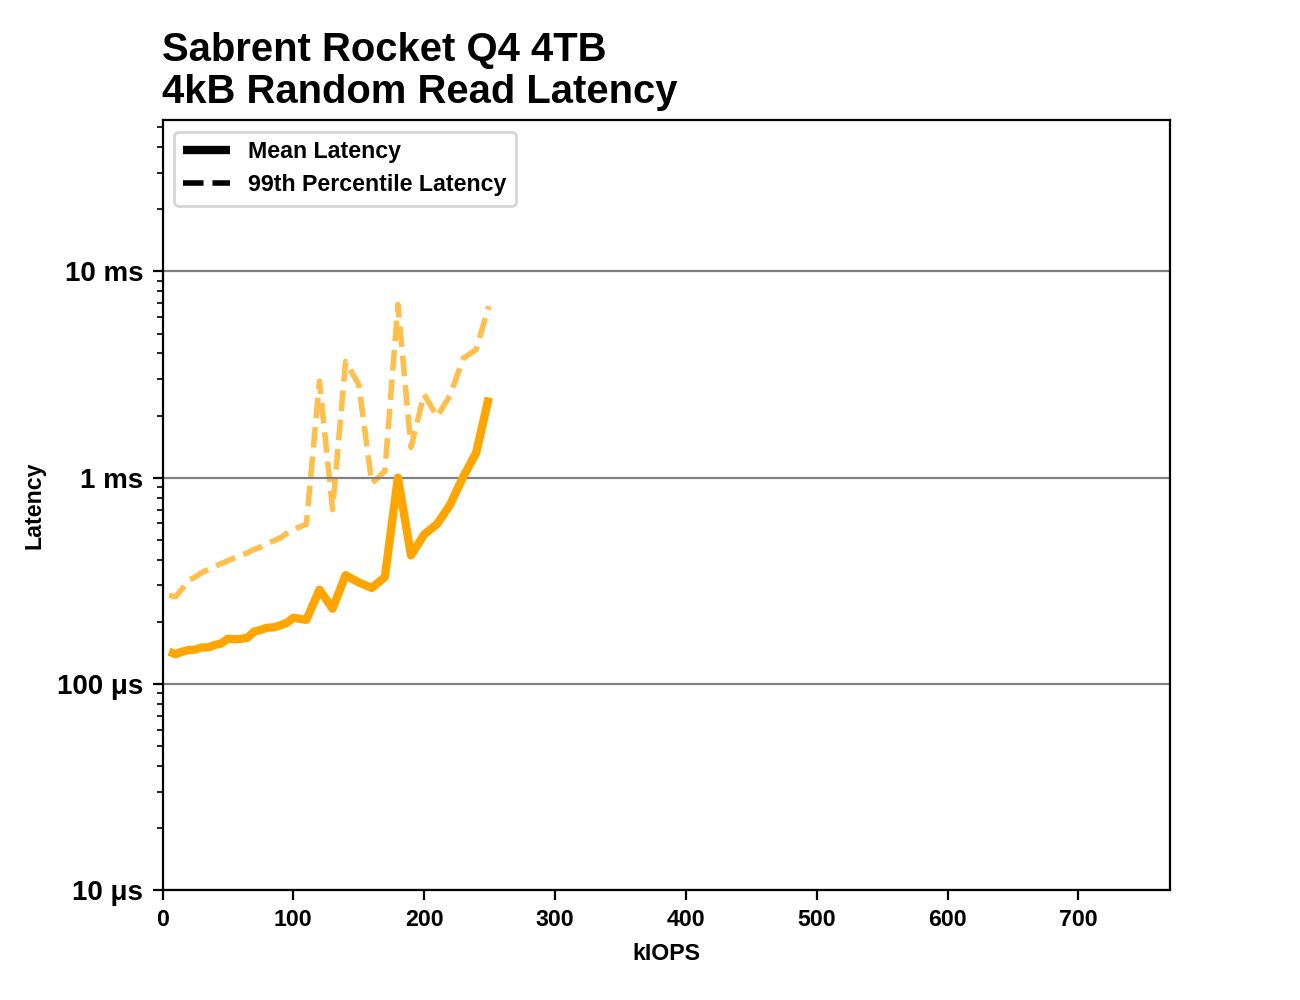
This test illustrates how drives with higher throughput don't always offer better IO latency and Quality of Service (QoS), and that latency often gets much worse when a drive is pushed to its limits. This test is more intense than real-world consumer workloads and the results can be a bit noisy, but large differences that show up clearly on a log scale plot are meaningful. For more details, please see the overview of our 2021 Consumer SSD Benchmark Suite.
 |
|||||||||
The Sabrent Rocket Q4 and Corsair MP660 CORE show better latency on this test than the other low-end NVMe drives, but all the mainstream TLC drives with DRAM have clear advantages. Even the Samsung 870 EVO has lower latency until it gets close to saturating the SATA link. Between the 2TB MP600 CORE and the 4TB Rocket Q4, the larger drive unsurprisingly can sustain higher random read throughput and its latency climbs more gradually, but the Rocket Q4 does have more transient latency spikes along the way.


60 Comments
View All Comments
allenb - Sunday, April 11, 2021 - link
This whining about QLC is an amazing mix of comedy and incompetence. Who cares about the storage medium? If your data is written to petrified goose excrement, what does it matter if the delivered performance meets your needs?Faceless corporations screw us over in plenty of legitimate ways. Why make up new things to get pissed off about?
Do the math or look at your actual usage data. Very few individuals are generating enough write traffic for endurance to be a concern. As others have stated here.
JoeDuarte - Sunday, April 11, 2021 - link
Bugs and bad software developers can cause significant degradation of SSD endurance. There was a bug in the Spotify desktop app a couple of years ago that caused massive writes, way beyond normal use, which affected SSD owners the most.And there are apparently issues with Apple's M1 Macbooks, though I haven't kept up. It might have been related to their stingy RAM allotment (8 GB), causing excessive SSD swap.
Endurance will matter when it's as bad as these drives, which is the worst I've ever seen.
Oxford Guy - Tuesday, April 13, 2021 - link
Probably nanosecond timestamps in APFS with various spyware running amok.edzieba - Monday, April 12, 2021 - link
Oh shush, next you'll be telling them that bus interface speed or heatsink presence/size is not an useful indicator of drive performance!ZolaIII - Friday, April 16, 2021 - link
Sure take an example of guy who likes to watch the movies on it's new TV. He whatches 50 movie a month. He takes 4K Blue-ray discs but wants to convert them to 4K HDR + HLG (H265 10 Bit HLG+) format to match the display capabilities as good as possible. In order to do that in real time he uses GPU conversion and as it sucks regarding quality he puts 2x higher bit rate doing so. Of course he first copy them to SSD. That's (50x50) GB x3 = 7.32 TB per month or almost 88 TB per year for one or two muvies every day. When you add rest it comes to at least 100 TB a year. Example is realistic with not to much or extensive usage and illustration of how QLC endurance simply is concerning.FunBunny2 - Saturday, April 17, 2021 - link
"almost 88 TB per year for one or two muvies every day. When you add rest it comes to at least 100 TB a year."well... such a knucklehead obviously doesn't have any time devoted to work, so s/he's either a rich real estate developer or a welfare queen/king. :)
ZolaIII - Sunday, April 18, 2021 - link
Why? If you work from 9 to 5 you don't have time to watch a movie or two (especially if you like watching movies)?DracoDan - Monday, April 19, 2021 - link
They should sell a single SSD that can be user configured as a 4TB QLC, 2TB TLC, 1TB MLC, or 512GB SLC SSD. That way the end user has the ability to decide the tradeoff for space vs performance!Billy Tallis - Tuesday, April 20, 2021 - link
Your math is off, possibly because of the common misunderstanding of the difference between the number of bits stored per memory cell and the number of possible voltage states required to represent those bits.It would be 4TB as QLC, 3TB as TLC, 2TB as MLC or 1TB as SLC. See the Whole-Drive Fill test which illustrates that the 4TB drive has up to 1TB of SLC cache.
xJumpManx - Monday, May 3, 2021 - link
If you have a X570 Taichi do not buy sabrent ssd the mobo does not detect the drive.