Intel Core i7-11700K Review: Blasting Off with Rocket Lake
by Dr. Ian Cutress on March 5, 2021 4:30 PM EST- Posted in
- CPUs
- Intel
- 14nm
- Xe-LP
- Rocket Lake
- Cypress Cove
- i7-11700K
CPU Tests: Simulation
Simulation and Science have a lot of overlap in the benchmarking world, however for this distinction we’re separating into two segments mostly based on the utility of the resulting data. The benchmarks that fall under Science have a distinct use for the data they output – in our Simulation section, these act more like synthetics but at some level are still trying to simulate a given environment.
DigiCortex v1.35: link
DigiCortex is a pet project for the visualization of neuron and synapse activity in the brain. The software comes with a variety of benchmark modes, and we take the small benchmark which runs a 32k neuron/1.8B synapse simulation, similar to a small slug.
The results on the output are given as a fraction of whether the system can simulate in real-time, so anything above a value of one is suitable for real-time work. The benchmark offers a 'no firing synapse' mode, which in essence detects DRAM and bus speed, however we take the firing mode which adds CPU work with every firing.

The software originally shipped with a benchmark that recorded the first few cycles and output a result. So while fast multi-threaded processors this made the benchmark last less than a few seconds, slow dual-core processors could be running for almost an hour. There is also the issue of DigiCortex starting with a base neuron/synapse map in ‘off mode’, giving a high result in the first few cycles as none of the nodes are currently active. We found that the performance settles down into a steady state after a while (when the model is actively in use), so we asked the author to allow for a ‘warm-up’ phase and for the benchmark to be the average over a second sample time.
For our test, we give the benchmark 20000 cycles to warm up and then take the data over the next 10000 cycles seconds for the test – on a modern processor this takes 30 seconds and 150 seconds respectively. This is then repeated a minimum of 10 times, with the first three results rejected. Results are shown as a multiple of real-time calculation.
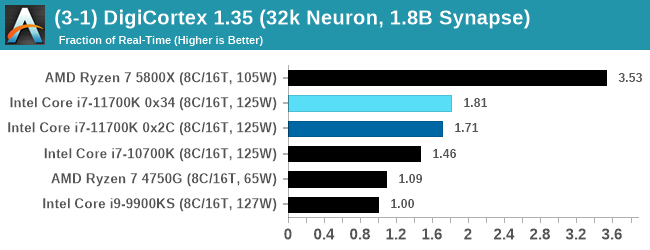
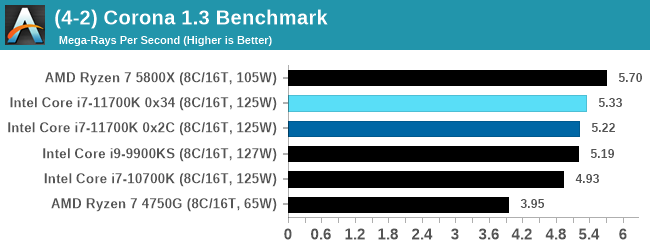
AMD's single chiplet design seems to get a big win here, but DigiCortex can use AVX-512 so the 11700K gets a healthy boost over the previous generation.
Dwarf Fortress 0.44.12: Link
Another long standing request for our benchmark suite has been Dwarf Fortress, a popular management/roguelike indie video game, first launched in 2006 and still being regularly updated today, aiming for a Steam launch sometime in the future.
Emulating the ASCII interfaces of old, this title is a rather complex beast, which can generate environments subject to millennia of rule, famous faces, peasants, and key historical figures and events. The further you get into the game, depending on the size of the world, the slower it becomes as it has to simulate more famous people, more world events, and the natural way that humanoid creatures take over an environment. Like some kind of virus.
For our test we’re using DFMark. DFMark is a benchmark built by vorsgren on the Bay12Forums that gives two different modes built on DFHack: world generation and embark. These tests can be configured, but range anywhere from 3 minutes to several hours. After analyzing the test, we ended up going for three different world generation sizes:
- Small, a 65x65 world with 250 years, 10 civilizations and 4 megabeasts
- Medium, a 127x127 world with 550 years, 10 civilizations and 4 megabeasts
- Large, a 257x257 world with 550 years, 40 civilizations and 10 megabeasts
DFMark outputs the time to run any given test, so this is what we use for the output. We loop the small test for as many times possible in 10 minutes, the medium test for as many times in 30 minutes, and the large test for as many times in an hour.
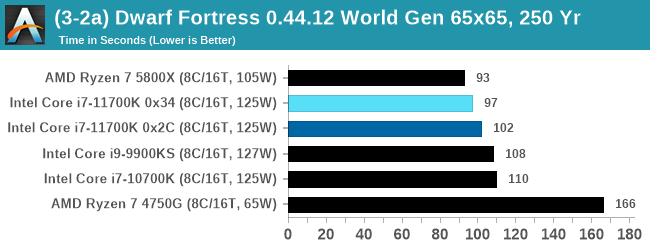
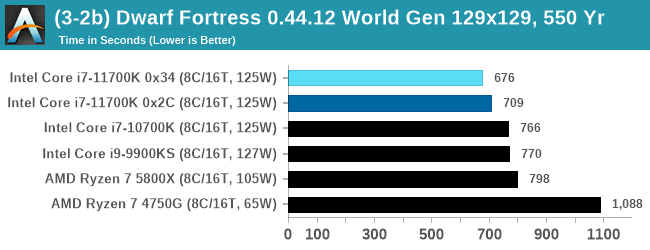
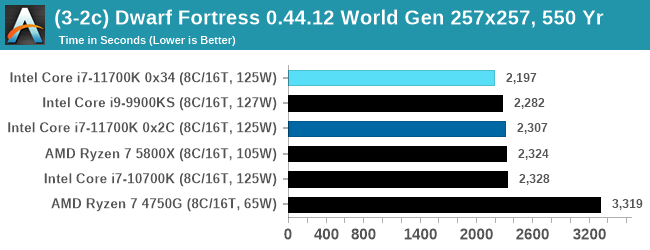
With the small worlds, the 11700K gets a small boost over previous Intel hardware, but this evens out as the worlds get bigger.
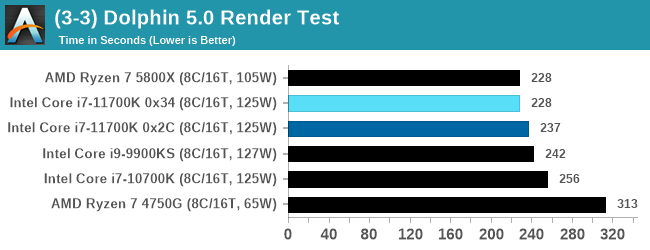
Dolphin v5.0 Emulation: Link
Many emulators are often bound by single thread CPU performance, and general reports tended to suggest that Haswell provided a significant boost to emulator performance. This benchmark runs a Wii program that ray traces a complex 3D scene inside the Dolphin Wii emulator. Performance on this benchmark is a good proxy of the speed of Dolphin CPU emulation, which is an intensive single core task using most aspects of a CPU. Results are given in seconds, where the Wii itself scores 1051 seconds.
CPU Tests: Rendering
Rendering tests, compared to others, are often a little more simple to digest and automate. All the tests put out some sort of score or time, usually in an obtainable way that makes it fairly easy to extract. These tests are some of the most strenuous in our list, due to the highly threaded nature of rendering and ray-tracing, and can draw a lot of power. If a system is not properly configured to deal with the thermal requirements of the processor, the rendering benchmarks is where it would show most easily as the frequency drops over a sustained period of time. Most benchmarks in this case are re-run several times, and the key to this is having an appropriate idle/wait time between benchmarks to allow for temperatures to normalize from the last test.
Blender 2.83 LTS: Link
One of the popular tools for rendering is Blender, with it being a public open source project that anyone in the animation industry can get involved in. This extends to conferences, use in films and VR, with a dedicated Blender Institute, and everything you might expect from a professional software package (except perhaps a professional grade support package). With it being open-source, studios can customize it in as many ways as they need to get the results they require. It ends up being a big optimization target for both Intel and AMD in this regard.
For benchmarking purposes, we fell back to one rendering a frame from a detailed project. Most reviews, as we have done in the past, focus on one of the classic Blender renders, known as BMW_27. It can take anywhere from a few minutes to almost an hour on a regular system. However now that Blender has moved onto a Long Term Support model (LTS) with the latest 2.83 release, we decided to go for something different.
We use this scene, called PartyTug at 6AM by Ian Hubert, which is the official image of Blender 2.83. It is 44.3 MB in size, and uses some of the more modern compute properties of Blender. As it is more complex than the BMW scene, but uses different aspects of the compute model, time to process is roughly similar to before. We loop the scene for at least 10 minutes, taking the average time of the completions taken. Blender offers a command-line tool for batch commands, and we redirect the output into a text file.
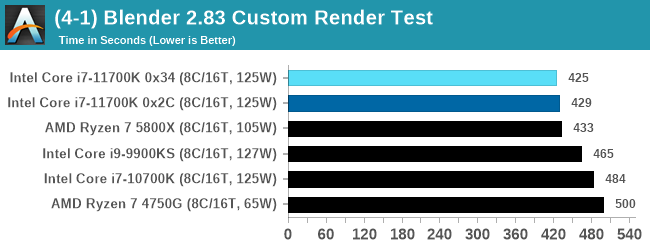
A marginal win for Intel in Blender is a good result, as well as a few % points over the 5.0 GHz 9900KS.
Corona 1.3: Link
Corona is billed as a popular high-performance photorealistic rendering engine for 3ds Max, with development for Cinema 4D support as well. In order to promote the software, the developers produced a downloadable benchmark on the 1.3 version of the software, with a ray-traced scene involving a military vehicle and a lot of foliage. The software does multiple passes, calculating the scene, geometry, preconditioning and rendering, with performance measured in the time to finish the benchmark (the official metric used on their website) or in rays per second (the metric we use to offer a more linear scale).
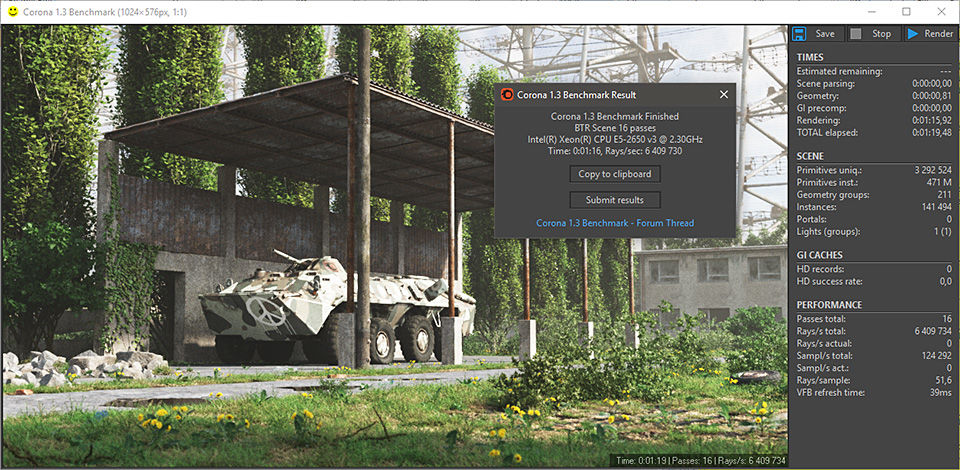
The standard benchmark provided by Corona is interface driven: the scene is calculated and displayed in front of the user, with the ability to upload the result to their online database. We got in contact with the developers, who provided us with a non-interface version that allowed for command-line entry and retrieval of the results very easily. We loop around the benchmark five times, waiting 60 seconds between each, and taking an overall average. The time to run this benchmark can be around 10 minutes on a Core i9, up to over an hour on a quad-core 2014 AMD processor or dual-core Pentium.
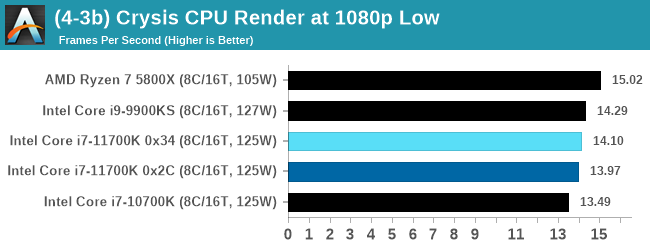
Crysis CPU-Only Gameplay
One of the most oft used memes in computer gaming is ‘Can It Run Crysis?’. The original 2007 game, built in the Crytek engine by Crytek, was heralded as a computationally complex title for the hardware at the time and several years after, suggesting that a user needed graphics hardware from the future in order to run it. Fast forward over a decade, and the game runs fairly easily on modern GPUs.
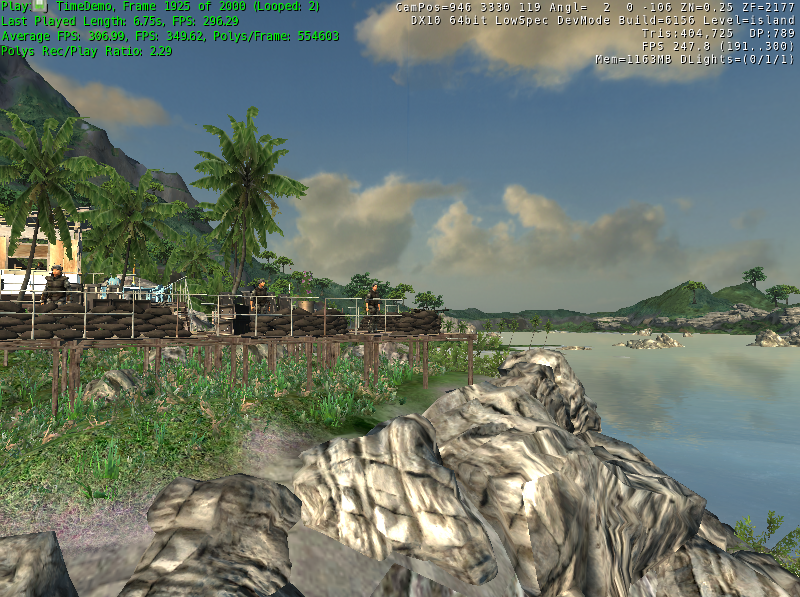
But can we also apply the same concept to pure CPU rendering? Can a CPU, on its own, render Crysis? Since 64 core processors entered the market, one can dream. So we built a benchmark to see whether the hardware can.
For this test, we’re running Crysis’ own GPU benchmark, but in CPU render mode. This is a 2000 frame test, with medium and low settings.
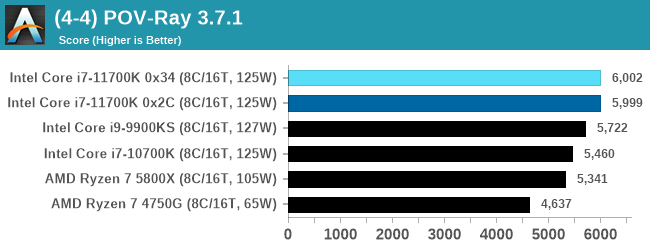
POV-Ray 3.7.1: Link
A long time benchmark staple, POV-Ray is another rendering program that is well known to load up every single thread in a system, regardless of cache and memory levels. After a long period of POV-Ray 3.7 being the latest official release, when AMD launched Ryzen the POV-Ray codebase suddenly saw a range of activity from both AMD and Intel, knowing that the software (with the built-in benchmark) would be an optimization tool for the hardware.
We had to stick a flag in the sand when it came to selecting the version that was fair to both AMD and Intel, and still relevant to end-users. Version 3.7.1 fixes a significant bug in the early 2017 code that was advised against in both Intel and AMD manuals regarding to write-after-read, leading to a nice performance boost.

The benchmark can take over 20 minutes on a slow system with few cores, or around a minute or two on a fast system, or seconds with a dual high-core count EPYC. Because POV-Ray draws a large amount of power and current, it is important to make sure the cooling is sufficient here and the system stays in its high-power state. Using a motherboard with a poor power-delivery and low airflow could create an issue that won’t be obvious in some CPU positioning if the power limit only causes a 100 MHz drop as it changes P-states.
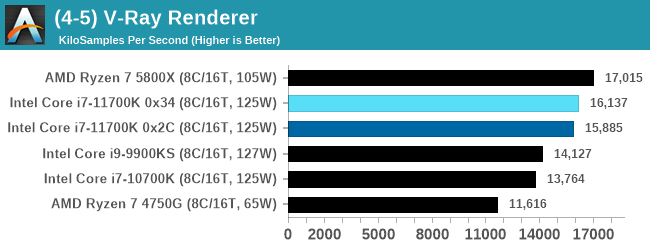
V-Ray: Link
We have a couple of renderers and ray tracers in our suite already, however V-Ray’s benchmark came through for a requested benchmark enough for us to roll it into our suite. Built by ChaosGroup, V-Ray is a 3D rendering package compatible with a number of popular commercial imaging applications, such as 3ds Max, Maya, Undreal, Cinema 4D, and Blender.

We run the standard standalone benchmark application, but in an automated fashion to pull out the result in the form of kilosamples/second. We run the test six times and take an average of the valid results.
Cinebench R20: Link
Another common stable of a benchmark suite is Cinebench. Based on Cinema4D, Cinebench is a purpose built benchmark machine that renders a scene with both single and multi-threaded options. The scene is identical in both cases. The R20 version means that it targets Cinema 4D R20, a slightly older version of the software which is currently on version R21. Cinebench R20 was launched given that the R15 version had been out a long time, and despite the difference between the benchmark and the latest version of the software on which it is based, Cinebench results are often quoted a lot in marketing materials.
Results for Cinebench R20 are not comparable to R15 or older, because both the scene being used is different, but also the updates in the code bath. The results are output as a score from the software, which is directly proportional to the time taken. Using the benchmark flags for single CPU and multi-CPU workloads, we run the software from the command line which opens the test, runs it, and dumps the result into the console which is redirected to a text file. The test is repeated for a minimum of 10 minutes for both ST and MT, and then the runs averaged.
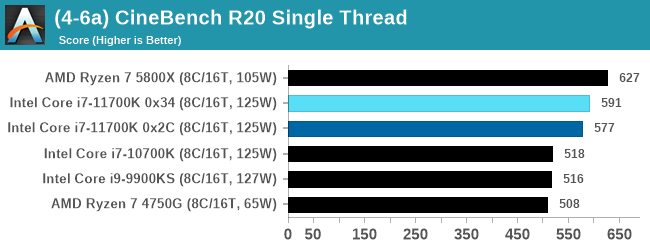
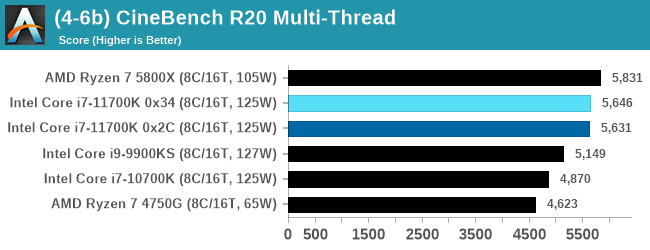
The improvement in Cinebench R20 is a good measure over previous generations of Intel. However mobile Tiger Lake scores 593 at 28 W, still ahead of the 11700K, and they are all behind AMD.


541 Comments
View All Comments
blppt - Saturday, March 13, 2021 - link
They did try to at least 'ride it out' until Zen could get done, and that required smoothing out the rough edges, so they did devote some resources.BD/PD never did any better than a low-end solution for the desktop/laptop market, but they had to offer something until Zen was done.
Oxford Guy - Sunday, March 28, 2021 - link
'They did try to at least 'ride it out' until Zen could get done, and that required smoothing out the rough edges, so they did devote some resources.'Wow... watch the goal posts move.
Riding out = doing nothing. Piledriver was not improved. The entire higher-performance & supercomputer market was unchanged from Piledriver to Zen. All AMD did was ship cheap knock-off APU rubbish and console trash.
The fact that AMD succeeded with Zen is probably mostly a testament to one largely ignored feature of monopoly power: the monopolist can become so slow and inefficient that a nearly dead competitor can come back to best it. That's not symptomatic of a well-run economic system. It's a trainwreck.
AMD should have been wealthy enough to do proper R&D and bulldozer would have never happened in the first place. But, Intel was a huge abusive monopolist and everyone went right along, content to feed the problem. After AMD did Bulldozer and Piledriver the company should have been dead. If there had been adequate competition it would have been. So, ironically, AMD can thank Intel for being its only competition, for resting on its laurels because of its extreme monopolization.
GeoffreyA - Wednesday, March 10, 2021 - link
Oxford Guy. I don't remember the exact details and am running largely from memory here. Yes, I agree, Bulldozer had far lower IPC than Phenom, but, according to their belief, was supposed to restore them to the top and knock Intel down. In practice, it failed miserably and was worse even than Netburst. Credit must be given, however, for their raising Bulldozer's IPC a lot each generation (something like 20-30% if I remember right), and curtailing power. It also addressed weaknesses in K10 and surpassed K10's IPC eventually. Anyway, working against such a hopeless design surely taught them a lot; and pouring that knowledge into a classic x86 design, Zen, took it further than Skylake after just one iteration.AMD would have done better had they just persisted with K10, which wasn't that far behind Nehalem. But, perhaps we wouldn't have had Zen: it took AMD's going through the lowest depths, passing through the fire as it were, to become what they are today, leaving Intel baffled. I agree, they were truly idiotic in the last decade but no more. May it stay that way!
Concerning CMT, I don't know much about it to comment, but think Bulldozer's principal weakness came from sharing execution units---the FP units I believe and others---between modules. Zen kept each core separate and gave it full (and weighty) resources, along with a micro-op cache and other improvements. As for Jaguar, it may be junk from a desktop point of view, yes, but was excellent in its domain and left Atom in the dust.
Oxford Guy - Sunday, March 28, 2021 - link
'Credit must be given, however, for their raising Bulldozer's IPC a lot each generation (something like 20-30% if I remember right), and curtailing power.'Piledriver was a small IPC improvement and regressed in AVX. Piledriver's AVX was so extremely poor that it was faster to not use it. Piledriver was a massive power hog. The 32nm SOI process node, according to 'TheStilt' was improved over time which is probably the main source of power efficiency improvement in Piledriver versus Bulldozer. I do not recall the IPC improvement of Piledriver over Bulldozer but it was nothing close to 20% I think. Instead, it merely made it possible to raise clocks further, along with the aforementioned node improvement. And, 'TheStilt' said the node got better after Piledriver's first generation. The 'E' parts, for instance, were quite a lot improved in leakage — but the whole line (other than the 9000 series which he said should have been sent to the scrapper) improved in leakage. What didn't improve, sadly, is the bad Piledriver design. AMD never bothered to fix it.
While Piledriver, when clocked high (like 4.7 GHz) could be relevant against Sandy in multi-thread (including well-threaded games like Desert of Kharak) it was extremely pitiful in single-thread. And, it sucked down boatloads of power to get to 4.7, even with the best-leakage chips.
And, going back to your 20–30% claim. Steamroller, which was considered a serious disappointment, featured only 4 of the CMT quasi cores, not 8. Excavator cut things in cache land even further. Both were cost-cutting parts, not performance improvements. Piledriver killed both of them simply by turning up the clocks high. The multi-thread performance of Steamroller and Excavator was not competitive because of the lack of cache, lack of cores, and lack of clock. Single-thread was a bit improved but, again, the only thing one could really do was blast current through Piledriver. It was a disgusting situation due to the single-threaded performance, which was unacceptable in 2012 and an abomination for the later years AMD kept peddling Piledriver in.
The only credit AMD deserves for the construction core period is not going out of business, despite trying so hard to do that.
GeoffreyA - Sunday, March 28, 2021 - link
Oxford Guy, while I respect your view, I do not agree with it, and still stand by my statement that AMD deserves credit for improving Bulldozer and executing yearly. Agreed, my 20-30% claim was not sober but I just meant it as a recollection and did qualify my statement.I don't think it's fair to put AMD down for embarking on Bulldozer. When they set out, quite likely they thought it was going to go further than the aging Phenom/K10 design, and the fact is, while falling behind in IPC compared with K10, it improved on a lot of points and laid the foundation. Its chief weakness was the idea of sharing resources, like the fetch, decode, and FP units, as well as going for a deeper pipeline. (The difference from Netburst is that Bulldozer was decently wide.)
Piledriver refined the foundation, raising IPC and adding a perceptron branch predictor, still used in Zen by the way, and I believe finally surpassed K10's IPC (and that of Llano). While being made on the same 32 nm process, it dropped power by switching to hard-edge flip flops, which took some work to put in. They used that lowered power to raise clock speeds, bringing power to the same level as Bulldozer. And Trinity, the Piledriver APU, surpassed Llano. I need to learn more about Steamroller and Excavator before I comment, but note in passing that SR improved the architecture again, giving each integer core its own fetch/decode units, among other things; and Excavator switched to GPU libraries in laying out the circuitry, dropping power and area, the tradeoff being lower frequency.
GeoffreyA - Sunday, March 28, 2021 - link
Also, the reviews show that things were not as bad as we remember, though power was terrible.https://www.anandtech.com/show/6396/the-vishera-re...
https://www.anandtech.com/show/5831/amd-trinity-re...
Oxford Guy - Tuesday, April 6, 2021 - link
I don't need to look at reviews agaih. I know how bad the IPC was in Bulldozer, Piledriver, Steamroller, and Excavator. Single-thread in Cinebench R15, for instance, was really low even at 5.2 GHz in Piledriver. It takes chilled water to get it to bench at that clock.GeoffreyA - Wednesday, March 10, 2021 - link
Lack of competition, high prices, lack of integrity. I agree it's one big mess, but there's so little we can do, except boycotting their products. As it stands, the best advice is likely: find a product at a decent price, buy it, be happy, and let these rotten companies do what they want.Oxford Guy - Sunday, March 28, 2021 - link
'find a product at a decent price, buy it, be happy'Buy a product you can't buy so you can prop up monopolies that cause the problem of shortage + bad pricing + low choice (features to choose from/i.e. innovation, limited).
GeoffreyA - Sunday, March 28, 2021 - link
The only solution is a worldwide boycott of their products, till they drop their prices, etc.