AMD 3rd Gen EPYC Milan Review: A Peak vs Per Core Performance Balance
by Dr. Ian Cutress & Andrei Frumusanu on March 15, 2021 11:00 AM ESTDisclaimer June 25th: The benchmark figures in this review have been superseded by our second follow-up Milan review article, where we observe improved performance figures on a production platform compared to AMD’s reference system in this piece.
Power & Efficiency: IOD Power Overhead?
In the server CPU space, especially at higher core counts where the CPUs are limited in their performance by the TDP limits of the design, higher power efficiency infers higher performance. In the context of AMD’s newest Milan parts, before we continue on to the performance benchmarks, I wanted to cover in more detail a few odd aspects of the new parts which differ quite a bit to Rome when it comes to power consumption.
It’s to be noted that during AMD’s presentation and our briefing on Milan, the company hadn’t made a single mention of power or energy efficiency, which was already a bad sign of some things to come.
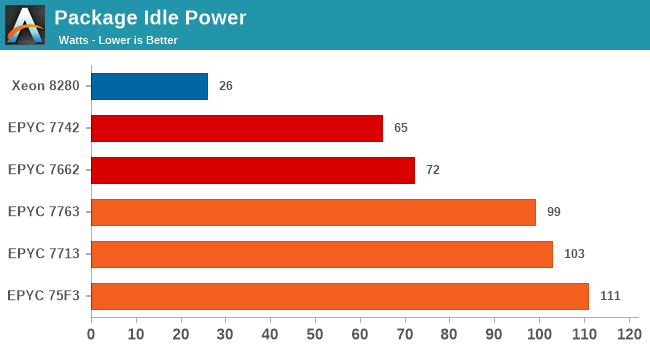
The first thing to appear as quite unusual on the new Milan parts was the idle power consumption of the various new SKUs. On the last generation Rome platform, I had measured package power of a single socket idling at around 65W. Compared to regular desktop CPUs this is quite a lot, however seemed relatively normal given the 8 memory controller channels, tons of I/O, as well as the fact that AMD uses an MCM/chiplet design which could possibly have a power overhead at low load. This figure was already higher than competing monolithic solutions from Intel or Ampere – I don’t have the exact figures at hand here and that’s why I didn’t include them in the chart but I remember seeing around 30-50W idle there.
Unfortunately, on Milan, this figure has seemingly risen to around 100W, reaching up to 111W in our test of the 75F3 system. This 30-40W increase in package power was a bit worrying as that shouldn’t normally be something you’d see in idle situations, where power management normally would kick in to reduce power consumption of the system.
I’ve proceeded to run all our SPEC workloads with power tracing of the system’s package and core power. We’re using AMD’s energy counters to achieve this, and are simply measuring in the start and end energy consumption, meaning there’s zero overhead and we have a precise figure in Joules based on how much the system has consumed during a workload (At least as precise as the numbers are reported). It’s to be noted that while the package power is evident in what it shows, simply the total energy of the socket package, the “core” power consumption metric is limited to just the individual CPU cores and their private L2 caches, without any of the shared L3 or other un-core components.
We’re comparing the power behaviour of four parts: For the Rome SKUs, we’re using an EPYC 7742 as well as an EPYC 7662. For the Milan parts, we’re using the 7663 and the 7713. It’s to be noted that because the EPYC 7663 is normally a 280W part, we’ve tuned down the power consumption via cTDP and PPT to 225W – this is not the way you’d normally operate the part but represents an interesting data-point when comparing things to the three other 225W CPUs.
I’d also like to mention that AMD had made note that the 7713 is meant to be positioned as a successor to the 7662, not the 7742, which is meant to be a higher-binned more power efficient part. However due to due 7713 coming in at almost the same price as the 7742 at launch, and due to the power behaviour of the two chips, I see these to chips as the better apples-to-apples generational comparison, although the argument we’re making also applies to the 7662 comparison.
| Rome vs Milan Power Efficiency | |||||||||||||
| SKU | EPYC 7742 (Rome) |
EPYC 7662 (Rome) |
EPYC 7663 (Milan) |
EPYC 7713 (Milan) |
|||||||||
| TDP Setting | 225W |
225W |
225W (cTDP down) |
225W |
|||||||||
| Perf |
PKG (W) |
Core (W) |
Perf | PKG (W) |
Core (W) |
Perf | PKG (W) |
Core (W) |
Perf | PKG (W) |
Core (W) |
||
| 500.perlbench_r | 268 | 220 | 141 | 238 | 192 | 107 | 253 | 220 | 112 | 239 | 221 | 104 | |
| 502.gcc_r | 239 | 208 | 105 | 228 | 189 | 83 | 246 | 220 | 92 | 240 | 219 | 83 | |
| 505.mcf_r | 141 | 203 | 95 | 139 | 187 | 77 | 153 | 220 | 85 | 153 | 218 | 75 | |
| 520.omnetpp_r | 134 | 207 | 109 | 131 | 189 | 87 | 139 | 220 | 92 | 136 | 217 | 82 | |
| 523.xalancbmk_r | 166 | 205 | 96 | 157 | 189 | 78 | 164 | 219 | 93 | 157 | 218 | 85 | |
| 525.x264_r | 567 | 220 | 147 | 512 | 194 | 114 | 505 | 220 | 113 | 475 | 221 | 105 | |
| 531.deepsjeng_r | 232 | 218 | 138 | 214 | 194 | 109 | 239 | 221 | 114 | 226 | 221 | 106 | |
| 541.leela_r | 264 | 210 | 144 | 243 | 192 | 117 | 250 | 220 | 119 | 240 | 220 | 110 | |
| 548.exchange2_r | 486 | 213 | 150 | 441 | 193 | 119 | 436 | 220 | 121 | 412 | 221 | 113 | |
| 557.xz_r | 184 | 208 | 120 | 174 | 190 | 96 | 178 | 221 | 103 | 171 | 220 | 93 | |
| SPECint2017 | 240 | 210 | 119 | 224 | 190 | 96 | 235 | 220 | 102 | 225 | 219 | 93 | |
| kJ Total | 1745 | 1681 | 1844 | 1904 | |||||||||
| Score / W | 1.143 | 1.176 | 1.066 | 1.028 | |||||||||
| 503.bwaves_r | 334 | 195 | 90 | 329 | 184 | 76 | 354 | 217 | 81 | 354 | 216 | 72 | |
| 507.cactuBSSN_r | 204 | 216 | 118 | 196 | 195 | 93 | 205 | 220 | 94 | 198 | 220 | 86 | |
| 508.namd_r | 261 | 221 | 154 | 233 | 193 | 116 | 229 | 219 | 115 | 217 | 219 | 107 | |
| 510.parest_r | 114 | 204 | 97 | 112 | 186 | 77 | 152 | 221 | 86 | 148 | 219 | 75 | |
| 511.povray_r | 353 | 223 | 160 | 299 | 188 | 114 | 308 | 220 | 119 | 286 | 220 | 111 | |
| 519.lbm_r | 35 | 186 | 84 | 35 | 184 | 77 | 39 | 210 | 76 | 39 | 215 | 72 | |
| 526.blender_r | 327 | 220 | 131 | 295 | 194 | 100 | 316 | 220 | 109 | 299 | 220 | 101 | |
| 527.cam4_r | 336 | 217 | 113 | 320 | 195 | 89 | 359 | 220 | 92 | 343 | 218 | 83 | |
| 538.imagick_r | 401 | 213 | 148 | 356 | 189 | 115 | 377 | 220 | 119 | 355 | 221 | 111 | |
| 544.nab_r | 241 | 218 | 150 | 217 | 193 | 116 | 217 | 220 | 116 | 204 | 221 | 108 | |
| 549.fotonik3d_r | 108 | 194 | 90 | 107 | 183 | 76 | 111 | 213 | 79 | 111 | 216 | 73 | |
| 554.roms_r | 82 | 202 | 94 | 81 | 184 | 74 | 88 | 220 | 83 | 88 | 217 | 73 | |
| SPECfp2017 | 191 | 200 | 101 | 180 | 186 | 83 | 193 | 217 | 88 | 187 | 217 | 80 | |
| kJ Total | 4561 | 4363 | 4644 | 4740 | |||||||||
| Score / W | 0.953 | 0.965 | 0.894 | 0.861 | |||||||||
In terms of absolute power consumption, all the parts generally land in the same 220W range figure, although we do see that in terms of actual measured power the Rome parts are a bit more conservative, especially the 7662. We’re running the CPUs in performance determinism mode – power determinism would always fill out the configured TDP but possibly would have little positive performance impact and certain power efficiency regressions.
What’s interesting to showcase and point out to between the four SKUs is the ratio between the power consumption of the total package and the actual cores which varies between the Rome and Milan generation parts.
Particularly what we’re interested in are workloads that are less memory-bound, and more core-local – in essence more typical compute heavy workloads such as 525.x264 or 511.porvray.
In such workloads, although we’re seeing that between the 7742, 7763, and 7713 (and to a lesser extent, the 7662), all SKUs are posting measured package power consumption figures that are pretty much identical. However, the core power consumption figures are very different, with the Rome 7742 part posting significantly higher figures than the new Milan chips, sometimes up to in the 40-50W range.
It’s exactly in these workloads where we actually see performance of the new Milan parts showcase a regression compared to the Rome parts. Anything that is less memory bound and requires the package power to be allocated towards just the CPU cores is notably favouring the Rome parts, allowing those chips to outperform the newer Milan parts.
The end-result is that although at equal TDP Milan has a theoretical IPC improvement, and does showcase benefits in workloads that are more heavily memory oriented, the actual geomean results of the new chips are actually just generationally flat – all whilst showcasing higher power and energy consumption, meaning that the new chips have perf/W regression of around 15%.
This regression seems to stem from an increase power overhead on the part of the new faster IOD of Milan (New L3 design could also be a factor). Effectively this increased power behaviour is reducing the effective usable power envelope of the actual cores, having a negative effect on performance, counteracting this generation’s IPC improvements at the worst case.
We had communicated our findings to AMD, but with no real resolution to the situation – so it does not seem to be a problem of misconfigured power management on the part of the test platform.

Indeed, charting the SPEC results across scaling thread counts in the system showcases that while at full load the differences between a 7713 and 7742 are almost nothing, at lower utilisations there’s actually a larger advantage in favour of the new Milan part, from 5% at 56 cores and growing larger the less cores are used. We’re seeing a huge >20% performance advantage at <8 threads, likely tied to the fact that at such low thread counts each core can take advantage of the full L3 in each chiplet/CCD.
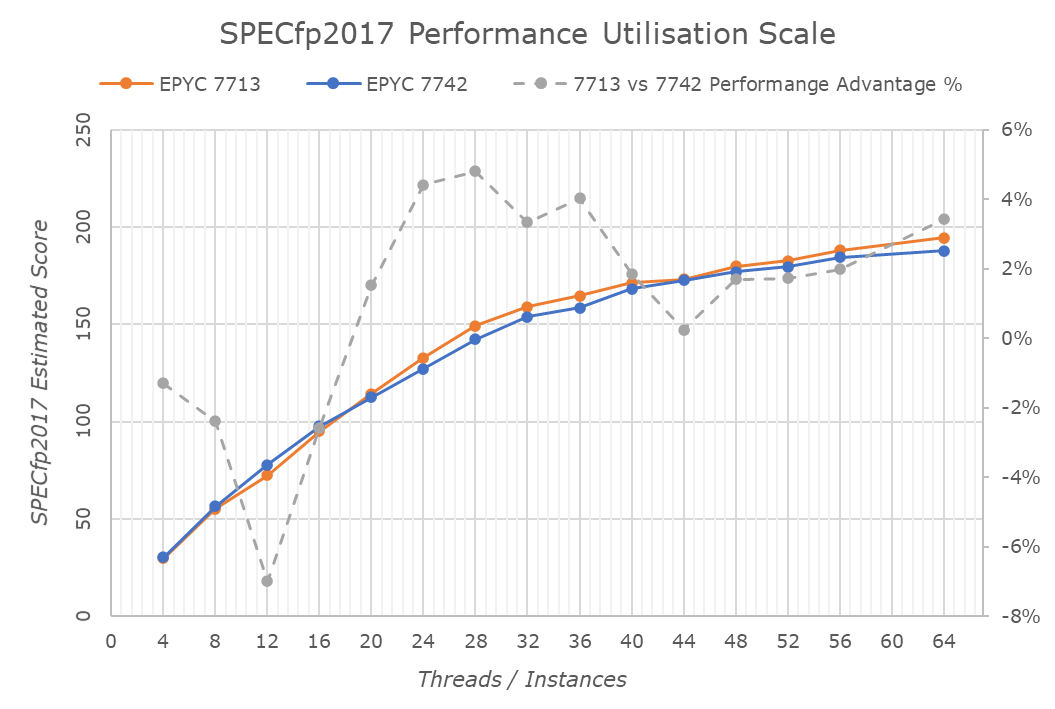
On SPECfp2017, oddly enough the advantages of the new Milan-based 7713 are less pronounced than in SPECint2017, even showcasing performance regressions at lower thread counts. I’m not too sure what the reason here is, but the new Zen3 CCX keeping its aggregate total L3 bandwidth equal whilst serving double the number of cores could have something to do with it, with performance at higher core counts recuperating and being improved due to the new lower-latency and higher clock IOD of Milan.
Whatever the technical background of this new odd power behaviour, it’s clear that it has negative consequences for the new Milan parts, possibly resulting in lower-than-expected generational performance improvements, as we’ll see in the next few pages.


120 Comments
View All Comments
mode_13h - Monday, March 15, 2021 - link
Please don't paint Nvidia as a victim. They are not. All of these guys will have to support each other, for the foreseeable future, and for purely pragmatic reasons.Oxford Guy - Monday, March 15, 2021 - link
They are not 'guys'. They're corporations. Corporations were invented to, to quote Ambrose Bierce, grant 'individual profit without individual responsibility'.mode_13h - Wednesday, March 17, 2021 - link
No disagreement, but I'm slightly disheartened you decided to take issue with my use of the term "guys". I'll try harder, next time--just for you.Oxford Guy - Tuesday, April 6, 2021 - link
People humanize corporations all the time. It doesn't lead to good outcomes for societies.Of course, it's questionable whether corporations lead to good outcomes, considering that they're founded on scamming people (profit being 'sell less for more', needing tricks to get people to agree to that).
chavv - Monday, March 15, 2021 - link
Is it possible to add another "benchmark" - ESX server workload?Like, running 8-16-32-64 VMs all with some workload...
Andrei Frumusanu - Monday, March 15, 2021 - link
As we're rebuilding our server test suite, I'll be looking into more diverse benchmarks to include. It's a long process that needs a lot of thought and possibly resources so it's not always evident to achieve.eva02langley - Monday, March 15, 2021 - link
Just buy EPYC and start your hybridation and your reliance on a SINGLE supplier...eva02langley - Monday, March 15, 2021 - link
edit: Just buy EPYC and start your hybridation and STOP your reliance on a SINGLE supplier...mode_13h - Monday, March 15, 2021 - link
You guys should really include some workloads involving multiple <= 16-core/32-thread VMs, that could highlight the performance advantages of NPS4 mode. Even if all you did was partition up the system into smaller VMs running multithreaded SPEC 2017 tests, at least that would be *something*.That said, please don't get rid of all system-wide multithreaded tests, because we definitely still want to see how well these systems scale (both single- and multi- CPU).
ishould - Monday, March 15, 2021 - link
Yes this seems more useful for my needs as well. We use a grid system for job submission and not all cores will be hammered at the same time