The Intel SSD 670p (2TB) Review: Improving QLC, But Crazy Pricing?!?
by Billy Tallis on March 1, 2021 12:00 PM ESTAdvanced Synthetic Tests
Our benchmark suite includes a variety of tests that are less about replicating any real-world IO patterns, and more about exposing the inner workings of a drive with narrowly-focused tests. Many of these tests will show exaggerated differences between drives, and for the most part that should not be taken as a sign that one drive will be drastically faster for real-world usage. These tests are about satisfying curiosity, and are not good measures of overall drive performance. For more details, please see the overview of our 2021 Consumer SSD Benchmark Suite.
Whole-Drive Fill
 |
|||||||||
| Pass 1 | |||||||||
| Pass 2 | |||||||||
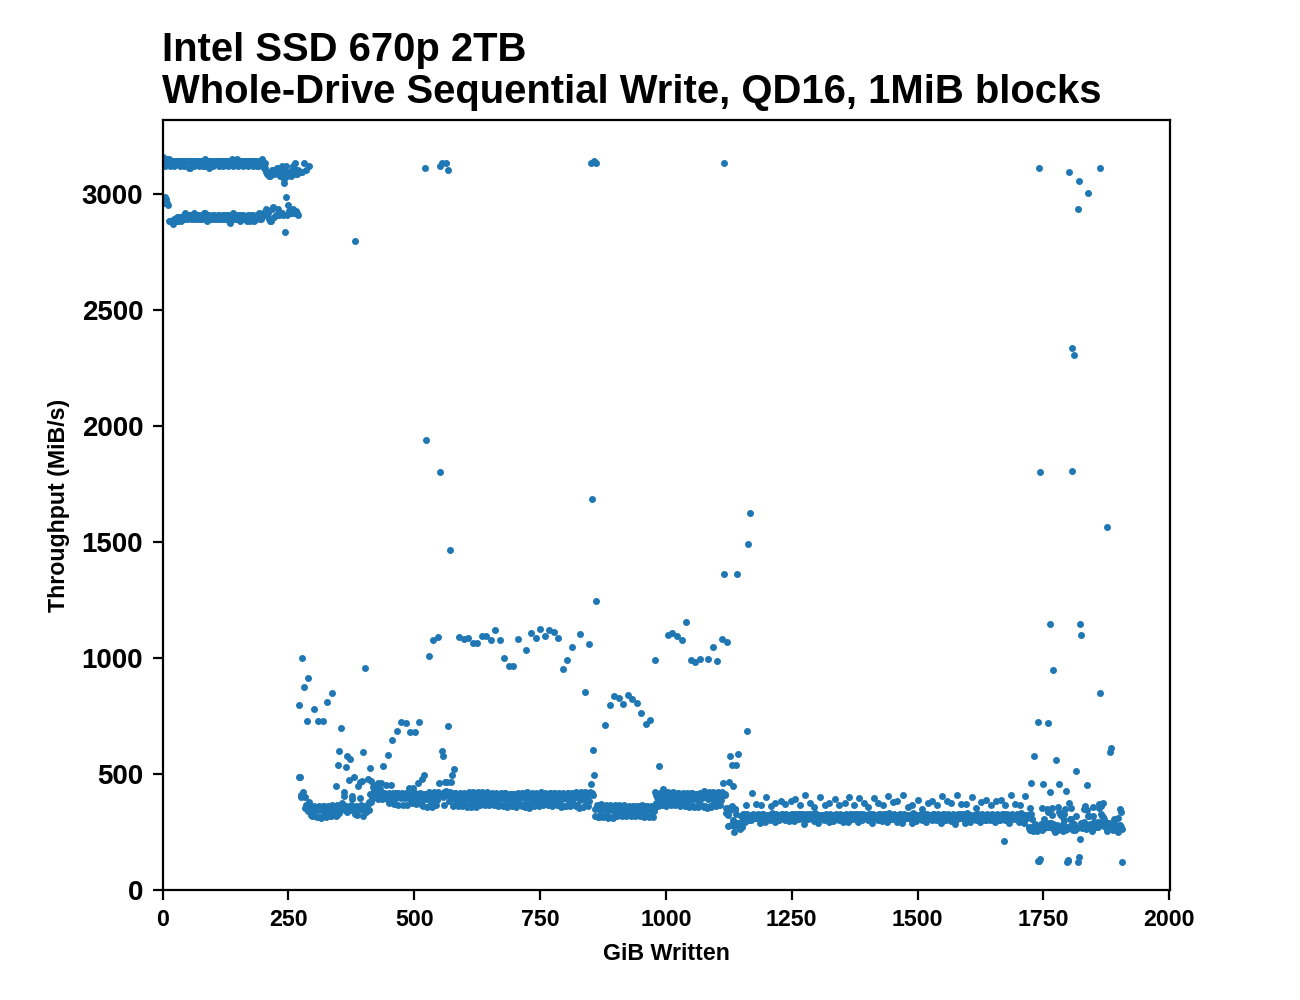
The Intel SSD 670p shows less consistent performance than the 660p during the sequential drive write. Writing to the SLC cache bounces between two performance levels, just above and just below 3 GB/s. The cache runs out more or less on schedule and performance drops down into SATA territory with sporadic outliers that are faster than normal. There's a bit of a stepped downward trend in performance as the drive approaches full. On the second pass that overwrites data on a full drive, the 670p is even more inconsistent with short bursts up to SLC write speed throughout the process.
 |
|||||||||
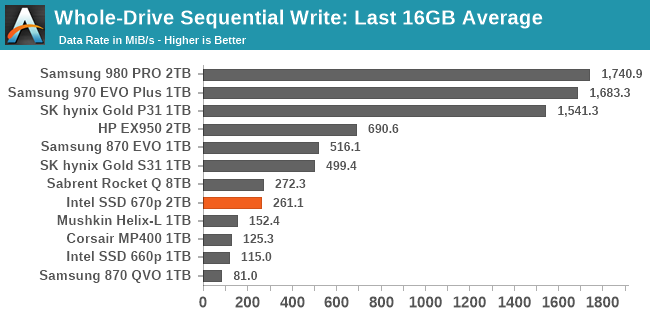
| Average Throughput for last 16 GB | Overall Average Throughput | ||||||||
The overall average write speed of the 670p is now almost enough to saturate a SATA interface. At the tail end of the filling process it does dip down to hard drive speeds, but any large sequential transfer of data onto the 670p will definitely complete more quickly than any one hard drive can handle. The controller upgrade helps some here (primarily with the SLC cache write speed), but for the most part the NAND itself is still the bottleneck, which means the smaller capacities of the 670p will not perform as well.
Working Set Size
 |
|||||||||
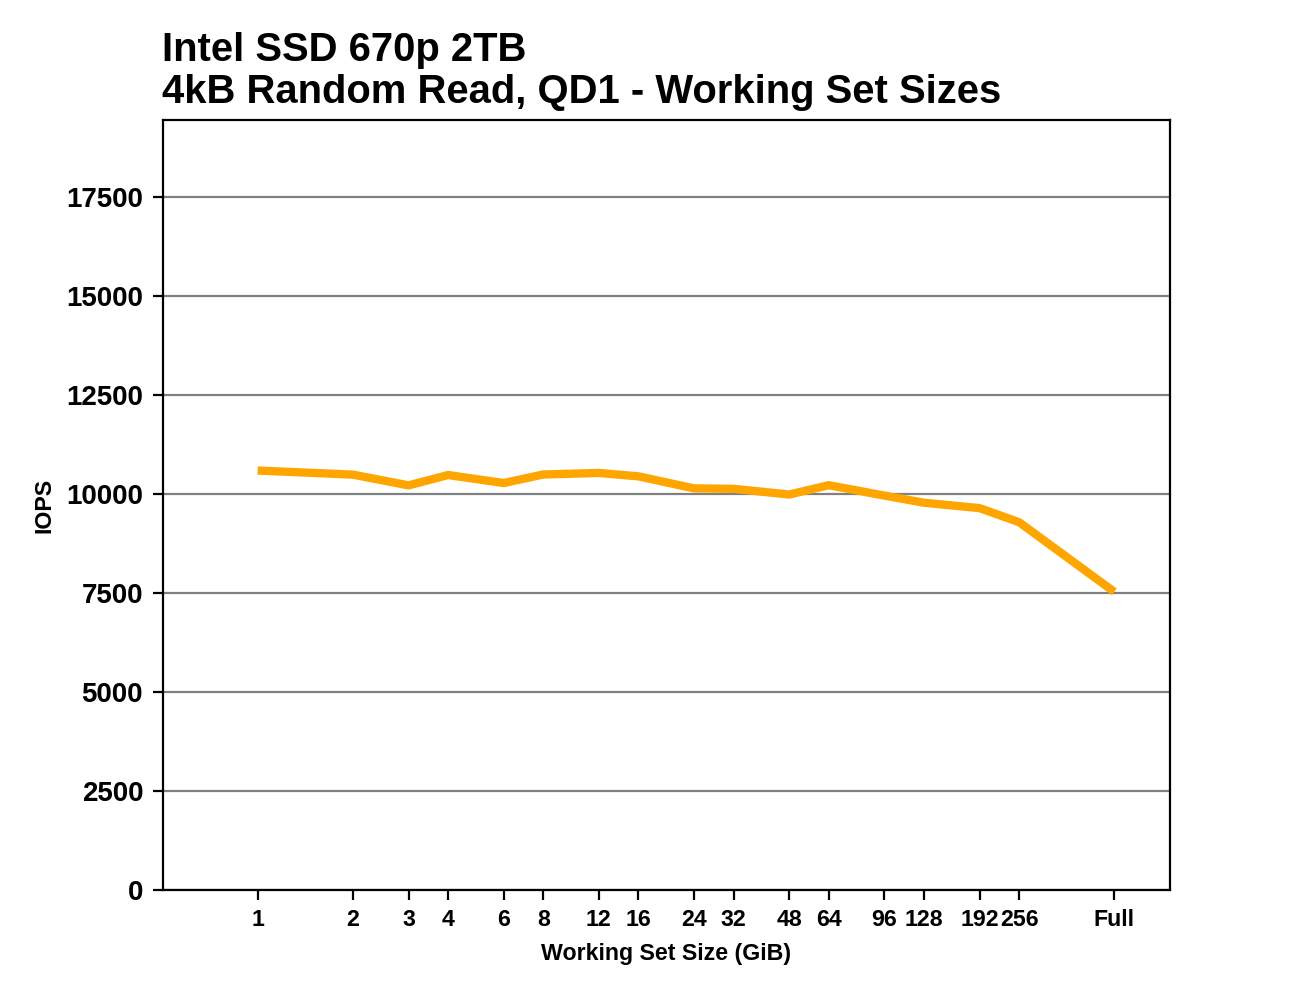
Intel is still clearly using a reduced DRAM design with the 670p rather than the full 1GB per 1TB ratio that mainstream SSDs use. The drop in performance at large working set sizes closely mirrors what we saw with the 660p, albeit with higher performance across the board thanks to the lower latency of the 144L NAND.
Performance vs Block Size
 |
|||||||||
| Random Read | |||||||||
| Random Write | |||||||||
| Sequential Read | |||||||||
| Sequential Write | |||||||||
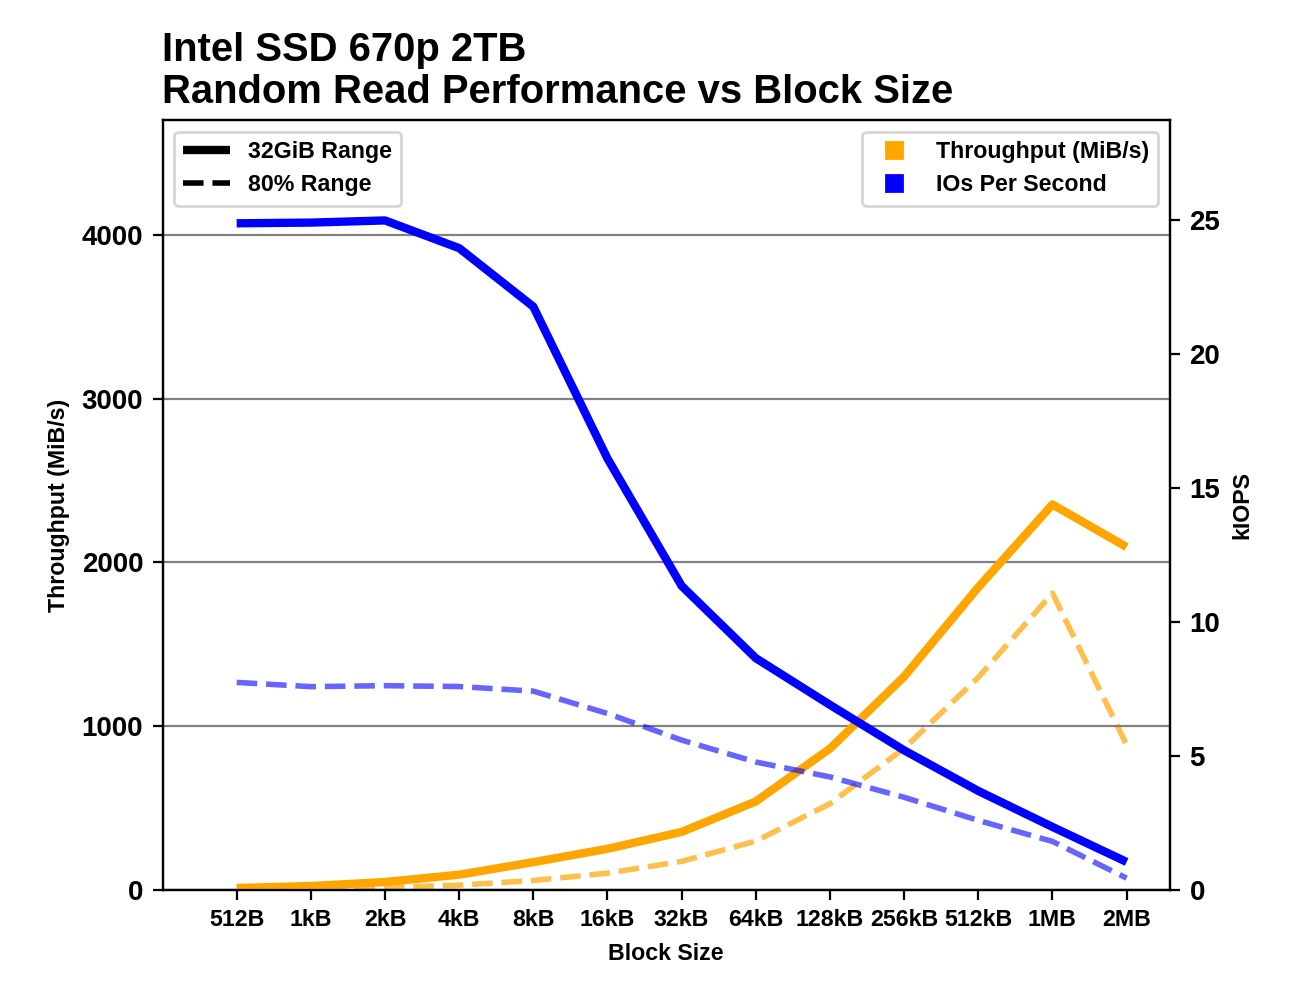
With the 670p, Intel has eliminated the IOPS penalty that random reads smaller than 4kB suffer on the 660p, but that effect is still present for random writes. The IOPS difference between the short-range tests that hit the SLC cache and the 80% full drive tests is bigger for the 670p than the 660p; the newer drive has generally improved performance, but is in some ways even more reliant on the SLC cache.
Sequential throughput on the 670p keeps increasing with larger block sizes, long past the point where the 660p saturated its controller's limits. The performance trends for both sequential reads and writes are well-behaved with little disparity between the short-range tests and the 80% full drive tests, and no indication of the SLC cache running out during the sequential write tests.


72 Comments
View All Comments
abufrejoval - Monday, March 1, 2021 - link
This is the kind of article, that keeps AT at the top of my daily reading list.While it's technically very neutral and to the point the last paragraph almost sound a bit like good old Charly Demerjan from Semiaccurate, who barely seems to peekt out behind his self-inflicted pay wall any more.
Nice job and I know why my last Intel SSD was a Postville, still running btw.
Hifihedgehog - Monday, March 1, 2021 - link
The interwebs gifted us the nickname of Faillake to describe Skylake, but have they come up yet with a clever name to adequately describe this pricing disaster? QLC-quandry? QLC-quagmire? I honestly don't know who would buy these except for the engineering team and the most ardent fanboys. By the way, the fanboys are very ticked off today by Billy Talis' extremely honest assessment and are downvoting other people as well who are calling the pricing "horrendous."Great_Scott - Tuesday, March 2, 2021 - link
Looks like AT is alone in talking about the pricing. I typically like HH, but they are way off base on that aspect of their review. That was a bummer to discover.A5 - Monday, March 1, 2021 - link
The conclusion here is bang-on. This is a pretty good QLC drive at a terrible price. It needs to be 10 or 11 cents/GB to be a winner.Glock24 - Monday, March 1, 2021 - link
That's more expensive than some good TLC drives 🤷🏻♂️powerarmour - Monday, March 1, 2021 - link
I refuse out of principle to ever purchase a QLC drive.Small Bison - Monday, March 1, 2021 - link
And for this particular drive, it doesn't take much principle to buy a better-performing TLC SSD for less money.Reflex - Monday, March 1, 2021 - link
I remember when everyone said this about TLC, yet here we are...JimmyZeng - Tuesday, March 2, 2021 - link
But for TLC this phase is much shorter, QLC is around for quite a few years, yet it failed to catch on, yeah 670 is crazily priced, but even with 660/665, they never showed any pricing advantage comparing to TLC competitors, I suppose the (rough) theoretical upper limit of 33%(4bpc/3bpc) capacity/price ratio improvement of QLC over TLC is at play here.utferris - Tuesday, March 2, 2021 - link
Learn some math before posting something.QLC (4 bit) is double the size of TLC (3 bit), not 4/3.
So theoretically, the same QLC flash can double the capacity than it is used as TLC. Although in reality, the cost of QLC can not go down to half of TLC, but it should be able to get close in the long run.