The Samsung 870 EVO (1TB & 4TB) Review: Does the World Need Premium SATA SSDs?
by Billy Tallis on February 17, 2021 8:00 AM ESTAnandTech Storage Bench - The Destroyer
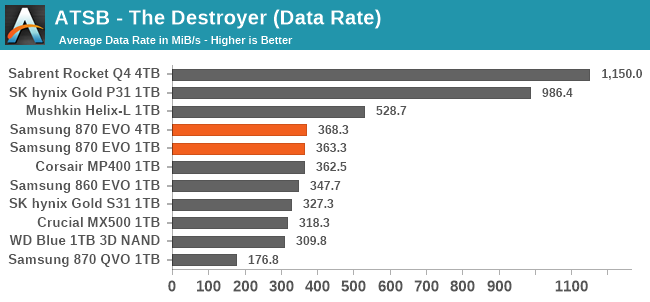
Our AnandTech Storage Bench tests are traces (recordings) of real-world IO patterns that are replayed onto the drives under test. The Destroyer is the longest and most difficult phase of our consumer SSD test suite. For more details, please see the overview of our 2021 Consumer SSD Benchmark Suite.
 |
|||||||||
| Average Data Rate | |||||||||
| Average Latency | Average Read Latency | Average Write Latency | |||||||
| 99th Percentile Latency | 99th Percentile Read Latency | 99th Percentile Write Latency | |||||||
| Energy Usage | |||||||||
For SATA drives, the Samsung 870 EVOs turn in class-leading scores on almost all of the performance metrics. But these improvements are all marginal at best; the SATA interface bottleneck almost completely levels the playing field. The small improvements to read latency brought by the 870 EVO pale in comparison to what is achieved by even entry-level NVMe SSDs.
In stark contrast to the performance numbers, the 870 EVOs turn out to be the most power-hungry TLC drives in this bunch: they sacrifice some of the efficiency improvements the 860 EVO provided, even though drives like the SK hynix Gold S31 have been able to deliver significant improvement on this.
AnandTech Storage Bench - Heavy
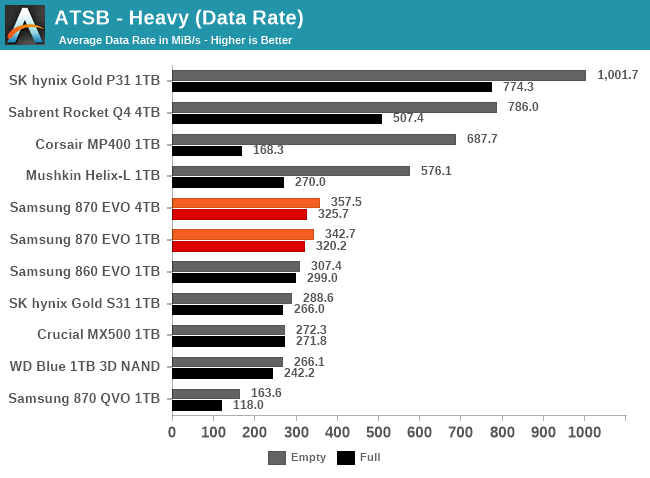
The ATSB Heavy test is much shorter overall than The Destroyer, but is still fairly write-intensive. We run this test twice: first on a mostly-empty drive, and again on a completely full drive to show the worst-case performance.
 |
|||||||||
| Average Data Rate | |||||||||
| Average Latency | Average Read Latency | Average Write Latency | |||||||
| 99th Percentile Latency | 99th Percentile Read Latency | 99th Percentile Write Latency | |||||||
| Energy Usage | |||||||||
The scores for the Heavy test paint much the same picture as for The Destroyer. The full-drive test runs additionally show that the worst-case performance of the mainstream SATA SSDs is still superior to many entry-level NVMe SSDs, even though the NVMe SSDs significantly outperform SATA for any more normal workload.
AnandTech Storage Bench - Light
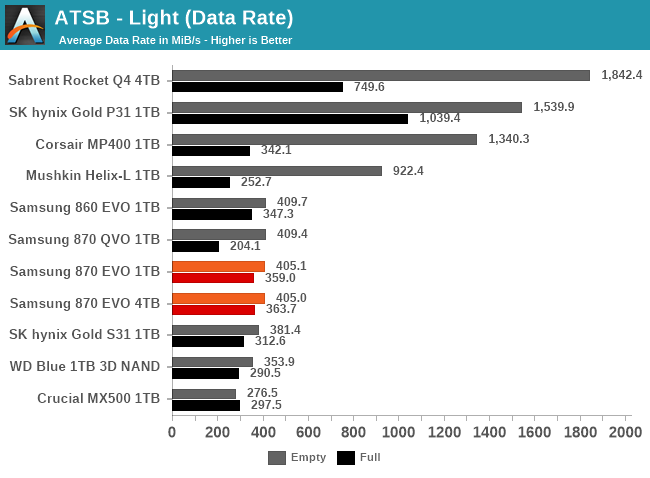
The ATSB Light test represents ordinary everyday usage that doesn't put much strain on a SSD. Low queue depths, short bursts of IO and a short overall test duration mean this should be easy for any SSD. But running it a second time on a full drive shows how even storage-light workloads can be affected by SSD performance degradation.
 |
|||||||||
| Average Data Rate | |||||||||
| Average Latency | Average Read Latency | Average Write Latency | |||||||
| 99th Percentile Latency | 99th Percentile Read Latency | 99th Percentile Write Latency | |||||||
| Energy Usage | |||||||||
On the Light test, the measurable but imperceptible performance advantages of the 870 EVOs over other SATA drives have basically disappeared. The read latency scores on the full-drive test runs may be a tiny bit better than the 860 EVO, but the only scores that have clearly shifted with this new generation are the energy consumption figures that have creeped up.
PCMark 10 Storage Benchmarks
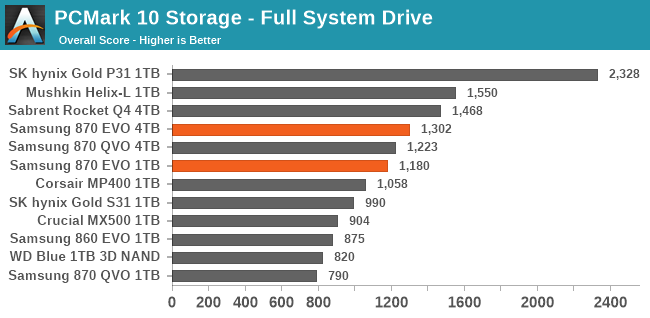
The PCMark 10 Storage benchmarks are IO trace based tests similar to our own ATSB tests. For more details, please see the overview of our 2021 Consumer SSD Benchmark Suite.
 |
|||||||||
| Full System Drive | Overall Score | Average Bandwidth | Average Latency | ||||||
| Quick System Drive | Overall Score | Average Bandwidth | Average Latency | ||||||
| Data Drive | Overall Score | Average Bandwidth | Average Latency | ||||||
The Full System Drive test from the PCMark 10 Storage suite shows a much wider spread of performance scores among SATA drives than our ATSB traces, but also a much smaller advantage for the NVMe drives. Judging by this test, the 870 EVO offers a small but real improvement to performance compared to earlier SATA drives. The 4TB 870 QVO also scores quite well since it benefits from the same controller and has enough SLC cache to almost match the performance of the 4TB 870 EVO.
The subset of tests included in the Quick System Drive and Data Drive benchmarks show a more level playing field among SATA SSDs, and a greater advantage for NVMe drives. Since we run these tests before the Full System Drive test, each drive is closer to its fresh out-of-the-box state, which helps these tests get closer to showing the theoretical peak performance of a drive.


136 Comments
View All Comments
PixyMisa - Wednesday, February 17, 2021 - link
Time to start replacing SATA with USB-C.eek2121 - Wednesday, February 17, 2021 - link
In the past I have advocated for internal USB-C because it would be a perfect replacement for SATA.futrtrubl - Wednesday, February 17, 2021 - link
Way back when there was even an HDD that was natively usb, the Samsung Spinpoint N3UJorgp2 - Wednesday, February 17, 2021 - link
Lol.It's slower than SATA
Krimzon - Wednesday, February 17, 2021 - link
How is 40gbps slower than 6?futrtrubl - Wednesday, February 17, 2021 - link
Hell, USB 3.1 (SuperSpeed+/3.2 gen2x1/3.2 gen1x2) is faster than SATABeaver M. - Wednesday, February 17, 2021 - link
I think USB latency is much higher. Not sure, though.Glaurung - Wednesday, February 17, 2021 - link
IIRC, USB is one channel one way at a time, which makes it less responsive than SATA (which is bidirectional), even though USB has higher bandwidth on paper.quorm - Wednesday, February 17, 2021 - link
Yeah, usb is no good with small files.Spunjji - Friday, February 19, 2021 - link
UASP put paid to that old downside.