The Snapdragon 888 vs The Exynos 2100: Cortex-X1 & 5nm - Who Does It Better?
by Andrei Frumusanu on February 8, 2021 3:00 AM EST- Posted in
- Mobile
- Samsung
- Qualcomm
- Smartphones
- SoCs
- Snapdragon 888
- Exynos 2100
Mixed-Usage Power & Preliminary Battery Life
We haven’t had both Galaxy S21 Ultra devices long enough to do our more extensive battery life testing routines, however I did run some more power analysis on the more compute-heavy PCMark suite as well as some battery life numbers at 120Hz.
I’ll start off with some power profiling – these figures are generally within 5% margin of error accurate in terms of power usage at the battery level but are measured as input power into device as this allows us much higher resolution data sampling, without actually dismantling the phones.
I put the devices to minimum brightness to minimise screen power attribution in the power figures, with the devices set to 120Hz mode and a lamp shining on them to enable the 120Hz VRR/LFD power savings on the display. Both devices are in their default performance modes.
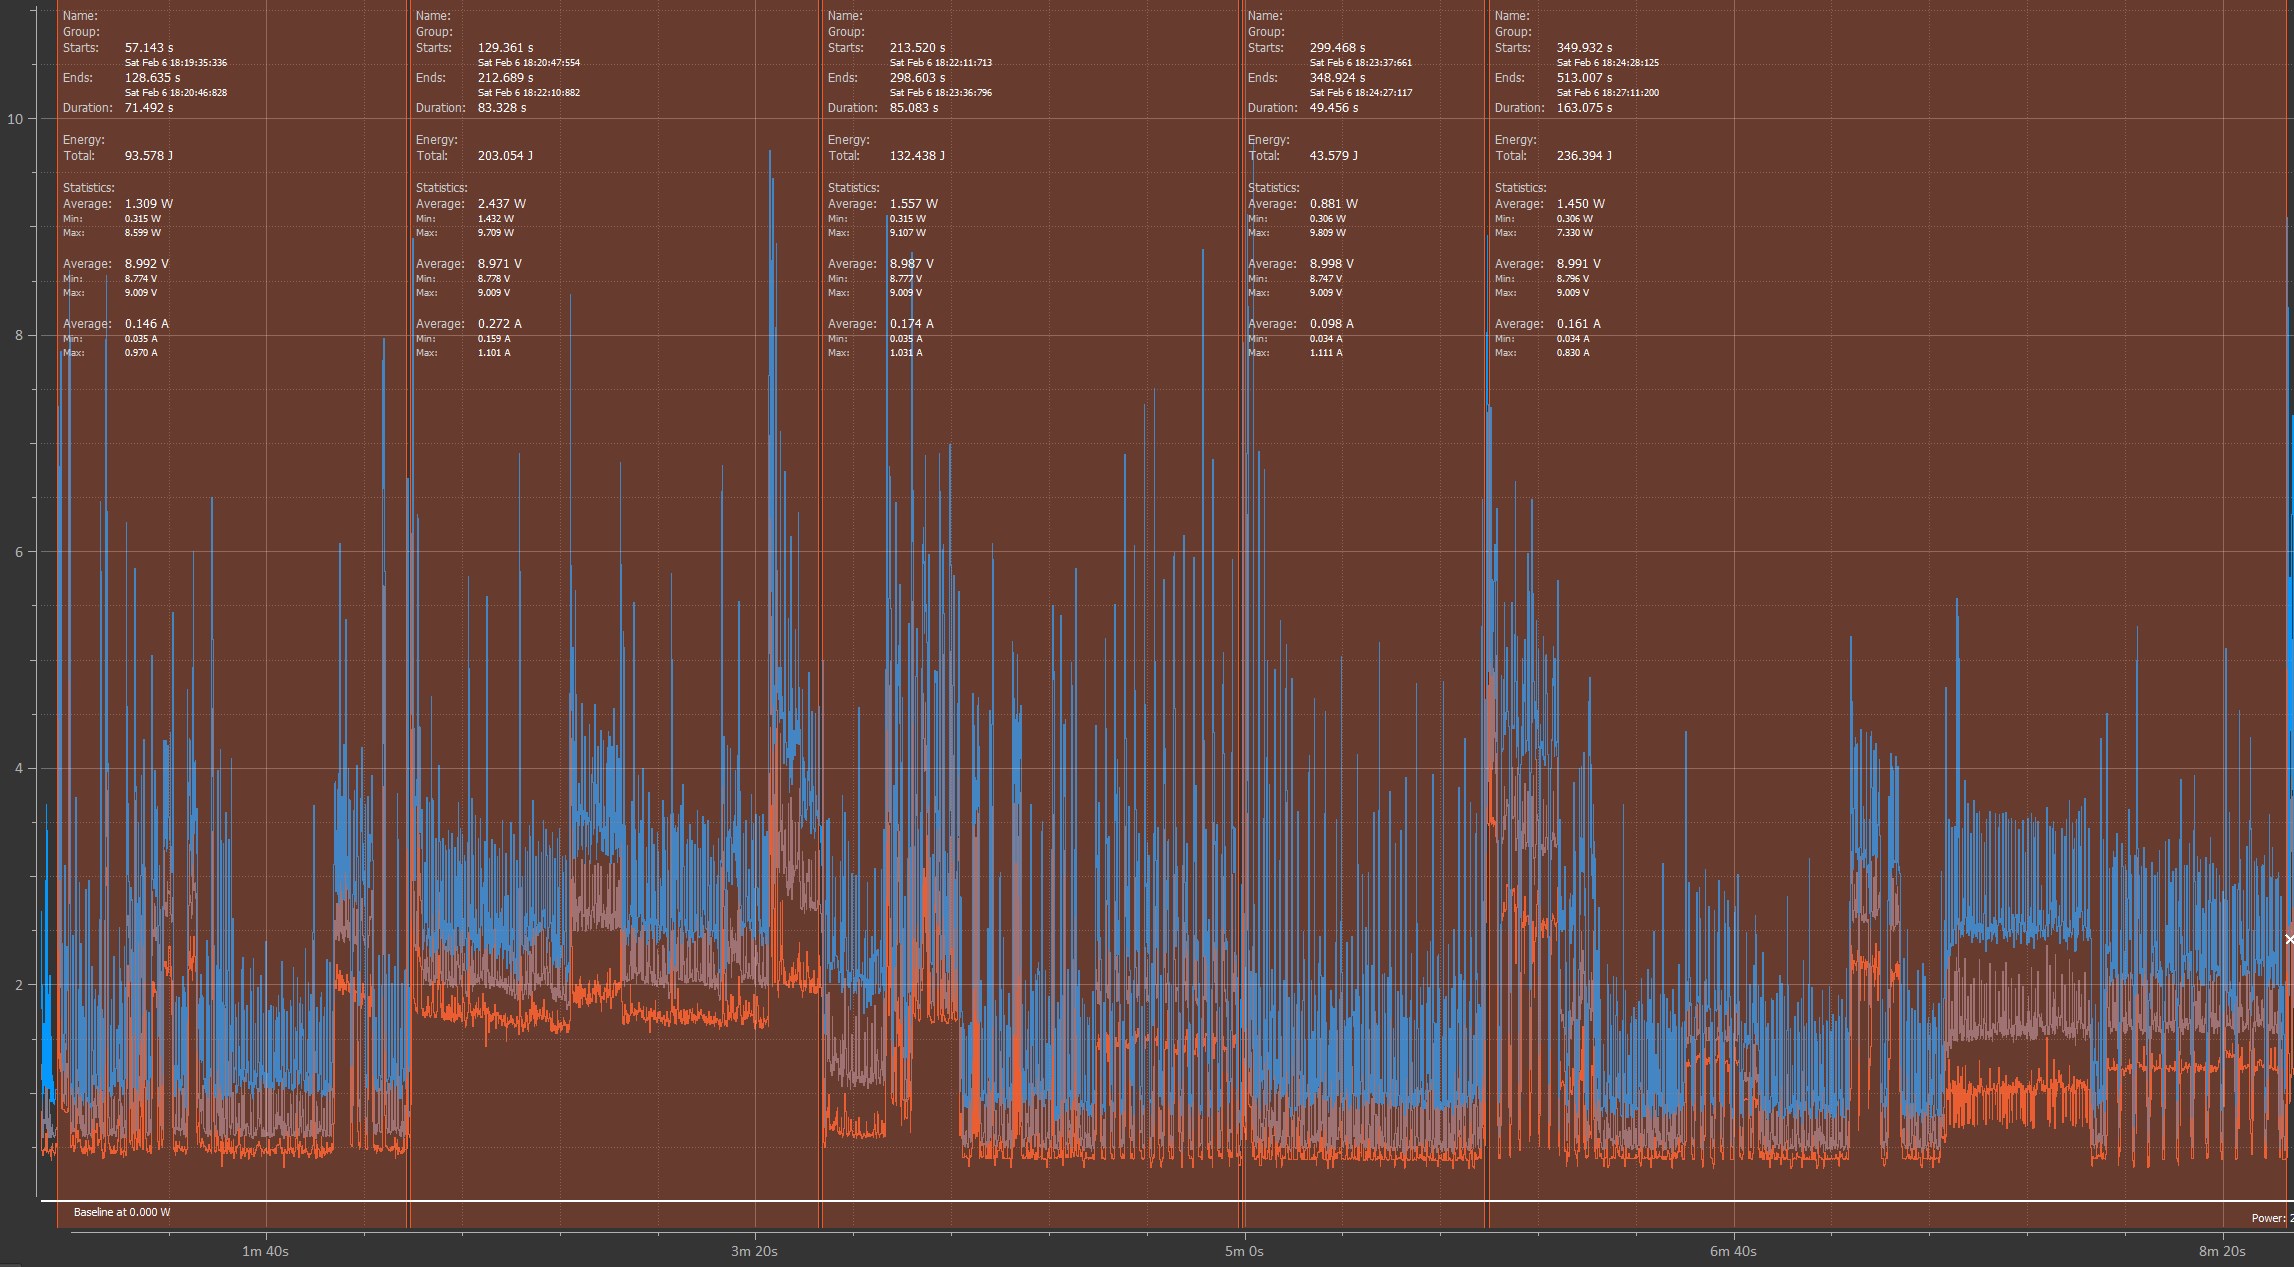
Galaxy S21 Ultra - Snapdragon 888
The Snapdragon 888’s power chart looks relatively straightforward here, with the different sections corresponding to the different sub-tests in PCMark. We see a varied amount of activity with clear activity spikes and corresponding power spikes when the SoC had to do computations.
Instantaneous peak power is around the 9W mark, which should be mostly due to the Cortex-X1 cores of the chip running alongside the Cortex-A78 cores.
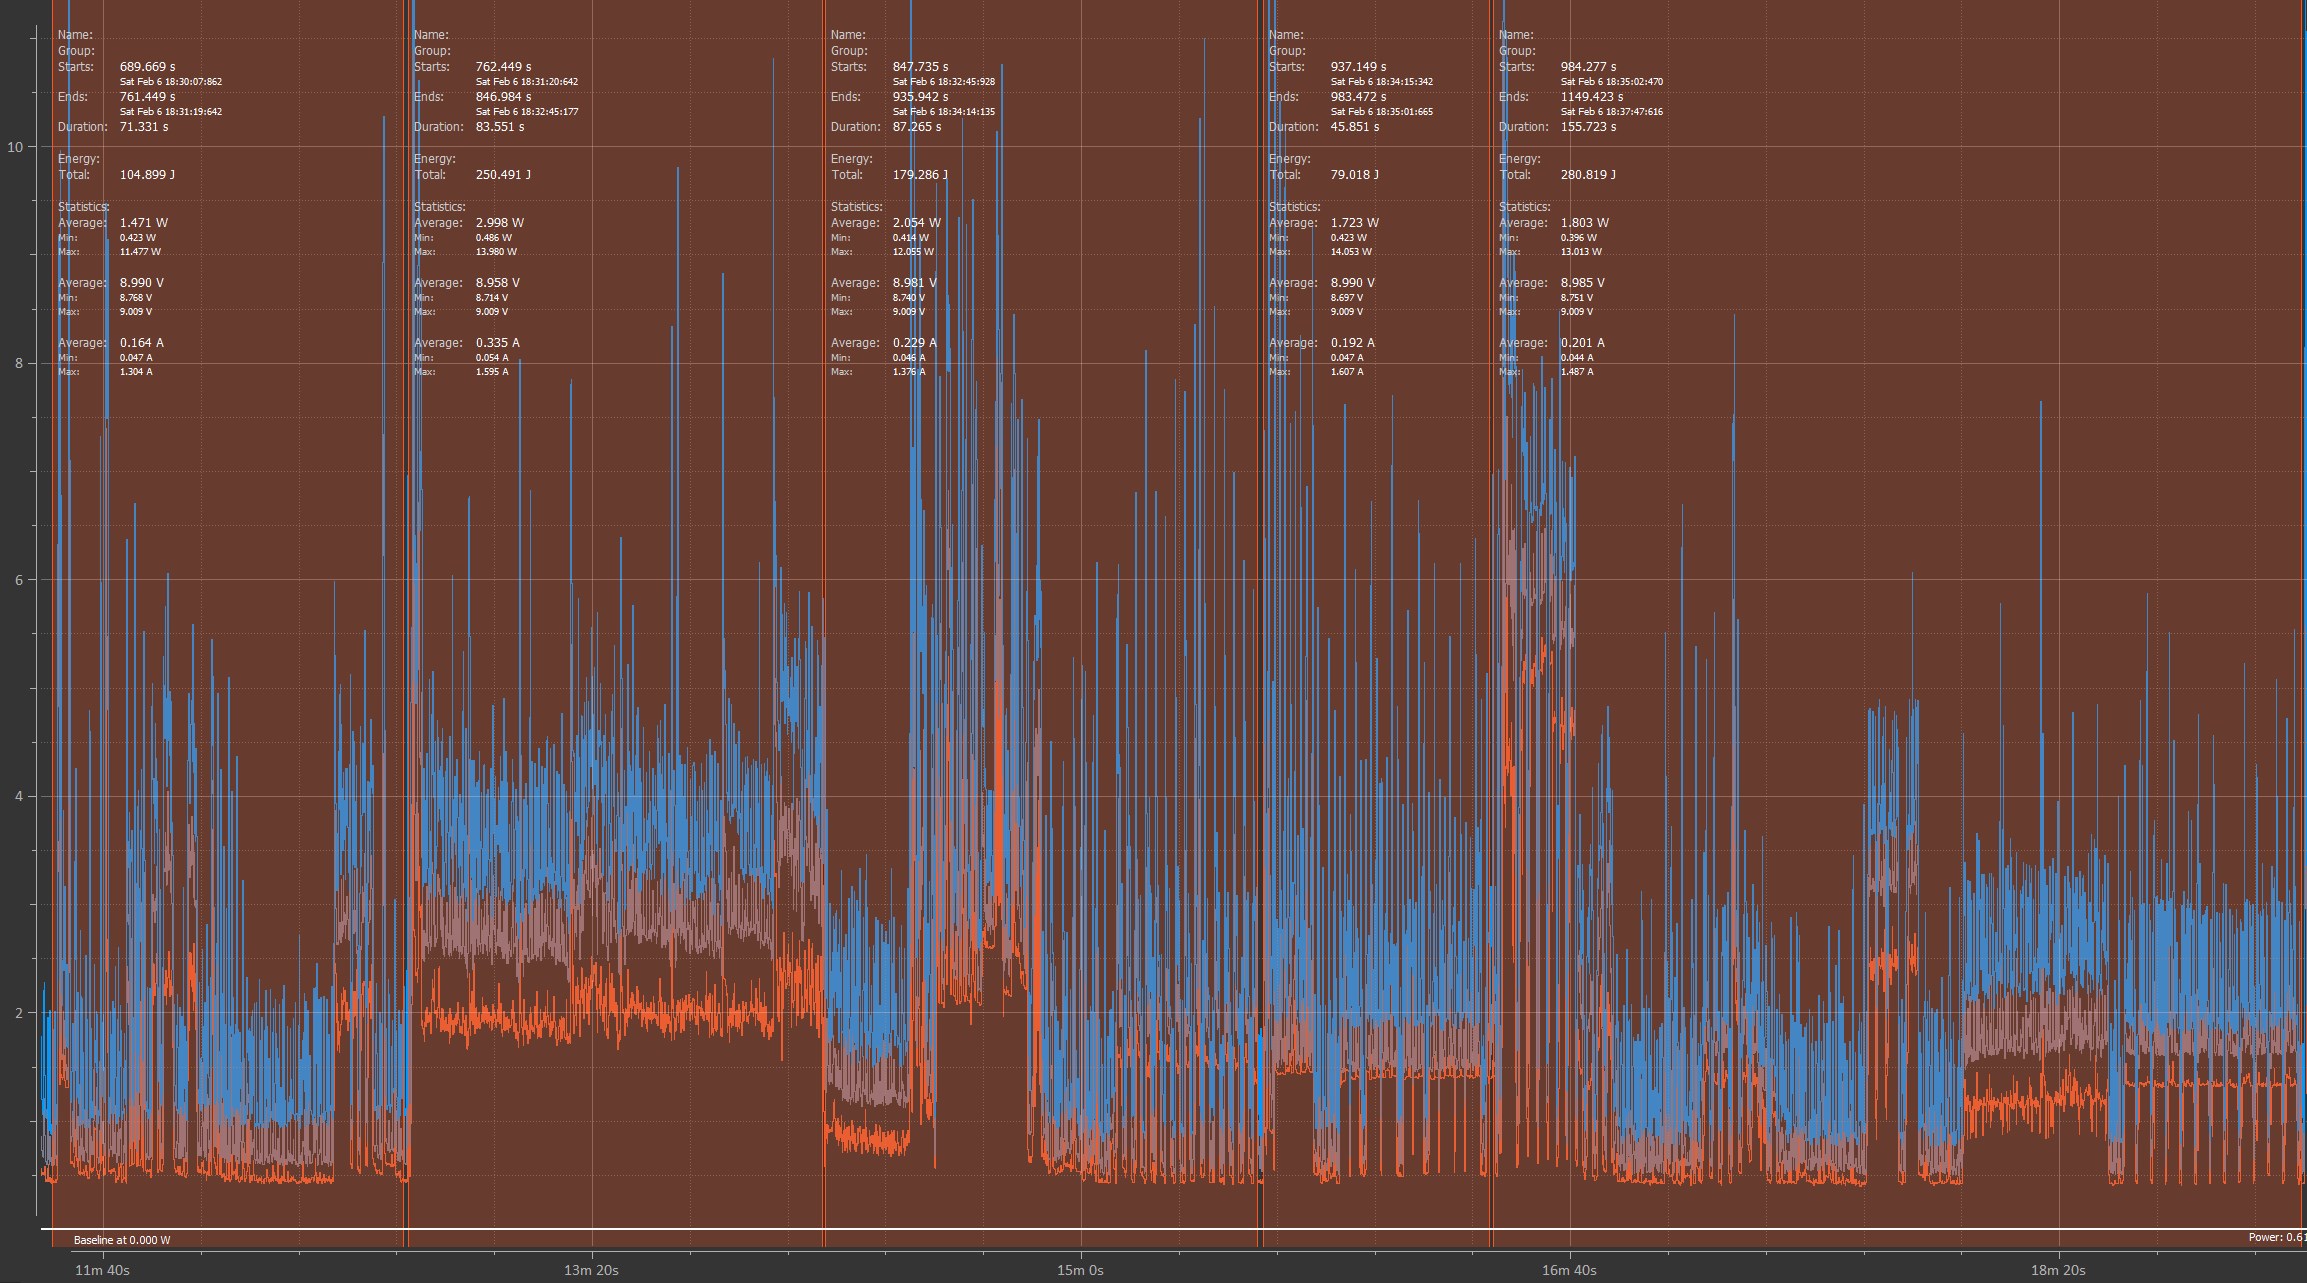
Galaxy S21 Ultra - Exynos 2100
The Exynos chart looks generally similar, which is no surprise given that it’s the same workload. What’s more interesting about the Exynos though is that it has much larger power spikes, up to 14W, which is notably more than the Snapdragon. The Cortex-A78 cores on the Exynos run much higher frequency and power than on the Snapdragon, and together with the higher power draw of the X1 cores, it makes sense that the Exynos’ instantaneous power is considerably higher when all the cores are under load.
The photo editing section of the test is very intriguing as the power profile is very different to that of the Snapdragon. This RenderScript section should be accelerated by the GPU, and here we see the Exynos’ baseline power goes up significantly compared to the Snapdragon for the majority of the test. This is almost 1W in magnitude – I really wonder what’s happening here under the hood and where that power comes from – maybe the GPU doesn’t have as fine-grained power gating or DVFS?
| Galaxy S21 Ultra Power Usage in PCMark Minimum Brightness, 120Hz, Default Performance Mode |
|||
| Snapdragon 888 Score - Power Usage |
Exynos 2100 Score - Power Usage |
% Difference Exynos vs Snapdragon |
|
| Idle Score Screen | 759mW | 797mW | +4.8% |
| Web-browsing | 12935 - 1309mW |
13159 - 1471mW |
+1.1% - +11.0% |
| Video Editing | 7866 - 2437mW |
6576 - 2998mW |
-16.4% - +18.7% |
| Writing 2.0 | 12966 - 1556mW |
15370 - 2054mW |
+18.5% - +24.2% |
| Photo Editing | 26884 - 881mW |
32385 - 1723mW |
+20.4% - +48.9% |
| Data Manipulation | 9918 - 1450mW |
8930 - 1803mW |
-10% - +19.6% |
Tabulating the PCMark test scores with the respective power figures across both Galaxy S21 Ultras, we see a few trends.
Performance wise, surprisingly enough, the Exynos has a few sub-tests where it outperforms the Snapdragon, notably in the Web-browsing, Writing and Photo editing tests. The Writing subtest particularly shows a +18% advantage in favour of the Exynos, while it loses more notably in the more single-threaded bound Data Manipulation test.
What’s also notable is that the Exynos’ power consumption is quite higher, across the board on all tests. The Photo Editing test aside where it has a 49% power disadvantage (which is actually high if we were to account for baseline device power), the rest of the test should be apples-to-apples CPU comparisons. We’re seeing roughly +15-20% device power disadvantages, and when account for baseline, this actually grows to around 18-35%. The Exynos does showcase a performance advantage in some of the tests, but not enough to make up for the increased power, meaning perf/W is lower.
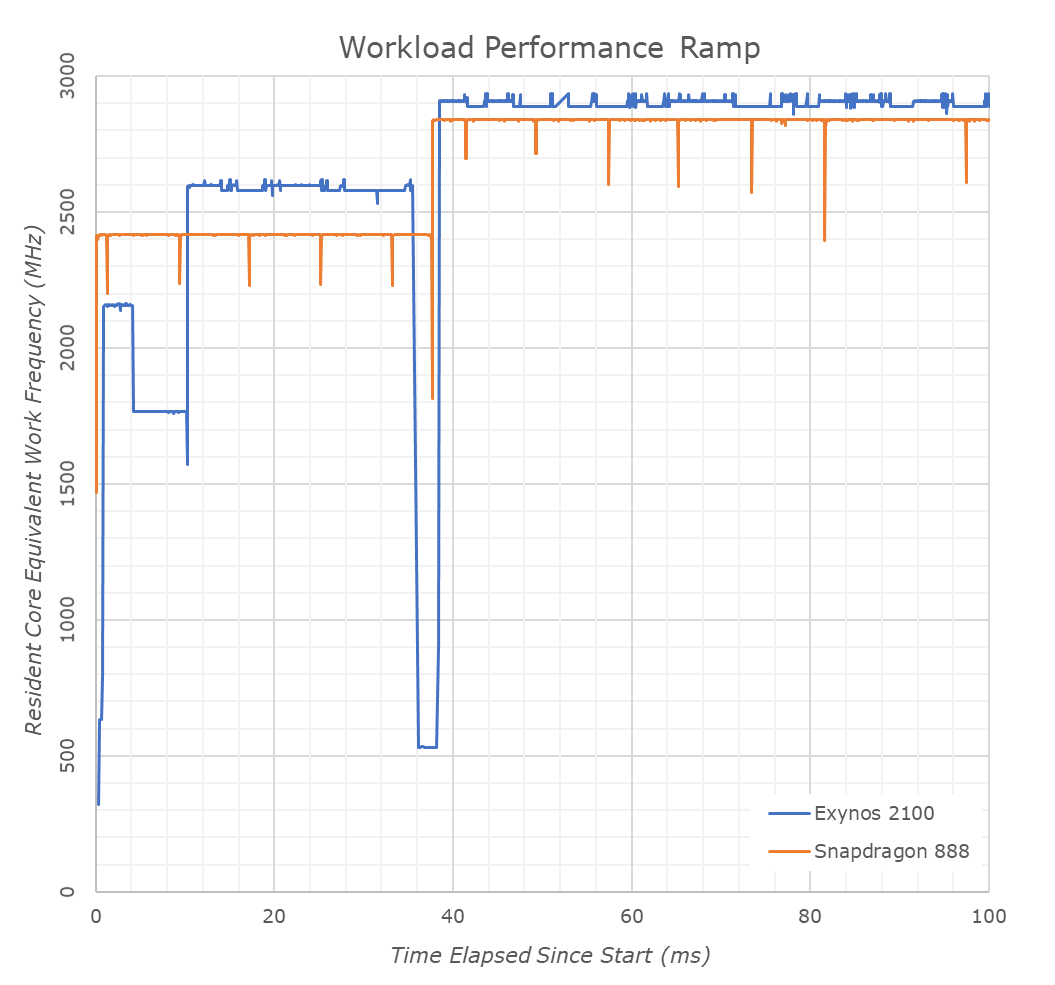
Looking at the DVFS of the two chips, we see that they’re generally reaching peak performance at roughly the same time in around 37-38ms. The Snapdragon 888 will schedule a workload directly on the A78 cores at 2.41GHz during that time before ramping up to the X1 cores at 2.84GHz. The Exynos starts off on the A55 cores at idle frequencies around 400-624MHz for 900µs, ramping up to 2210MHz for 4.2ms, before migrating onto the Cortex-A78 cores which start at 1768MHz and ramp up to 2600MHz. Oddly enough, when migrating to the X1 cores the scheduler seems to have troubles migrating the load as the cores run at the idle 533MHz before realising they have work to do and ramp up to the maximum 2.91GHz.
What’s interesting about the Exynos here is that for single-threaded workloads it doesn’t actually visit the A78’s max frequencies – which is actually a benefit for power efficiency and makes the SoC behave more like the Snapdragon counterparts even though is has higher peak frequencies. What’s a bit concerning to see is that even in this extremely simplistic load which is just an add dependency chain, the X1 cores on the Exynos don’t look solid, but rather fluctuate quite a bit. The resulting 2888MHz readout actually doesn’t exist in the SoC’s frequency tables, so I have to wonder if that’s actually real, or if Samsung has employed some new sort of hardware DFS mechanism that works on extremely fine-grained timescales.
In terms of battery life in PCMark between the two phones, because we measured higher power draw on the Exynos, we naturally also see lower battery life on the new Samsung chip compared to the Snapdragon 888 variant of the S21 Ultra. The battery life here is tested in our traditional fashion, with the screen calibrated to 200cd/m² brightness.
The Snapdragon 888 S21 Ultra here fares better than the Galaxy S20 Ultra in terms of battery life, but by a quite minor amount. These results aren’t exactly great given the S21 Ultra’s massively more advanced and more efficient display.
For the Exynos 2100 S21 Ultra, the battery results here are actually slightly worse than the Exynos 990 S20 Ultra. This means that despite the new much more efficient screen, the Exynos 2100 is so aggressive in terms of performance scaling, that it draws notably more average power than the Exynos 990. Yes, the Exynos 2100 is also significantly more performant than its predecessor and this is immediately visible in terms of device usage, but it’s performance that wasn’t just achieved through efficiency, but also through more power usage.
We also got a smaller S21 with the Exynos 2100 – this variant as well as the S21+ do not have the new super-efficient OLED screen the S21 Ultra has, and as such the SoC’s more aggressive power draw is more prominently showcased through quite bad power efficiency in this test at 120Hz.
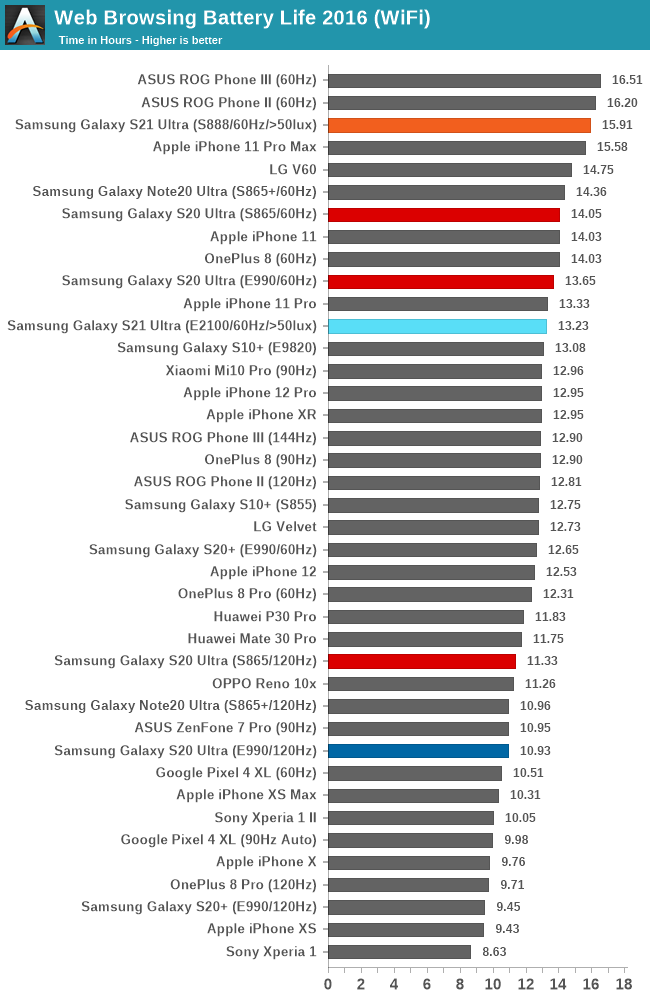
In the web-browsing test, which is less compute heavy and leans more towards display power consumption, both the new S21 Ultras fare significantly better than their predecessor due to the now much improved OLED display. These 120Hz numbers (at QHD no less), are actually fantastic, and just shows the new advancements of the new panel.
Nevertheless, the Snapdragon 888 variant of the S21 Ultra is still falling ahead of the Exynos 2100 version due to the better SoC efficiency and lower power levels. The 12.7% lead here is also similar to the general SoC efficiency differences we’ve seen in the other tests.
Update: February 14th - I'm retracting the 120Hz battery life results of the new VRR/LFD display devices pending re-testing, after discovering power-management inconsistencies in the test results. 60Hz results seem unaffected. Further details in the full review.
As we spend more times with the devices, we’ll be completing the test numbers at 60Hz as well as getting data from our web-browsing test. For the time being, the general view is that these new SoCs showcase quite increased performance, however their power draw has also gone up – meaning that battery life generationally should actually go down – with the exception of other non-SoC factors such as the S21 Ultra’s new more efficient display panel.


123 Comments
View All Comments
eastcoast_pete - Monday, February 8, 2021 - link
Andrei, also special thanks for the power draw comparison of the A55 Little Cores in the (TSMC N7) 865 vs the (Samsung 5 nm) 888! That one graph tells us everything we need to know about what Samsung's current " 5 nm" is really comparable to. I really wonder if QC's decision to chose Samsung's fabbing was more based on availability (or absence thereof for TSMC's 5 nm) or on price?DanD85 - Monday, February 8, 2021 - link
Well, seems like Apple hogging most of TSMC 5nm node leaves other with no other choice but going with the lesser foundry.heraldo25 - Monday, February 8, 2021 - link
For such a thorough review it is shocking to see that software versions (build number) used during tests are not stated.It is absolutely essential that the review contains software versions, so that other can try to replicate results, and for the reviewing site, to have references during re-tests.
name99 - Monday, February 8, 2021 - link
The milc win is certainly from the data prefetcher. In simulation milc also benefits massively from runahead execution, ie same principle (bring in data earlier).Has anyone identified a paper or patent that indicates what ARM are doing? A table driven approach (markov prefetcher) still seems impractical, and ARM don't go in for blunt solutions that just throw area at the problem. They might be doing something like scanning lines as they enter L2 for what look like plausible addresses, and prefetching based on those, which would cover a large range of pointer-based use cases, and seems like the sort of smart low area solution they tend to favor.
trivik12 - Monday, February 8, 2021 - link
Hope Qualcomm moves next gen flagship SOC to TSMC again. Cannot be at so much disadvantage. Of course Samsung 3nm could narrow the gap, but that is more for 2023 flagships.Disappointing to see Exynos disappoint again. How is Exynos1080 as a mid range chipset?
geoxile - Monday, February 8, 2021 - link
Their 3nm is expected to be on par with TSMC N5. The expect gains over 7nm are only 30% higher performance, 35% die area reduction, and 40-50% power reduction. Considering 5LPE is still behind N7P it's not much and will be barely be on par with N5 in density let alone efficiency.jeremyshaw - Monday, February 8, 2021 - link
In other words, Samsung strangled then killed SARC for their failures, only to find the failures were with SSI itself.geoxile - Monday, February 8, 2021 - link
You must be kidding... The Exynos 2100 is at least somewhat close to the Snapdragon 888 in CPU performance. Mali continues to be a problem, and remains so even for the Kirin 9000 on TSMC N5. Mongoose was an abomination that belonged maybe in 2015. Samsung Semiconductor is less competent than TSMC but SARC's mongoose team was a joke.EthiaW - Monday, February 8, 2021 - link
All those attempts to spend transistors niggardly and boost performance by high frequency have failed miserably.Single transistor performance seems to be decaying from node to node now. Flat & Not more enough transistor count=performance regression.
eastcoast_pete - Monday, February 8, 2021 - link
Andrei, when you're testing the actual phone, could you check the battery life with the 5G modem on and off, respectively? 5G modems are supposedly quite power hungry also, and, if it's possible to turn 5G off (but leaving 4G LTE on), it would be interesting to see just how much power 5G really consumes.