How We Test PCIe 4.0 Storage: The AnandTech 2021 SSD Benchmark Suite
by Billy Tallis on February 1, 2021 1:15 PM ESTIO Traces: AnandTech Storage Bench (ATSB)
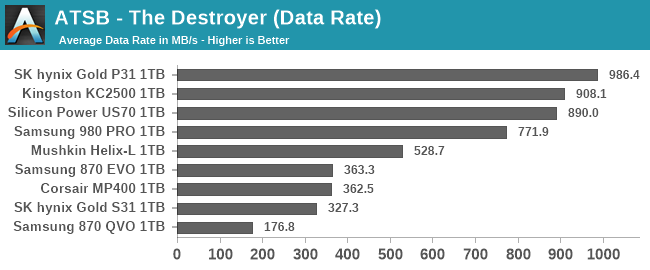
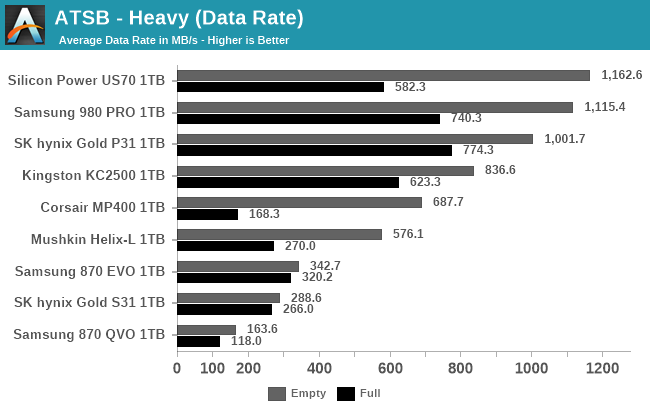
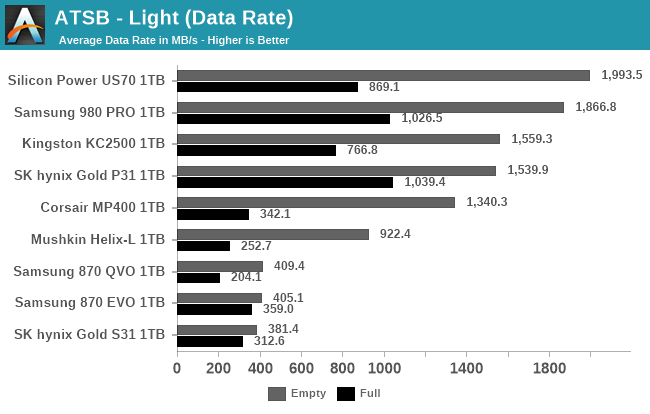
Our in-house suite of storage traces has been a staple of our SSD reviews for almost a decade. The current versions of the AnandTech Storage Bench (ATSB) Light and Heavy tests were introduced in 2011, but soon proved to be insufficient for stressing newer SSDs that were faster and larger. The Destroyer was added in 2013 to provide a much longer and more intense test, and in 2015 we started running the Light and Heavy tests twice: once on an empty drive, and again on a full drive to show the worst-case performance drop.
While these IO traces were recorded a number of years ago, upon regression analysis to a modern environment, the mix of random vs sequential transfers are almost identical. IO patterns involved in ordinary consumer PC usage haven't changed drastically in the past decade. Downloading and installing a recent AAA video game involves a lot more total IO, but things like the mix of random vs sequential transfers are still pretty similar.
The way we have enabled recorded the tests also removes any historic limitations of queue depth limits - IO tracing at the OS level enables the capture of dozens or hundreds of IOs at once, such that playback on modern NVMe systems feel the brute force of the IO required. In practice, queue depths during ordinary desktop usage are usually in the single digits, and on fast NVMe drives like Intel's Optane SSD the queue depths experienced by the drive will tend to be even a bit lower. In the case of TRIM or flush commands, these are relatively uncommon during ordinary consumer workloads, and are often highly variable and inconsistent in their timing, and so those are not present in the test. This was more an issue with older SSDs anyway. Similarly with enterprise drives, most of which enable their own data management.
The IO traces used for the ATSB tests originally recorded the precise timing of every IO operation. During the playback process, the idle times in the trace are cut short to a maximum of 25ms each. This is necessary for the test duration to be reasonable, but it does mean that drives don't get long stretches of idle time to use for garbage collection and flushing SLC caches. But in aggregate, the drives are still spending a lot more time idle than busy: during a relatively quick 7 hour run of The Destroyer, a fast NVMe SSD will only spend a bit more than 2 hours busy with one or more pending IO operation. The rest of the time is accounted for by a very large number of short idle periods.
| AnandTech Storage Bench IO Traces | ||||||||||||||
| The Destroyer | Heavy | Light | ||||||||||||
| Reads | 38.83 million | 2.17 million | 373k | |||||||||||
| Writes | 10.98 million | 1.78 million | 460k | |||||||||||
| Total IO Operations | 49.8 million | 3.99 million | 832k | |||||||||||
| Total GB Read | 1583.02 GiB | 48.63 GiB | 17.97 GiB | |||||||||||
| Total GB Written | 875.62 GiB | 106.32 GiB | 23.25 GiB | |||||||||||
| Typical Test Duration | 7 hours (NVMe) 12 hours (SATA) |
1h 15m | 25m | |||||||||||
Aside from the updated hardware and Windows versions, the one big change we're making to how the ATSB tests are run is a change for the sake of better automation. Previously, the drives being tested were secure erased before each ATSB trace playback, and for the Light and Heavy test runs on a full drive we would erase the drive, fill it, then play back the trace. But secure erasing drives is a hassle when Windows is involved, so this meant manually rebooting to Linux five times for the five trace runs. Our new method is to run all the trace tests in sequence: starting from a freshly-erased empty drive, we run the Light test, then the Heavy and The Destroyer, then fill the drive with sequential writes and run the Light and Heavy tests again. This means that our "empty drive" test runs of the Heavy test and The Destroyer are now running on a lightly-(ab)used drive rather than a freshly-erased drive, and that may bring down the scores somewhat. The full drive run of the Heavy test will also be somewhat affected by the mix of IO performed by the preceding Light test that disturbs the preconditioning of the full-drive sequential write pass. This eases our testing process and saves my sanity somewhat.
As always, we're still giving the drives plenty of idle time (10 minutes) between test runs and after the sequential write pass. The speed of today's NVMe drives mean that the automated sequence of running all five stages of the ATSB tests now takes about the same ~12 hours that was average for a SATA drive to complete just The Destroyer. Batching the ATSB tests together makes for more effective time usage when running these tests overnight, and less sleep lost to manual intervention.
The performance scores presented for each ATSB test include the overall average throughput during the test, and several subscores breaking down average and 99th percentile latency for both read and write operations. We also report the total energy usage during the test, which is a good indication of overall efficiency. Low-power drives that take a long time to complete the test and drives that complete it quickly but with high power draw will both suffer in the energy usage rankings.
 |
|||||||||
| Average Data Rate | |||||||||
| Average Latency | Average Read Latency | Average Write Latency | |||||||
| 99th Percentile Latency | 99th Percentile Read Latency | 99th Percentile Write Latency | |||||||
| Energy Usage | |||||||||
 |
|||||||||
| Average Data Rate | |||||||||
| Average Latency | Average Read Latency | Average Write Latency | |||||||
| 99th Percentile Latency | 99th Percentile Read Latency | 99th Percentile Write Latency | |||||||
| Energy Usage | |||||||||
 |
|||||||||
| Average Data Rate | |||||||||
| Average Latency | Average Read Latency | Average Write Latency | |||||||
| 99th Percentile Latency | 99th Percentile Read Latency | 99th Percentile Write Latency | |||||||
| Energy Usage | |||||||||
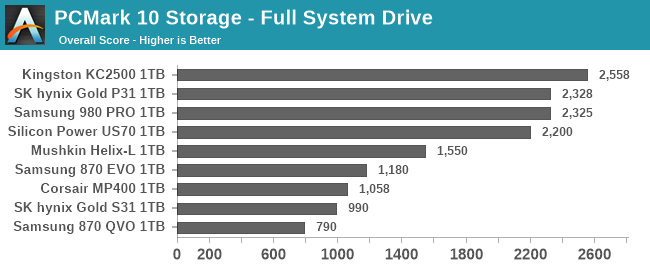
PCMark 10 Storage Benchmarks
At the end of 2019, UL released a major update to their popular PCMark 10 benchmark suite, adding storage performance tests that had been conspicuously absent for over two years. These new storage benchmarks are similar to our AnandTech Storage Bench (ATSB) tests in that they are composed of traces of real-world IO patterns that are replayed onto the drive under test.
PCMark 10 provides four different storage benchmarks. The Full System Drive, Quick System Drive and Data Drive benchmarks cover similar territory to our ATSB Heavy and Light tests, and all three together take about as long to run as the ATSB Heavy and Light tests combined. The Drive Performance Consistency Test is clearly meant to one-up The Destroyer and also measure the worst-case performance of a drive that is completely full. Due to time constraints, we are not yet attempting to add the Drive Performance Consistency Test to our usual test suite. This is a line we're put in to ensure timely arrival of reviews.
| PCMark 10 Storage Tests | ||
| Test Name | Data Written | |
| Data Drive | 15 GB | |
| Quick System Drive | 23 GB | |
| Full System Drive | 204 GB | |
| Drive Performance Consistency | 23 TB + 3x drive capacity | |
The primary subscores for the PCMark 10 Storage benchmarks are average bandwidth and average latency for read and write IOs. These are combined into an overall score by computing the geometric mean of the bandwidth score and the reciprocal of the latency score.
Full System Drive Benchmark
The Full System Drive Benchmark covers a broad range of everyday tasks: booting Windows and starting applications and games, using Office and Adobe applications, and file management. The "Full" in the name does not mean that each drive is filled or that the entire capacity of the drive is tested. Rather, it only indicates that all of the PCMark 10 Storage sub-tests are included in this test.
 |
|||||||||
| Overall Score | Average Bandwidth | Average Latency | |||||||
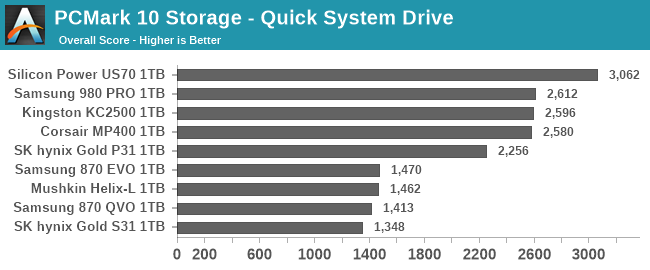
Quick System Drive Benchmark
The Quick System Drive Benchmark is a subset of the Full System Drive Benchmark, running only 6 out of the 23 sub-tests from the Full test.
 |
|||||||||
| Overall Score | Average Bandwidth | Average Latency | |||||||
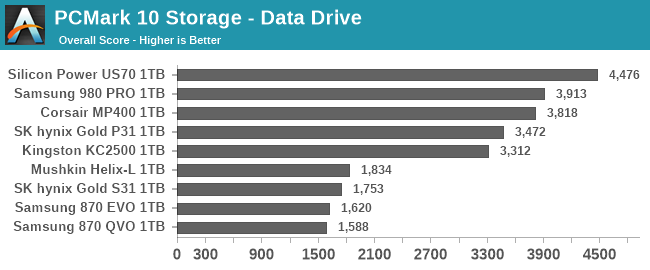
Data Drive Benchmark
The Data Drive Benchmark is intended to represent usage a secondary or portable drive may be subject to. This test simulates copying around files, but does not simulate the IO associated with launching and running applications from a drive.
 |
|||||||||
| Overall Score | Average Bandwidth | Average Latency | |||||||


70 Comments
View All Comments
Billy Tallis - Monday, February 1, 2021 - link
I set up the testbed with an old 5450 I had lying around, and once all the software was configured I pulled the GPU back out. (That ancient GPU interferes with suspend, which is needed to unlock drives so they can be secure erased.) The system boots without complaint with no GPU, and I use SSH and RDP to run the tests. I'm keeping the 580 in the other system for now because I want to work on getting some application or gaming tests working on that machine when I have spare time.Billy Tallis - Monday, February 1, 2021 - link
I should mention that I have had a bit of trouble booting the ASRock B550 Pro motherboard, because it seems to have half-assed UEFI boot support. The motherboard will forget its boot settings at the slightest provocation, and when that happens it will search for and boot the first Windows it can find. It refuses to detect a Linux bootloader on an internal drive, even if it's in the canonical EFI/Boot/bootx64.efi location on the ESP. So any time this machine decides to forget its boot settings, I have to plug in a GPU and keyboard and boot a Linux off a USB device to re-create the UEFI boot entry for grub.DominionSeraph - Monday, February 1, 2021 - link
This is the power of AMD.Billy Tallis - Monday, February 1, 2021 - link
On the other hand, I was quite surprised to discover that a quad M.2 riser works on this board. Intel would never let PCIe bifurcation be enabled on an entry-level motherboard.Slash3 - Wednesday, February 3, 2021 - link
Asus actually bundles a quad NVMe M.2 adapter with their Strix B550-XE, for some absolutely baffling reason. I tried asking the Asus technical marketing rep on Reddit why they did this, but he didn't understand the question. What a weird friggin decision.https://rog.asus.com/us/motherboards/rog-strix/rog...
frbeckenbauer - Tuesday, February 2, 2021 - link
I have had the same issue on my old ASRock intel board, on my current MSI AMD board, on my Intel laptop, and on my AMD laptop. People really like writing UEFIs that just randomly boot a windows they find for no reasonkepstin - Tuesday, February 2, 2021 - link
I've seen a few AMD boards that have bios options to enable headless operation - basically, setting that option disables the post check for the graphics card. If you're running in native UEFI mode and your operating system doesn't require a GPU, it'll work fine.Makaveli - Monday, February 1, 2021 - link
This was a great article thank you Billy!WaltC - Monday, February 1, 2021 - link
Nice write up...;) Seems rather unsurprising that the two PCIe4 drives running in PCIe4 mode (I gather from the test hardware described) were the best overall performing in your tests. Although you described the PCIe/SATA interfaces of most of the drives--I wasn't clear on the Mushkin or the MP400. Also, a more thorough description of the drivers employed would help--open source or proprietary, etc. Linux distro tests, however, would seem to me to be of somewhat less "practical" value than Win10 tests--considering that Win10 is where the overwhelming bulk of these drives will be deployed by the consumers who buy them, I would think. Overall, it's nice to see changes here in AT's testing methodology!evilspoons - Monday, February 1, 2021 - link
Nice to see another substantial benchmark upgrade, keeping up with this stuff can be mind-boggling at times.The article could use someproofreading though. Even just the first paragraph:
"on accident" -> by accident
"holy unified metric" -> wholly-unified metric
Unless religion is somehow involved in benchmarking SSDs 😉