The Ampere Altra Review: 2x 80 Cores Arm Server Performance Monster
by Andrei Frumusanu on December 18, 2020 6:00 AM EST- Posted in
- Servers
- Neoverse N1
- Ampere
- Altra
SPECjbb MultiJVM - Java Performance
Moving on from SPECCPU, we shift over to SPECjbb2015. SPECjbb is a from ground-up developed benchmark that aims to cover both Java performance and server-like workloads, from the SPEC website:
“The SPECjbb2015 benchmark is based on the usage model of a worldwide supermarket company with an IT infrastructure that handles a mix of point-of-sale requests, online purchases, and data-mining operations. It exercises Java 7 and higher features, using the latest data formats (XML), communication using compression, and secure messaging.
Performance metrics are provided for both pure throughput and critical throughput under service-level agreements (SLAs), with response times ranging from 10 to 100 milliseconds.”
The important thing to note here is that the workload is of a transactional nature that mostly works on the data-plane, between different Java virtual machines, and thus threads.
We’re using the MultiJVM test method where as all the benchmark components, meaning controller, server and client virtual machines are running on the same physical machine.
The JVM runtime we’re using is OpenJDK 15 on both x86 and Arm platforms, although not exactly the same sub-version, but closest we could get:
Altra system:
openjdk 15.0.1 2020-10-20

OpenJDK Runtime Environment 20.9 (build 15.0.1+9)

OpenJDK 64-Bit Server VM 20.9 (build 15.0.1+9, mixed mode, sharing)
EPYC & Xeon systems:
openjdk 15 2020-09-15

OpenJDK Runtime Environment (build 15+36-Ubuntu-1)

OpenJDK 64-Bit Server VM (build 15+36-Ubuntu-1, mixed mode, sharing)
Furthermore, we’re configuring SPECjbb’s runtime settings with the following configurables:
SPEC_OPTS_C="-Dspecjbb.group.count=$GROUP_COUNT -Dspecjbb.txi.pergroup.count=$TI_JVM_COUNT -Dspecjbb.forkjoin.workers=N -Dspecjbb.forkjoin.workers.Tier1=N -Dspecjbb.forkjoin.workers.Tier2=1 -Dspecjbb.forkjoin.workers.Tier3=16"
Where N=160 for 2S Altra test runs, N=80 for 1S Altra test runs, N=112 for 2S Xeon, N=56 for 1S Xeon, and N=128 for 2S and 1S on the EPYC system. I tried running 256 or 160 threads on the 2S EPYC configuration but the benchmark would error out with a critical timeout and I wasn’t able to fully debug as to why it did that.
In terms of JVM options, we’re limiting ourselves to bare-bone options to keep things simple and straightforward:
Altra & EPYC system:
JAVA_OPTS_C="-server -Xms2g -Xmx2g -Xmn1536m"

JAVA_OPTS_TI="-server -Xms2g -Xmx2g -Xmn1536m"

JAVA_OPTS_BE="-server -Xms48g -Xmx48g -Xmn42g -XX:+AlwaysPreTouch"
Xeon system:
JAVA_OPTS_C="-server -Xms2g -Xmx2g -Xmn1536m"

JAVA_OPTS_TI="-server -Xms2g -Xmx2g -Xmn1536m"

JAVA_OPTS_BE="-server -Xms172g -Xmx172g -Xmn156g -XX:+AlwaysPreTouch"
The reason the Xeon system is running a larger back-end heap is because we’re running a single NUMA node per socket, while for the Altra and EPYC we’re running four NUMA nodes per socket for maximised throughput, meaning for the 2S figures we have 8 backends running for the Altra and EPYC and 2 for the Xeon, and naturally half of those numbers for the 1S benchmarks. The back-ends and transaction injectors are affinitised to their local NUMA node with numactl –cpunodebind and –membind, while the controller is called with –interleave=all.
The max-jOPS and critical-jOPS result figures are defined as follows:
"The max-jOPS is the last successful injection rate before the first failing injection rate where the reattempt also fails. For example, if during the RT-curve phase the injection rate of 80000 passes, but the next injection rate of 90000 fails on two successive attempts, then the max-jOPS would be 80000."
"The overall critical-jOPS is computed by taking the geomean of the individual critical-jOPS computed at these five SLA points, namely:
• Critical-jOPSoverall = Geo-mean of (critical-jOPS@ 10ms, 25ms, 50ms, 75ms and 100ms response time SLAs)
During the RT curve building phase the Transaction Injector measures the 99th percentile response times at each step level for all the requests (see section 9) that are considered in the metrics computations. It then computes the Critical-jOPS for each of the above five SLA points using the following formula:
(first * nOver + last * nUnder) / (nOver + nUnder) "
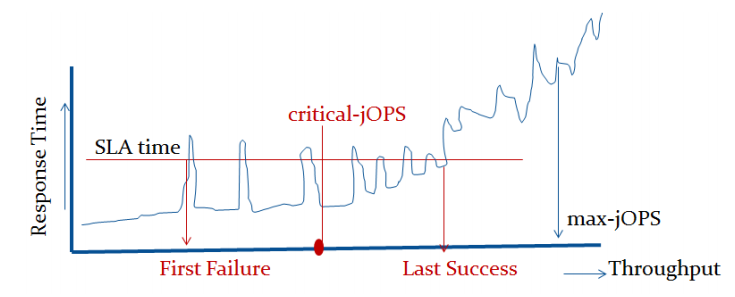
That’s a lot of technicalities to explain an admittedly complex benchmark, but the gist of it is that max-jOPS represents the maximum transaction throughput of a system until further requests fail, and critical-jOPS is an aggregate geomean transaction throughput within several levels of guaranteed response times, essentially different levels of quality of service.
Beyond the result figures, the benchmark keeps detailed track of timings of responses and tracks a few important statistical data-points across a response-time curve, as follows:
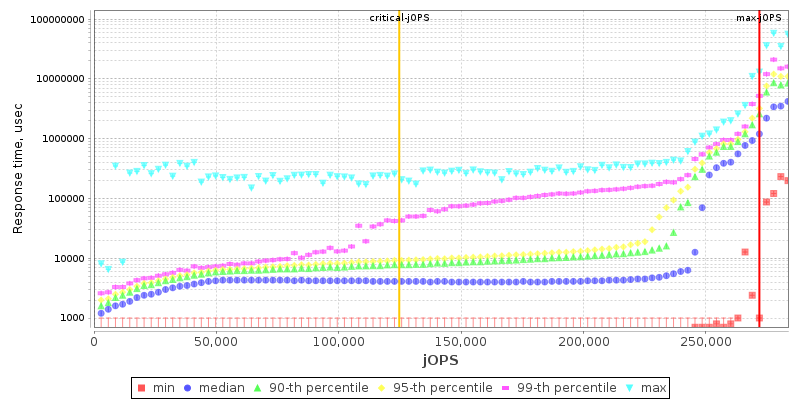
2S EPYC 7742 THP Enabled
I’m starting off with the EPYC results as they’re sort of standard – the max-jOPS here ends up quite high at over 270k, while the critical-jOPS ends up around 125k. The system still manages to retain 90th percentile response times under 20ms up until 230k which is excellent, with 99th percentile results starting to degrade after 110k jOPS.

2S Xeon 8280 THP Enabled
On the Xeon system, we see similar flat 90th percentile response times up until around 120k with 99th percentiles starting to degrade following 90k, but in a much tighter curve than on the EPYC system – while the system here has less overall throughput its scaling up to that throughput limit could be considered to be better.
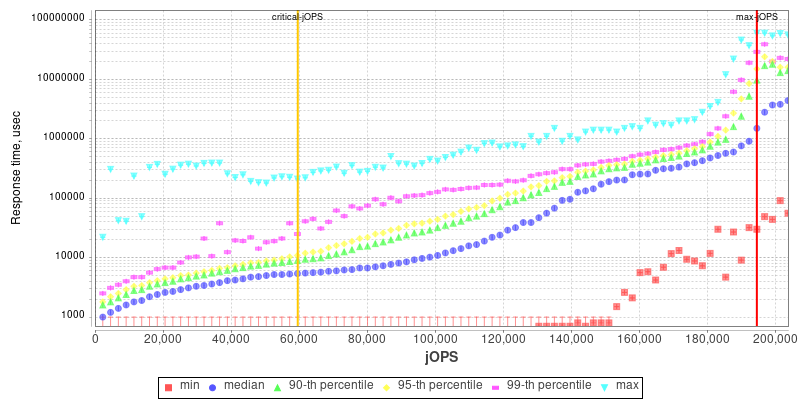
2S Altra Q80-33 THP Enabled
With the EPYC and Xeon systems as context, we’re finally looking at the Altra results, which look very different.
Unlike the x86 systems, 99th and 90th percentile response times degrade earlier on in the throughput curve for the Altra chip. What this actually reminded me of is the STREAM results from earlier in the review where we saw that initially a bunch of cores were able to hit peak bandwidth across the memory controllers, but adding further cores to the mix actually degraded performance, pointing out to suboptimal congestion across the mesh interconnect.
It might be possible that the results here across SPECjbb are hitting a similar level of saturation under load, given that there’s a lot of inter-core communication and memory transactions happening.
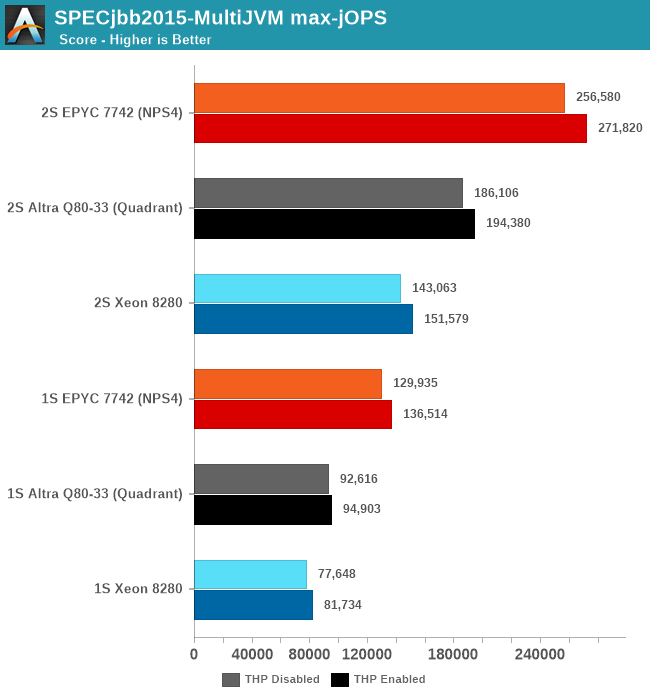
Charting the max-jOPS of the different systems, I ran figures for both 1S and 2S system configurations. Additionally, I also tested out the benchmark both with transparent huge pages always enabled, and to a default not used / madvise state, as we’ve seen in the past that this can have a notable impact on the resulting performance.
Whilst the Altra system is able to beat the Xeon, it’s not sufficient to match the EPYC system which still lies considerably ahead by a good margin. The exact reasons for this discrepancy compared to the x86 systems isn’t immediately clear, as we’re dealing with many layers here. AArch64 OpenJDK JVM performance certainly might not be as mature and optimised as the x86-64 counterparts, and there is certainly a rabbit hole of various optimisations and knobs we could have tried to change things – although we still view these simple default out-of-the-box settings to still be valuable and valid in terms of comparisons.
One thing that did come to mind immediately when I saw the results was SMT. Due to this being a transactional data-plane resident type of workload, SMT will undoubtedly help a lot in terms of performance, so I tested out the EPYC chip figures with SMT disabled, and indeed max-jOPS went down to 209.5k for the 2S THP enabled results, meaning that SMT accounts for a 29.7% performance benefit in this benchmark.
A further indication that the Altra system is being underutilised on the part of the cores and memory-bottlenecked is its power consumption, which even when fully loaded in the RT curve, it generally hovered around 170-180W per socket, while the x86 systems were filling up their TDPs.
It’s generally these kinds of workloads that SMT works best on, and that’s why IBM can deploy SMT4 or SMT8 processors, and the type of workloads Marvell’s ThunderX was trying to carve a niche or itself with SMT4.
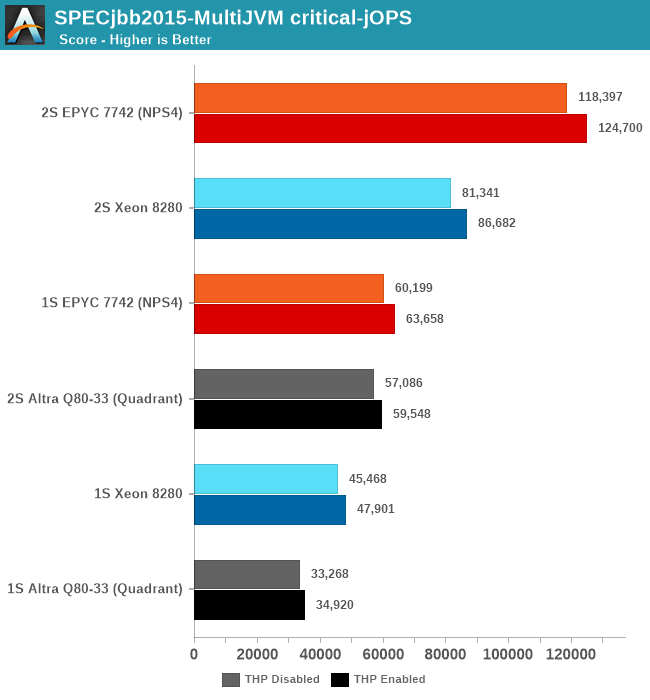
For the critical-jOPS figures, the Altra doesn’t do well at all given its response-time curve. Beyond the lack of SMT (The EPYC here again achieves its high score through a 26.4% contribution of the secondary logical cores), we’re maybe looking at a software side immaturity of out-of-the-box Java performance on Arm systems. The figures here shouldn’t be taken with absolute authority with a conclusion that Java performance on the Altra sucks, but at least we’re seeing signs that it doesn’t look too great.


148 Comments
View All Comments
Andrei Frumusanu - Sunday, January 3, 2021 - link
I actually did test those setups:2S Q64-33 setup: 433.7 SPECint2017 - 341.7 SPECfp2017
Pyxar - Wednesday, December 23, 2020 - link
This is cool and all but what could an arm processor server be used for? Aside from some linux compilations there isn't that much support for arm processors.This is looking a lot like the early days of computing where BeBox was powered by PowerPC cpu, a system looking to find a niche that doesn't exist (yet). It was cool for it's time but very little demand for it.
mode_13h - Wednesday, December 23, 2020 - link
Pretty much everything needed to run modern web services has been ported to ARM. I believe a number of high-profile sites are now using Amazon Graviton2, due to its pricing advantage.As for client computing, the Pi has emerged as a basic, usable desktop platform.
mode_13h - Thursday, December 24, 2020 - link
Also, a couple years ago, Nvidia announced support for their entire software stack on ARM host CPUs. So, I'd say it should also be a decent platform for machine learning, now.Bytales - Wednesday, December 23, 2020 - link
You should have tested some CPU mining bechmarks like Monero's randomX, Wownero's randomwow, Turtle's argon2id Chukwa v2, and DERO's AstroBWT. That would have been interesting as shieeet.Miguelxataka - Sunday, January 3, 2021 - link
7742 (15 months ago release) 225w 67.000 point passmark??? why?? 7702 200w 71.000 points passmark. With 7702 the comparision!!7702 (200w) Zen 2 vs Ampere (250w). 20% less power consumption + with Zen 3 20% extra power consumption =36%?
Where are the power efficiency of the RISC/ARM processors here?
Rance - Friday, July 16, 2021 - link
For the specjbb 2015 data, what was the baseline pagesize set to?4KB/64KB/?
Thanks!
sunwins - Tuesday, October 12, 2021 - link
I guess the speccpu2017 test result is wrong.Maybe there were some problems such as bios version or speccpu software configuration.Reference link:
https://www.spec.org/cpu2017/results/rfp2017.html
https://www.spec.org/cpu2017/results/rint2017.html
AMD 7742 speccpu2017 intrate official value:353 per socket
AMD 7742 speccpu2017 intfp official value:270 per socket
INTEL 8280 speccpu2017 intrate official value:172 per socket
INTEL 8280 speccpu2017 intfp official value:141 per socket
Ampere Q80-33 offcial speccpu2017 intrate value:300 per socket
if you hava any question or updation,please touch 799517515@qq.com。