The Corsair MP400 1TB QLC NVMe SSD: A Quick Review
by Billy Tallis on December 11, 2020 2:00 PM ESTBurst IO Performance
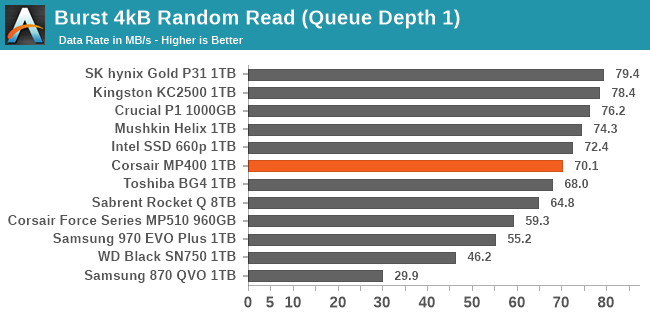
Our burst IO tests run at a queue depth of one and the amount of data transferred is limited to ensure that SLC write buffers don't fill up and controllers don't overheat. In between each burst there's enough idle time to keep the drive averaging a 20% duty cycle, allowing for some buffered writes and deferred garbage collection to be completed. The random read and write tests use 4kB operations and the sequential tests use 128kB operations. All the burst tests are confined to a 16GB portion of the drive, so DRAMless SSDs are not disadvantaged as much as they are for larger tests.
 |
|||||||||
| Random Read | Random Write | ||||||||
| Sequential Read | Sequential Write | ||||||||
The aggressive SLC caching strategy used by the Corsair MP400 and most other QLC NVMe SSDs allows them to provide best-case random IO performance that is competitive with many high-end PCIe 3.0 drives. However, despite the 8-channel controller, the burst sequential IO performance of the Corsiar MP400 is still fairly low by NVMe standards. The Sabrent Rocket Q 8TB's results indicate that at least some of the higher-capacity MP400 models should also be able to provide better burst sequential write speeds by virtue of having larger and faster SLC caches.
Sustained IO Performance
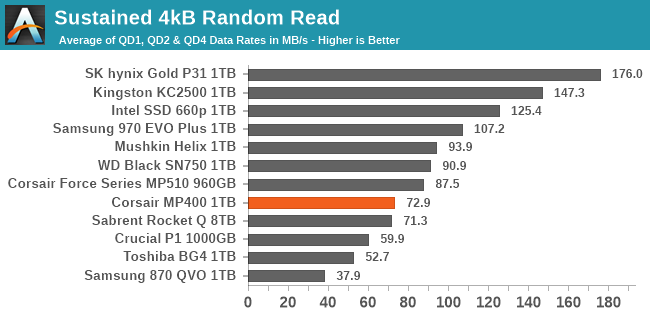
Our sustained IO tests measure performance on queue depths up to 32, but the scores reported here are only the averages for the low queue depths (1,2,4) that are most representative of real-world consumer workloads. Each queue depth is tested for up to one minute or 32GB, and the tests are confined to a 64GB span of the drive.
 |
|||||||||
| Random Read | Random Write | ||||||||
| Sequential Read | Sequential Write | ||||||||
On the longer synthetic IO tests, the Corsair MP400's best results are for random writes, where its SLC cache is sufficient to keep it competitive against high-end PCIe 3 drives. The sequential write and random read performance scores are both constrained to the entry-level NVMe performance ranges, but are competitive for that market segment. The sequential read performance is relatively poor even for entry-level NVMe drives, though still significantly better than Samsung's QLC SATA alternative.
 |
|||||||||
| Random Read | Random Write | ||||||||
| Sequential Read | Sequential Write | ||||||||
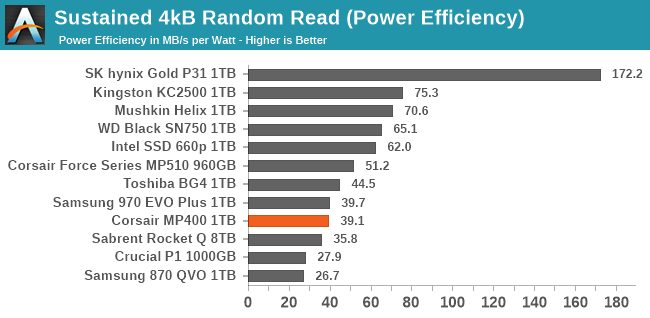
With QLC NAND and an aging 8-channel controller, it's no surprise that the Corsair MP400's power efficiency scores are generally unimpressive, especially compared to what the 4-channel NVMe drives score when they are performing well. However, the only particularly poor efficiency score from the MP400 is for the sequential read test that it did not perform well on.
 |
|||||||||
| Random Read | Random Write | ||||||||
| Sequential Read | Sequential Write | ||||||||
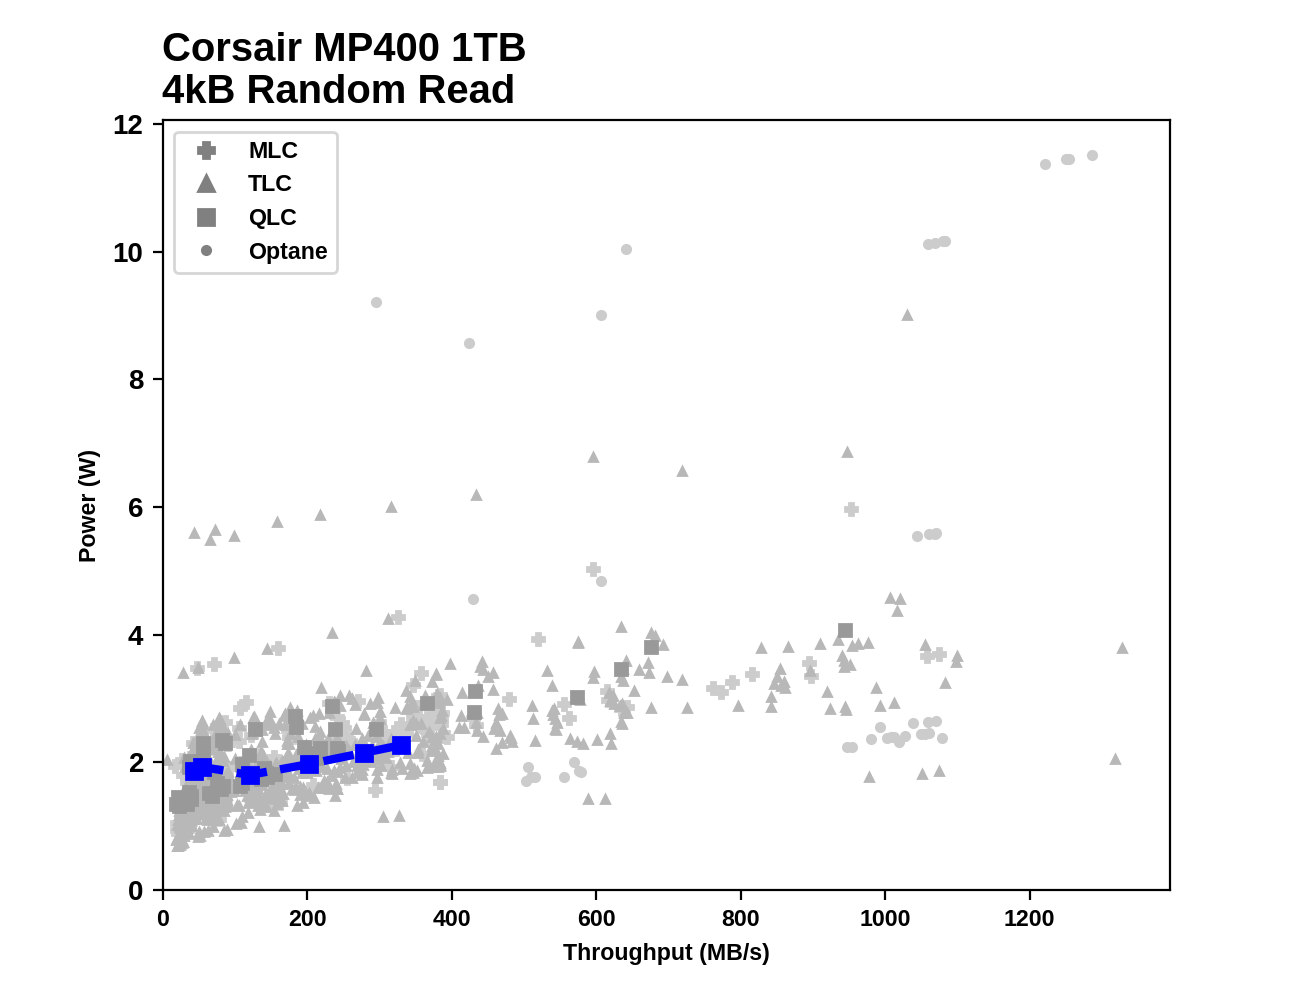
Plotting power and performance against our entire library of benchmark results shows that—for better or for worse—the Corsair MP400 doesn't stand out from the crowd or break new ground. The random read performance stays entirely within the range of SATA drives. Random and sequential writes make some use of PCIe performance, but don't come close to saturating the PCIe 3 x4 interface. The sequential read performance does almost make it to 3GB/s at higher queue depths, but it isn't able to fully saturate the PCIe interface the way the 8TB Sabrent Rocket Q can.
 |
|||||||||
| Random Read | |||||||||
| Random Write | |||||||||
| Sequential Read | |||||||||
| Sequential Write | |||||||||
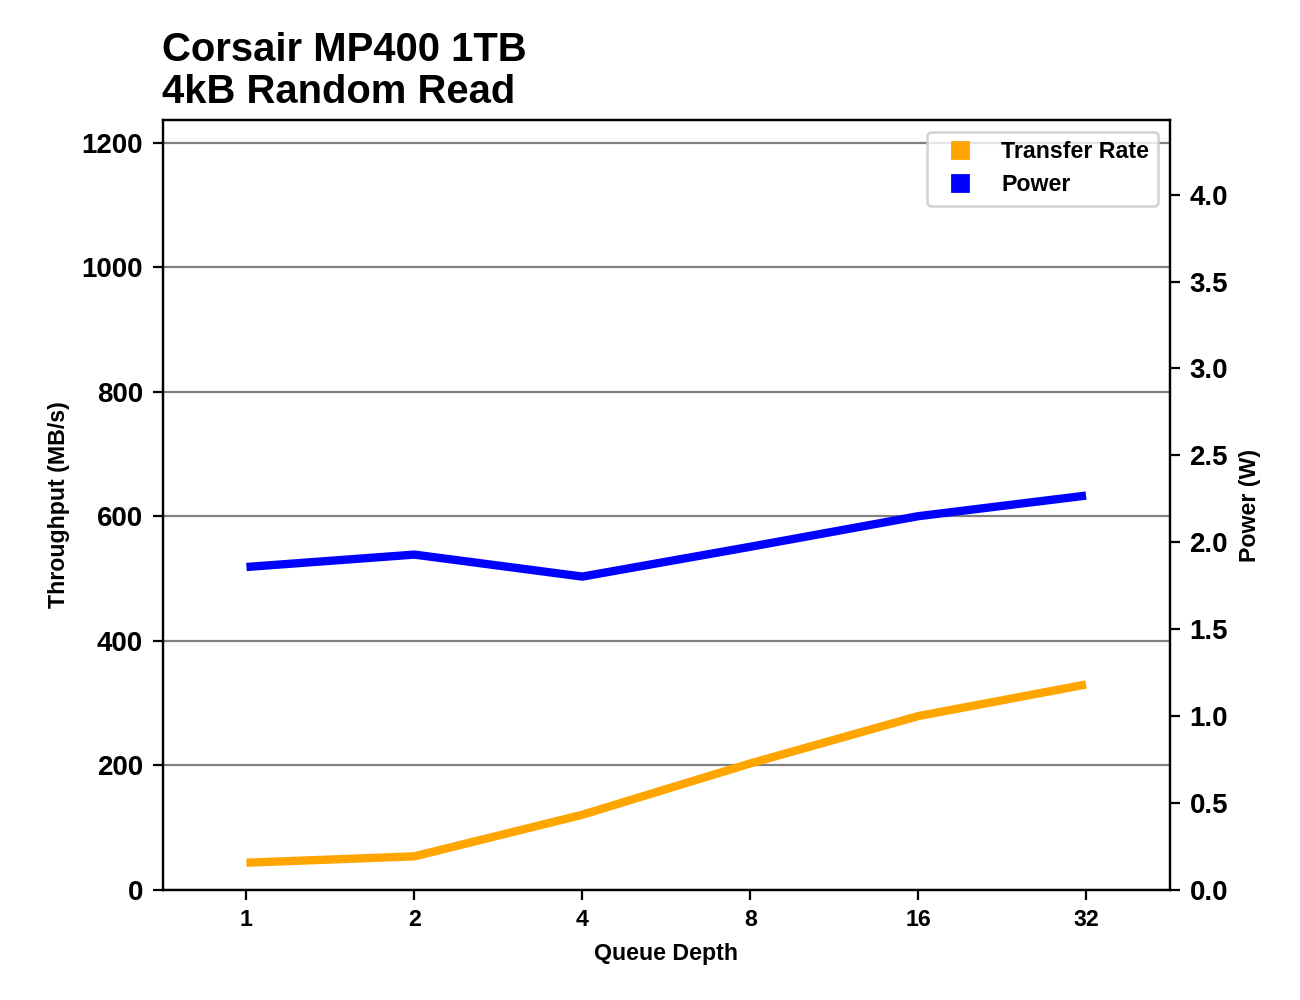
Digging into how performance and power scale with increasing queue depths reveals no particular surprises for the Corsair MP400. The biggest discrepancies with the 8TB Sabrent Rocket Q are for random reads and sequential writes: more flash allows the 8TB drive to continue scaling up random read performance after the 1TB MP400 is starting to reach saturation, and the larger SLC cache for the 8TB drive allows higher and more consistent sequential write performance.


75 Comments
View All Comments
GeoffreyA - Tuesday, December 15, 2020 - link
My mistake! Made a blunder here. LBAs written (241) are the host/OS writes. Well, I can't seem to find SMART value 249 (NAND writes). Cunning work by Samsung, not exposing that value.Is where "Wear Leveling Count" the one to use with the P/E cycles? Mine is at 5. Calculating 5 / 2,000 (for TLC, roughly) doesn't seem to yield a sensible value, against the drive's TBW and the OS writes. I'm stumped.
GeoffreyA - Tuesday, December 15, 2020 - link
Another AT article helped here. Seems to be that 1 P/E cycle equals the capacity of the drive in NAND writes, roughly; and the raw Wear Levelling Count equates to used P/E cycles.Roughly: Raw WLC x drive capacity == NAND writes
For me, I get: 5 x 500 == 2,500 GB
I'm scratching my head though because that yields a write amplification that seems erroneously small, only 1.09x (2,500 nand / 2,300 host).
https://www.anandtech.com/show/8239/update-on-sams...
MDD1963 - Sunday, December 13, 2020 - link
'only 200 TBW'...based on my 10 TB per year as a 4 hours per day 'ordinary desktop user/surfer', the drive would be ending it's life in writes at merely 20 years for me... Best to shop elsewhere! :)nucc1 - Wednesday, December 16, 2020 - link
I just looked at the SMART data for my solid state devices, and I'm averaging 0.03 TB per day. over 660 (total power on) days on my oldest SSD. According to Aida64, the drive still has about 95% remaining lifetime. It's a Samsung Sata 850 EVO 500GB.I like to think I'm not an average user, because this machine is running boinc always, and I use these SSDs for running virtual machines whose lifetime is typically less than 90 days each and, I'm also hosting a media server on this machine for in-home streaming.
I used to worry about longevity too, thinking myself to be a heavy user, but the numbers have not borne this suspicion out.
My current OS boot drive, with bitlocker ON is a sabrent 1TB nvme device, currently averaging 0.022 TB written per day over it's 160 day lifetime, and 99% lifetime remaining. If endurance is the only thing that kills these drives, I have many years of worry-free operation left in all these budget, consumer drives packed into my system.
shabby - Friday, December 11, 2020 - link
Go home corsair, you're drunk...You guys should stop accepting these overpriced qlc junk drives for review.
boozed - Friday, December 11, 2020 - link
Why, so we'll never know how they perform?shabby - Friday, December 11, 2020 - link
We don't need to know how they perform, just their price, we know they all perform like shit.Maverick009 - Friday, December 11, 2020 - link
Not exactly true. QLC drives are still a step up from mechanical drives in certain case scenarios, and depending on the pairing of the controller, can even come close or on par with some of their counterparts.Rather have choice with competition rather then your narrow sight of vision as not every drive is built the same.
Gigaplex - Wednesday, December 16, 2020 - link
And then when a QLC drive comes out that's actually good, we'd never know...kpb321 - Friday, December 11, 2020 - link
Price is always where the QLC drives have failed for me. As the article notes it is usually pretty easy to find an 8 channel with dram drive for minimal price premium over one of the QLC drives. Not to mention the other low cost variants with 4 channels and/or dramless that are almost always available at similar price points and while they might have some compromises also compared the better drives they are usually smaller compromises and easier to accept. I just don't see the QLC drive providing the value if there are TLC alternatives available.