The Corsair MP400 1TB QLC NVMe SSD: A Quick Review
by Billy Tallis on December 11, 2020 2:00 PM ESTAnandTech Storage Bench - The Destroyer
The Destroyer is an extremely long test replicating the access patterns of very IO-intensive desktop usage. A detailed breakdown can be found in this article. Like real-world usage, the drives do get the occasional break that allows for some background garbage collection and flushing caches, but those idle times are limited to 25ms so that it doesn't take all week to run the test. These AnandTech Storage Bench (ATSB) tests do not involve running the actual applications that generated the workloads, so the scores are relatively insensitive to changes in CPU performance and RAM from our new testbed, but the jump to a newer version of Windows and the newer storage drivers can have an impact.
We quantify performance on this test by reporting the drive's average data throughput, the average latency of the I/O operations, and the total energy used by the drive over the course of the test.
 |
|||||||||
| Average Data Rate | |||||||||
| Average Latency | Average Read Latency | Average Write Latency | |||||||
| 99th Percentile Latency | 99th Percentile Read Latency | 99th Percentile Write Latency | |||||||
| Energy Usage | |||||||||
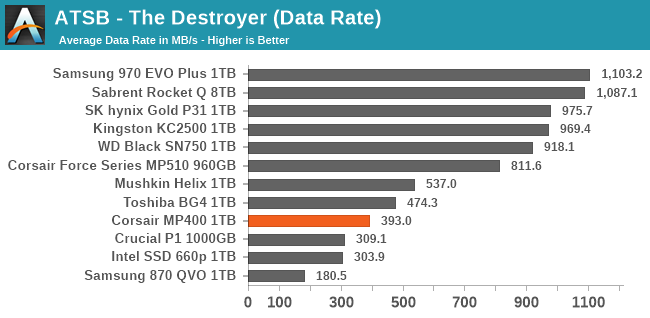
The Corsair MP400 is faster on The Destroyer than the other 1TB QLC drives that are based on 4-channel controllers, but it's also generally slower than the DRAMless TLC drives. The MP400 and other QLC drives also require far more energy than the fairly efficient DRAMless TLC competition.
AnandTech Storage Bench - Heavy
Our Heavy storage benchmark is proportionally more write-heavy than The Destroyer, but much shorter overall. The total writes in the Heavy test aren't enough to fill the drive, so performance never drops down to steady state. This test is far more representative of a power user's day to day usage, and is heavily influenced by the drive's peak performance. The Heavy workload test details can be found here. This test is run twice, once on a freshly erased drive and once after filling the drive with sequential writes.
 |
|||||||||
| Average Data Rate | |||||||||
| Average Latency | Average Read Latency | Average Write Latency | |||||||
| 99th Percentile Latency | 99th Percentile Read Latency | 99th Percentile Write Latency | |||||||
| Energy Usage | |||||||||
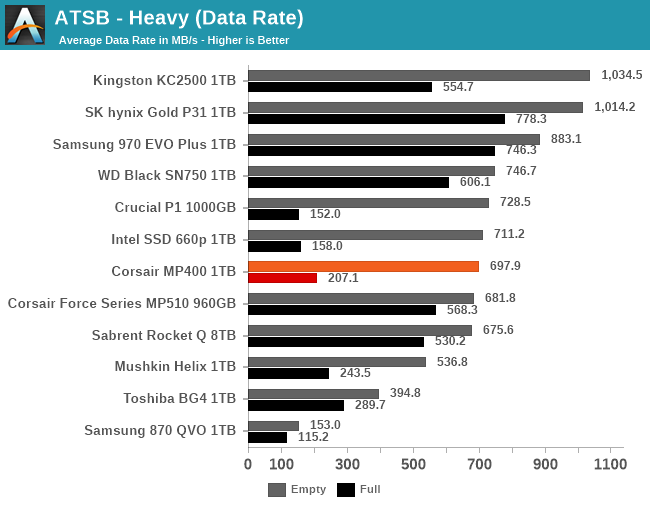
On the Heavy test, the Corsair MP400 and other QLC drives offer superior peak performance compared to the DRAMless TLC drives, but that situation is reversed when the test is run on a full drive. The MP400 in particular doesn't seem to be as good as the other QLC drives at maintaining decent read latency when full, but this test is very write-intensive so the MP400's overall performance on the full-drive test run is still better than the other QLC drives.
AnandTech Storage Bench - Light
Our Light storage test has relatively more sequential accesses and lower queue depths than The Destroyer or the Heavy test, and it's by far the shortest test overall. It's based largely on applications that aren't highly dependent on storage performance, so this is a test more of application launch times and file load times. This test can be seen as the sum of all the little delays in daily usage, but with the idle times trimmed to 25ms it takes less than half an hour to run. Details of the Light test can be found here. As with the ATSB Heavy test, this test is run with the drive both freshly erased and empty, and after filling the drive with sequential writes.
 |
|||||||||
| Average Data Rate | |||||||||
| Average Latency | Average Read Latency | Average Write Latency | |||||||
| 99th Percentile Latency | 99th Percentile Read Latency | 99th Percentile Write Latency | |||||||
| Energy Usage | |||||||||
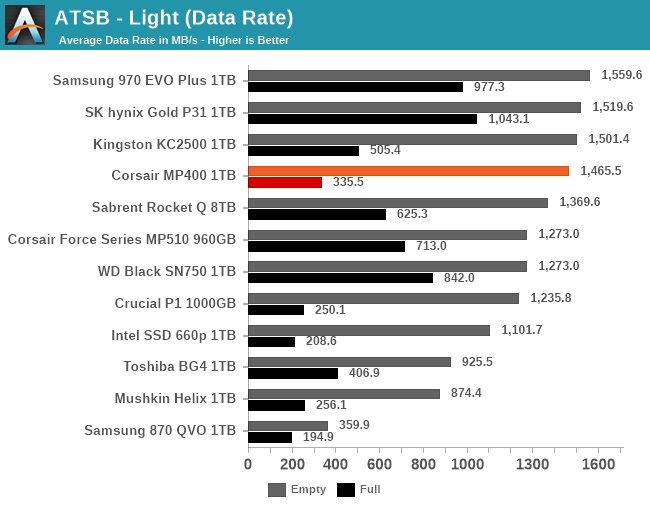
The Light test is short enough to fit entirely within the SLC cache of the 1TB Corsair MP400 when the test is run on an empty drive. That allows the MP400 to outperform the 8TB Sabrent Rocket Q, which is burdened with extra overhead of managing so much flash. The DRAMless TLC drives cannot match the peak performance of the QLC drives that have DRAM. When the test is run on a full drive, the performance of the QLC drives as usual suffers greatly, but the Corsair MP400 remains faster than at least some of the DRAMless TLC drives.


75 Comments
View All Comments
GeoffreyA - Tuesday, December 15, 2020 - link
My mistake! Made a blunder here. LBAs written (241) are the host/OS writes. Well, I can't seem to find SMART value 249 (NAND writes). Cunning work by Samsung, not exposing that value.Is where "Wear Leveling Count" the one to use with the P/E cycles? Mine is at 5. Calculating 5 / 2,000 (for TLC, roughly) doesn't seem to yield a sensible value, against the drive's TBW and the OS writes. I'm stumped.
GeoffreyA - Tuesday, December 15, 2020 - link
Another AT article helped here. Seems to be that 1 P/E cycle equals the capacity of the drive in NAND writes, roughly; and the raw Wear Levelling Count equates to used P/E cycles.Roughly: Raw WLC x drive capacity == NAND writes
For me, I get: 5 x 500 == 2,500 GB
I'm scratching my head though because that yields a write amplification that seems erroneously small, only 1.09x (2,500 nand / 2,300 host).
https://www.anandtech.com/show/8239/update-on-sams...
MDD1963 - Sunday, December 13, 2020 - link
'only 200 TBW'...based on my 10 TB per year as a 4 hours per day 'ordinary desktop user/surfer', the drive would be ending it's life in writes at merely 20 years for me... Best to shop elsewhere! :)nucc1 - Wednesday, December 16, 2020 - link
I just looked at the SMART data for my solid state devices, and I'm averaging 0.03 TB per day. over 660 (total power on) days on my oldest SSD. According to Aida64, the drive still has about 95% remaining lifetime. It's a Samsung Sata 850 EVO 500GB.I like to think I'm not an average user, because this machine is running boinc always, and I use these SSDs for running virtual machines whose lifetime is typically less than 90 days each and, I'm also hosting a media server on this machine for in-home streaming.
I used to worry about longevity too, thinking myself to be a heavy user, but the numbers have not borne this suspicion out.
My current OS boot drive, with bitlocker ON is a sabrent 1TB nvme device, currently averaging 0.022 TB written per day over it's 160 day lifetime, and 99% lifetime remaining. If endurance is the only thing that kills these drives, I have many years of worry-free operation left in all these budget, consumer drives packed into my system.
shabby - Friday, December 11, 2020 - link
Go home corsair, you're drunk...You guys should stop accepting these overpriced qlc junk drives for review.
boozed - Friday, December 11, 2020 - link
Why, so we'll never know how they perform?shabby - Friday, December 11, 2020 - link
We don't need to know how they perform, just their price, we know they all perform like shit.Maverick009 - Friday, December 11, 2020 - link
Not exactly true. QLC drives are still a step up from mechanical drives in certain case scenarios, and depending on the pairing of the controller, can even come close or on par with some of their counterparts.Rather have choice with competition rather then your narrow sight of vision as not every drive is built the same.
Gigaplex - Wednesday, December 16, 2020 - link
And then when a QLC drive comes out that's actually good, we'd never know...kpb321 - Friday, December 11, 2020 - link
Price is always where the QLC drives have failed for me. As the article notes it is usually pretty easy to find an 8 channel with dram drive for minimal price premium over one of the QLC drives. Not to mention the other low cost variants with 4 channels and/or dramless that are almost always available at similar price points and while they might have some compromises also compared the better drives they are usually smaller compromises and easier to accept. I just don't see the QLC drive providing the value if there are TLC alternatives available.