AMD Zen 3 Ryzen Deep Dive Review: 5950X, 5900X, 5800X and 5600X Tested
by Dr. Ian Cutress on November 5, 2020 9:01 AM ESTConclusion: AMD Has Ryzen To The Top
Coming out the other end of this review, it’s hard to believe the extent to which some of AMD’s performance numbers have grown in the last five years. Even within the Ryzen family, we can pinpoint the leaps and bounds by which AMD is now the market leader in pure x86 performance.
Let’s start with some headline numbers.
+19% IPC Gain Confirmed
AMD quoted to us a raw IPC gain from Zen2 to Zen3 of +19%. AMD measured this with 25 workloads and both processors at 4.0 GHz, running DDR4-3600 memory. By comparison, we test with industry standard benchmarks at rated clock speeds and JEDEC supported memory, and we were able to accurately achieve that +19% number.
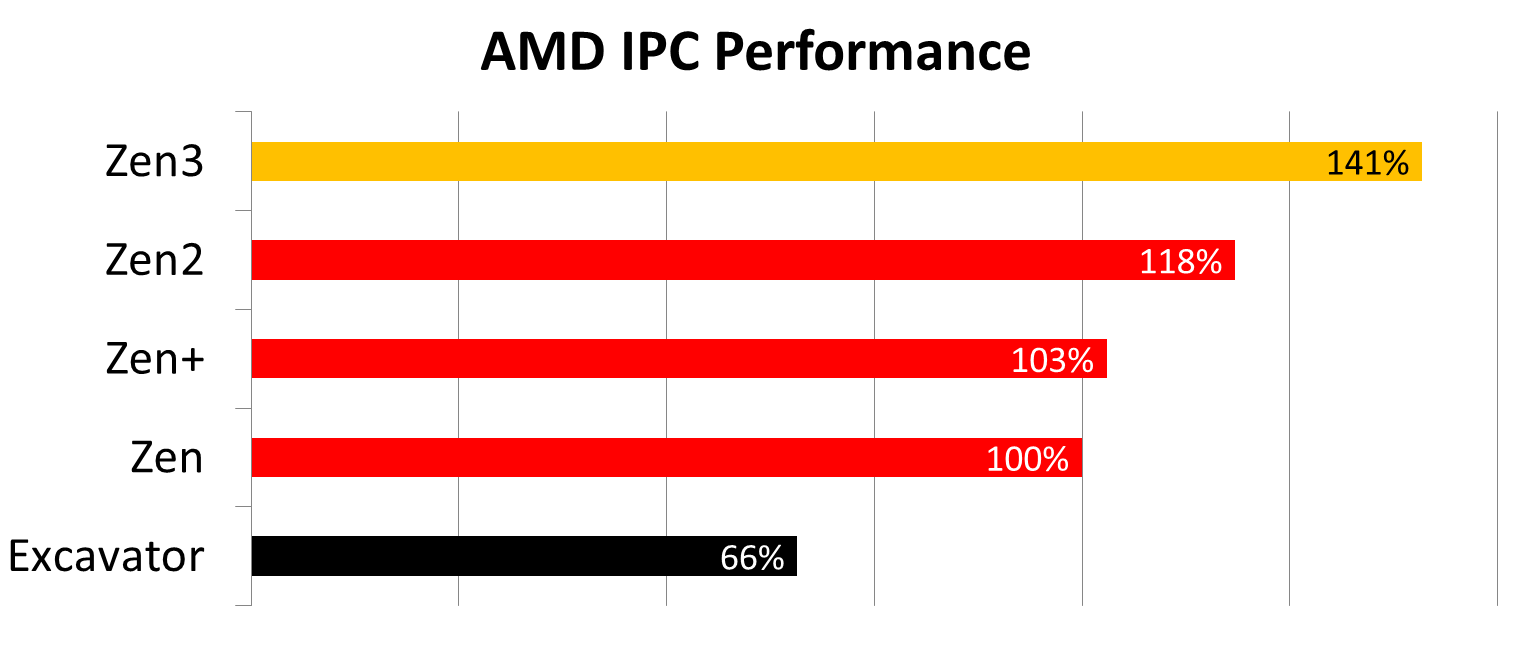
Compounding the generation-on-generation gains from a pre-Ryzen era, we’re seeing +114% IPC improvements, and if we look from the original Zen to Zen3, it is a ~41% gain.
In real world benchmarks, we saw an average +24% performance gain, showcasing both the increase in IPC and frequency uplift that the Ryzen 5000 parts have.
5.0 GHz Achieved on Ryzen
Turbo frequencies are often setup dependent, and because AMD uses a combination of listed turbo frequency and opportunistic boosting, the exact turbo frequency can be hard to nail down. For the top-tier Ryzen 9 5950X, AMD lists the turbo frequency as 4900 MHz for single core loading, however in very standard conditions, we were able to pass that to 5050 MHz. Diving deeper into the AGESA, this processor actually has a ‘maximum frequency’ setting of 5025 MHz. All of our Ryzen 5000 series processors offered +50-150 MHz above the listed turbo showcasing that these parts still have some headroom.
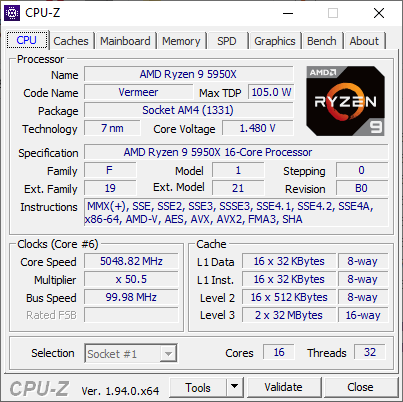
As we note in the review, AMD could have listed a 5 GHz turbo frequency, and it would be a big win for the company. However, I feel the company (a) wants to focus more on the market leading performance and engineering which doesn’t need 5 GHz, and (b) if they listed 5 GHz, it would suddenly be the only messaging people would take from the product launch. By not listing an explicit 5 GHz, it also allows AMD room to maneuver for a future product.
New WRs in Cinebench 1T, Breaking 10K in nT
AMD currently loves presenting CineBench as a measure of performance (Intel seems to flip/flop on the issue, depending on its position), and one of the main launch announcements was breaking the 600 point barrier in single threaded performance. At the time, it stated that the top three parts could get this value, whereas the Ryzen 5 5600X was just slightly behind.
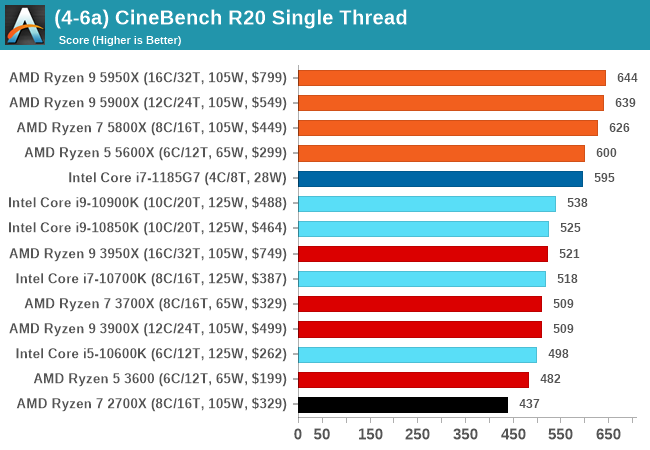
In our testing, we scored at least 600 on all processors. This is significant as Intel’s latest Tiger Lake processors, turbo-ing at 4.8 GHz with as much power as they can use, only scored 595. Users that want a Tiger Lake can’t find one in a desktop, whereas the base Ryzen 5 5600X is $300.
Another win worth mentioning here though not explicitly announced by AMD is breaking the 10000 point barrier with the Ryzen 9 5950X in the multithreaded test. We achieved it just by the skin of our teeth, and a good few hundred points above AMD’s ‘reviewer guide’ that accompanies every launch. The only other CPUs to get above this value are 205 W Xeons or Threadrippers, while AMD does it within the 142 W peak power window.
Gaming: Cache is Good, But Depends on the Title
Performance in gaming is always a bit harder to pin down performance numbers, depending on the titles, resolutions, graphics card used, memory and drivers. AMD came into Zen3 showcasing a +5-50% gain at 1080p High over Zen2 across a number of titles, averaging 20-25%, along with performance leadership comparing against Intel’s best performer.
We don’t test at 1080p High, however we do have two metrics worth comparing. We run our games with an RTX 2080 Ti.
At the purely CPU-limited scenario, at the lowest resolutions and the lowest quality, we saw a +44% average uplift going from Zen2 to Zen3, from +10% on the low end to +80% on the high-end.
At 1080p Maximum, we saw a +10% average uplift going from Zen2 to Zen3. This varied from benchmarks where the results were equal due to being GPU-limited, to some modest +36% gains in more CPU-limited tests.
When we compare AMD against Intel, AMD easily wins the CPU-limited lowest resolution tests from +2% to +52%, averaging around +21% higher FPS. In the 1080p Maximum however, AMD and Intel trade blows, swaying from -4% to +6% for AMD (except in our Civ6 test, which is a +43% win for AMD).
As we saw in our recent Broadwell re-review, having access to large amounts of lower latency cache seems to be a good way to increasing gaming performance. By moving from each core having access to 16 MB to 32 MB, along with raw IPC gains, AMD is showing some good uplift. On the competitive front, we’re seeing a more even battlefield between Intel and AMD as the settings are cranked up.
Overall Impressions of Zen 3 and Ryzen 5000
One of the exciting things about probing a new core is finding out all the little quirks and improvements that they don’t tell you about. It’s been interesting finding out how this core was put together, both from our findings and discussions AMD’s engineers.
Moving to an 8-core CCX for this generation was a no-brainer, with an easy up-tick in performance. However it is the changes in the execution units and load/store were a lot of the magic happens – increasing to peak 3 loads/cycle and 2 stores/cycle, splitting out some of the ALU/AGU work, finer grained transitions from decoder/op-cache to the micro-op queue, and pre-fetchers with more bandwidth all help to that. A lot of the instruction improvements, such as lower latency FMA and faster DIV/IDIV is going to scale well as we move into the enterprise and EPYC processors.
With AMD taking the performance crown in almost area it’s competing in, attention now comes to price. Having $300 as an entry level for this tier is going to sting a lot of users who would rather spend $200 or less – despite AMD having nine out of ten of Amazon’s best sellers, only two of those parts are $300 and up. There’s going to be an early adopters tax as well – one could argue that moving into Q1, when AMD is enabling 400-series motherboards, might be a better inception point for a lot of users.
Having said that, with Intel set to launch Rocket Lake at the end of Q1 next year with 8 cores, this sub-$300 market is going to be ripe for any AMD Zen3 APU to come in and take that price bracket. AMD never launched Zen2 APUs into the consumer market, which might indicate a fast follow-on with Zen3. Watch this space – a monolithic Zen3 APU is going to be exciting.
| AMD Ryzen 5000 Series Processors Zen 3 Microarchitecture |
||||||
| AnandTech | Cores Threads |
Base Freq |
Turbo Freq |
L3 Cache |
TDP | MSRP |
| Ryzen 9 5950X | 16c/32t | 3400 | 4900 | 64 MB | 105 W | $799 |
| Ryzen 9 5900X | 12c/24t | 3700 | 4800 | 64 MB | 105 W | $549 |
| Ryzen 7 5800X | 8c/16t | 3800 | 4700 | 32 MB | 105 W | $449 |
| Ryzen 5 5600X | 6c/12t | 3700 | 4600 | 32 MB | 65 W | $299* |
All things considered, we’re really impressed with what AMD has achieved here. After the disillusionment of years of weaker generation-on-generation performance uplifts from the competition, AMD set a goal to beat the average ~7% IPC year-on-year gain. With +19% IPC on Zen3, Intel has no equal right now - not even Tiger Lake at 4.8 GHz - and has lost that single-threaded crown.

Zen3 gets a gold award. No question.


339 Comments
View All Comments