AMD Zen 3 Ryzen Deep Dive Review: 5950X, 5900X, 5800X and 5600X Tested
by Dr. Ian Cutress on November 5, 2020 9:01 AM ESTSection by Andrei Frumusanu
Core-to-Core Latency
As the core count of modern CPUs is growing, we are reaching a time when the time to access each core from a different core is no longer a constant. Even before the advent of heterogeneous SoC designs, processors built on large rings or meshes can have different latencies to access the nearest core compared to the furthest core. This rings true especially in multi-socket server environments.
But modern CPUs, even desktop and consumer CPUs, can have variable access latency to get to another core. For example, in the first generation Threadripper CPUs, we had four chips on the package, each with 8 threads, and each with a different core-to-core latency depending on if it was on-die or off-die. This gets more complex with products like Lakefield, which has two different communication buses depending on which core is talking to which.
If you are a regular reader of AnandTech’s CPU reviews, you will recognize our Core-to-Core latency test. It’s a great way to show exactly how groups of cores are laid out on the silicon. This is a custom in-house test, and we know there are competing tests out there, but we feel ours is the most accurate to how quick an access between two cores can happen.
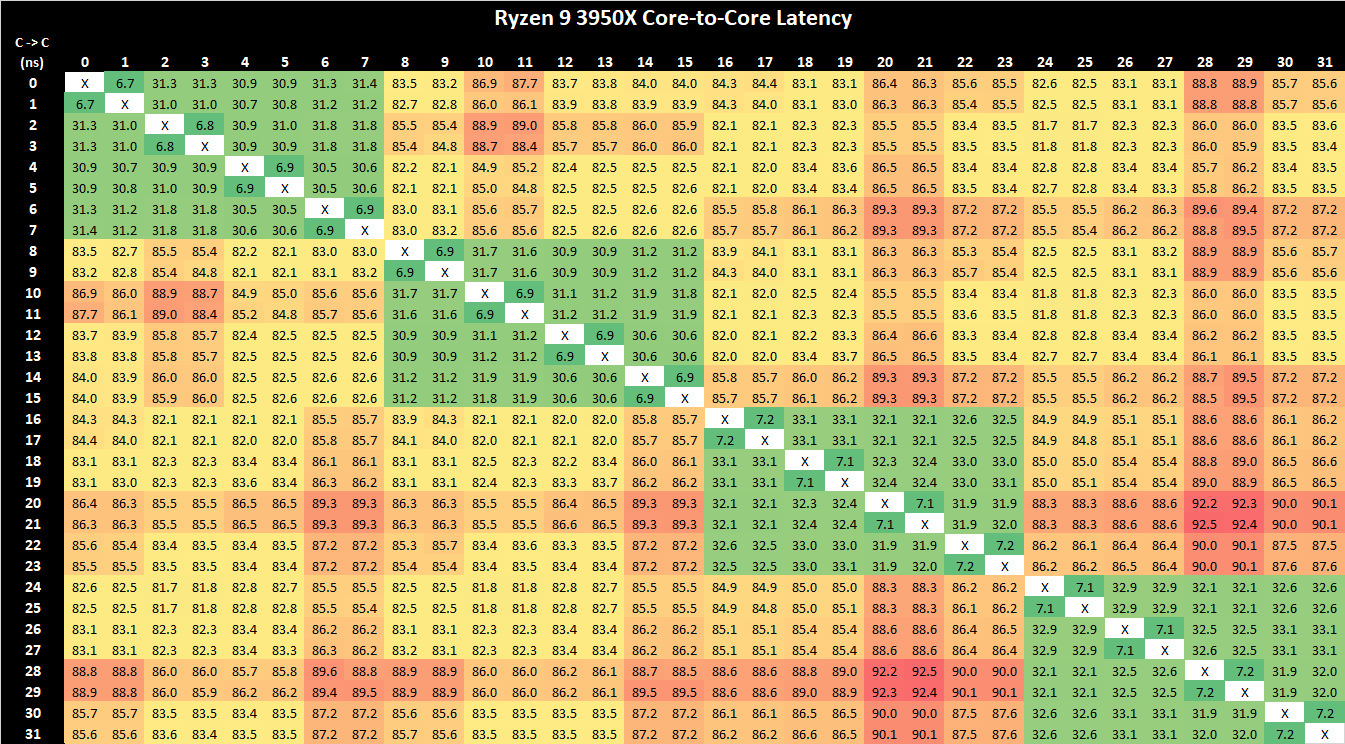
We had noted some differences in the core-to-core latency behaviour of various Zen2 CPUs depending on which motherboard and which AGESA version was tested at the time. For example, in this current version we’re seeing inter-core latencies within the L3 caches of the CCX’s falling in at around 30-31ns, however in the past we had measured on the same CPU figures in the 17ns range. We had measured a similar figure on our Zen2 Renoir tests, so it’s all the more odd to now get a 31ns figure on the 3950X while on a different motherboard. We had reached out to AMD about this odd discrepancy but never really got a proper response as to what exactly is happening here – it’s after all the same CPU and even the same test binary, just differing motherboard platforms and AGESA versions.
Nevertheless, in the result we can clearly see the low-latencies of the four CCXs, with inter-core latencies between CPUs of differing CCXs suffering to a greater degree in the 82ns range, which remains one of the key disadvantages of AMD’s core complex and chiplet architecture.
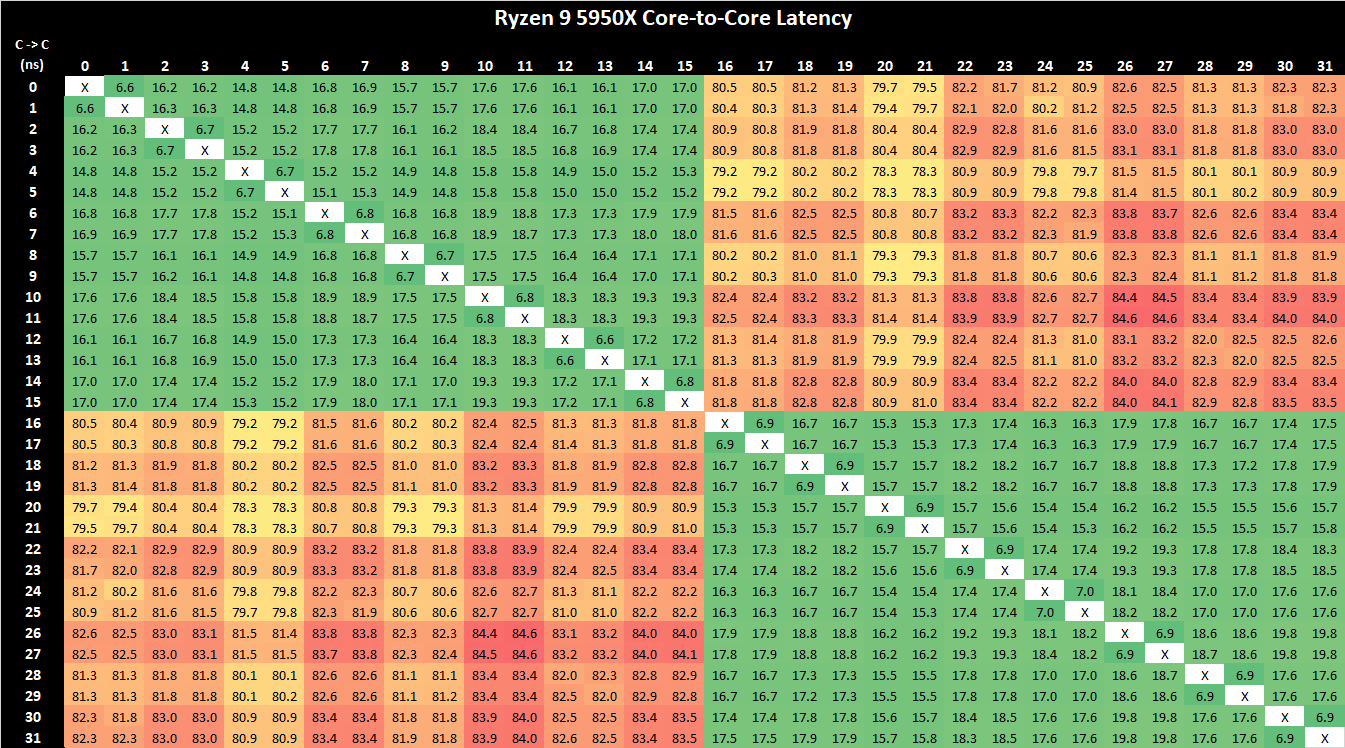
On the new Zen3-based Ryzen 9 5950X, what immediately is obvious is that instead of four low-latency CPU clusters, there are now only two of them. This corresponds to AMD’s switch from four CCX’s for their 16-core predecessor, to only two such units on the new part, with the new CCX basically being the whole CCD this time around.
Inter-core latencies within the L3 lie in at 15-19ns, depending on the core pair. One aspect affecting the figures here are also the boost frequencies of that the core pairs can reach as we’re not fixing the chip to a set frequency. This is a large improvement in terms of latency over the 3950X, but given that in some firmware combinations, as well as on AMD’s Renoir mobile chip this is the expected normal latency behaviour, it doesn’t look that the new Zen3 part improves much in that regard, other than obviously of course enabling this latency over a greater pool of 8 cores within the CCD.
Inter-core latencies between cores in different CCDs still incurs a larger latency penalty of 79-80ns, which is somewhat to be expected as the new Ryzen 5000 parts don’t change the IOD design compared to the predecessor, and traffic would still have to go through the infinity fabric on it.
For workloads which are synchronisation heavy and are multi-threaded up to 8 primary threads, this is a great win for the new Zen3 CCD and L3 design. AMD’s new L3 complex in fact now offers better inter-core latencies and a flatter topology than Intel’s ring-based consumer designs, with SKUs such as the 10900K varying between 16.5-23ns inter-core latency. AMD still has a way to go to reduce inter-CCD latency, but maybe that something to address in the next generation design.
Cache and Memory Latency
As Zen3 makes some big changes in the memory cache hierarchy department, we’re also expecting this to materialise in quite different behaviour in our cache and memory latency tests. On paper, the L1D and L2 caches on Zen3 shouldn’t see any differences when compared to Zen2 as both share the same size and cycle latencies – however we did point out in our microarchitecture deep dive that AMD did make some changes to the behaviour here due to the prefetchers as well as cache replacement policy.
On the L3 side, we expect a large shift of the latency curve into deeper memory regions given that a single core now has access to the full 32MB, double that of the previous generation. Deeper into DRAM, AMD actually hasn’t talked much at all about how memory latency would be affected by the new microarchitecture – we don’t expect large changes here due to the fact that the new chips are reusing the same I/O die with the same memory controllers and infinity fabric. Any latency effects here should be solely due to the microarchitectural changes made on the actual CPUs and the core-complex die.
Starting off in the L1D region of the new Zen3 5950X top CPU, we’re seeing access latencies of 0.792ns which corresponds to a 4-cycle access at exactly 5050MHz, which is the maximum frequency at which this new part boosts to in single-threaded workloads.
Entering the L2 region, we however are already starting to see some very different microarchitectural behaviour on the part of the latency tests as they look nothing like we’ve seen on Zen2 and prior generations.
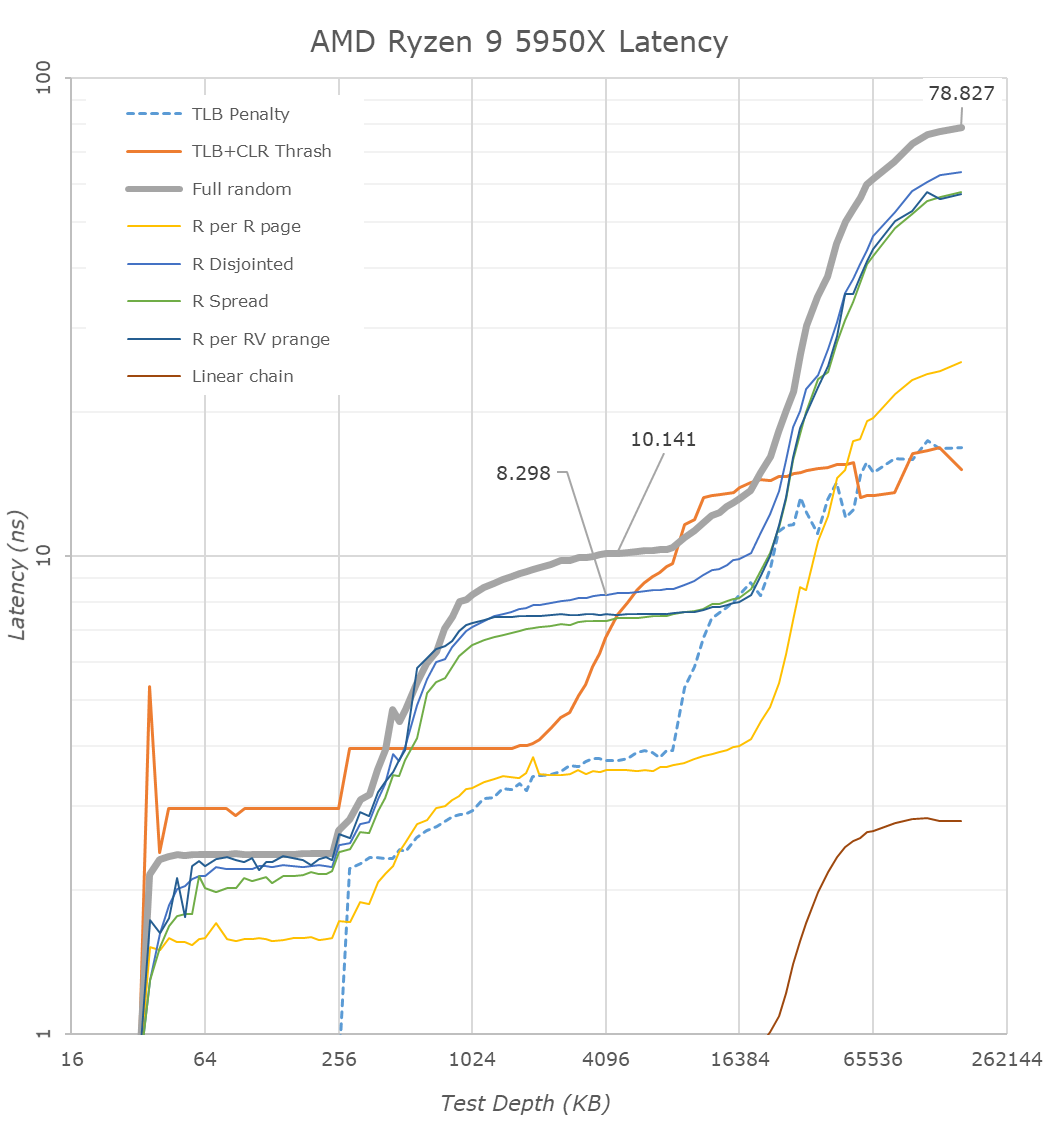
Starting off with the most basic access pattern, a simple linear chain within the address space, we’re seeing access latencies improve from an average of 5.33 cycles on Zen2 to +-4.25 cycles on Zen3, meaning that this generation’s adjacent-line prefetchers are much more aggressive in pulling data into the L1D. This is actually now even more aggressive than Intel’s cores, which have an average access latency of 5.11 cycles for the same pattern within their L2 region.
Besides the simple linear chain, we also see very different behaviour in a lot of the other patterns, some of our other more abstract patterns aren’t getting prefetched as aggressively as on Zen2, more on that later. More interestingly is the behaviour of the full random access and the TLB+CLR trash pattern which are now completely different: The full random curve is now a lot more abrupt on the L1 to L2 boundary, and we’re seeing the TLB+CLR having an odd (reproducible) spike here as well. The TLB+CLR pattern goes through random pages always hitting only a single, but every time different cache line within each page, forcing a TLB read (or miss) as well as a cache line replacement.
The fact that this test now behaves completely different throughout the L2 to L3 and DRAM compared to Zen2 means that AMD is now employing a very different cache line replacement policy on Zen3. The test’s curve in the L3 no longer actually matching the cache’s size means that AMD is now optimising the replacement policy to reorder/move around cache lines within the sets to reduce unneeded replacements within the cache hierarchies. In this case it’s a very interesting behaviour that we hadn’t seen to this degree in any microarchitecture and basically breaks our TLB+CLR test which we previously relied on for estimating the physical structural latencies of the designs.
It’s this new cache replacement policy which I think is cause for the more smoothed out curves when transitioning between the L2 and L3 caches as well as from the L3 to DRAM – the latter behaviour which now looks closer to what Intel and some other competing microarchitectures have recently exhibited.
Within the L3, things are a bit difficult to measure as there’s now several different effects at play. The prefetchers on Zen3 don’t seem to be as aggressive on some of our patterns which is why the latency here has gone up more a little bit more of a notable amount – we can’t really use them for apples-to-apples comparisons to Zen2 because they’re no longer doing the same thing. Our CLR+TLB test also not working as intended means that we’ll have to resort to full random figures; the new Zen3 cache at 4MB depth here measured in at 10.127ns on the 5950X, compared to 9.237ns on the 3950X. Translating this into cycles corresponds to a regression from 42.9 cycles to 51.1 cycles on average, or basically +8 cycles. AMD’s official figures here are 39 cycles and 46 cycles for Zen2 and Zen3, a +7-cycle regression – in line with what we measure, accounting for TLB effects.
Latencies past 8MB still go up even though the L3 is 32MB deep, and that’s simply because it exceeds the L2 TLB capacity of 2K pages with a 4K page size.
In the DRAM region, we’re measuring 78.8ns on the 5950X versus 86.0ns on the 3950X. Converting this into cycles actually ends up with an identical 398 cycles for both chips at 160MB full random-access depth. We have to note that because of that change in the cache line replacement policy that latencies appear to be better for the new Zen3 chip at test depths between 32-128MB, but that’s just a measurement side-effect and does not seem to be an actual representation of the physical and structural latency of the new chip. You’d have to test deeper DRAM regions to get accurate figures – all of which makes sense given that the new Ryzen 5000 chips are using the same I/O die and memory controllers, and we’re testing identical memory at the same 3200MHz speed.
Overall, although Zen3 doesn’t change dramatically in its cache structure beyond the doubled up and slightly slower L3, the actual cache behaviour between microarchitecture generations has changed quite a lot for AMD. The new Zen3 design seems to make much smarter use of prefetching as well as cache line handling – some of whose performance effects could easily overshadow just the L3 increase. We inquired AMD’s Mike Clarke about some of these new mechanisms, but the company wouldn’t comment on some of the new technologies that they would rather keep closer to their chest for the time being.
Frequency Ramping
Both AMD and Intel over the past few years have introduced features to their processors that speed up the time from when a CPU moves from idle into a high powered state. The effect of this means that users can get peak performance quicker, but the biggest knock-on effect for this is with battery life in mobile devices, especially if a system can turbo up quick and turbo down quick, ensuring that it stays in the lowest and most efficient power state for as long as possible.
Intel’s technology is called SpeedShift, although SpeedShift was not enabled until Skylake.
One of the issues though with this technology is that sometimes the adjustments in frequency can be so fast, software cannot detect them. If the frequency is changing on the order of microseconds, but your software is only probing frequency in milliseconds (or seconds), then quick changes will be missed. Not only that, as an observer probing the frequency, you could be affecting the actual turbo performance. When the CPU is changing frequency, it essentially has to pause all compute while it aligns the frequency rate of the whole core.
We wrote an extensive review analysis piece on this, called ‘Reaching for Turbo: Aligning Perception with AMD’s Frequency Metrics’, due to an issue where users were not observing the peak turbo speeds for AMD’s processors.
We got around the issue by making the frequency probing the workload causing the turbo. The software is able to detect frequency adjustments on a microsecond scale, so we can see how well a system can get to those boost frequencies. Our Frequency Ramp tool has already been in use in a number of reviews.
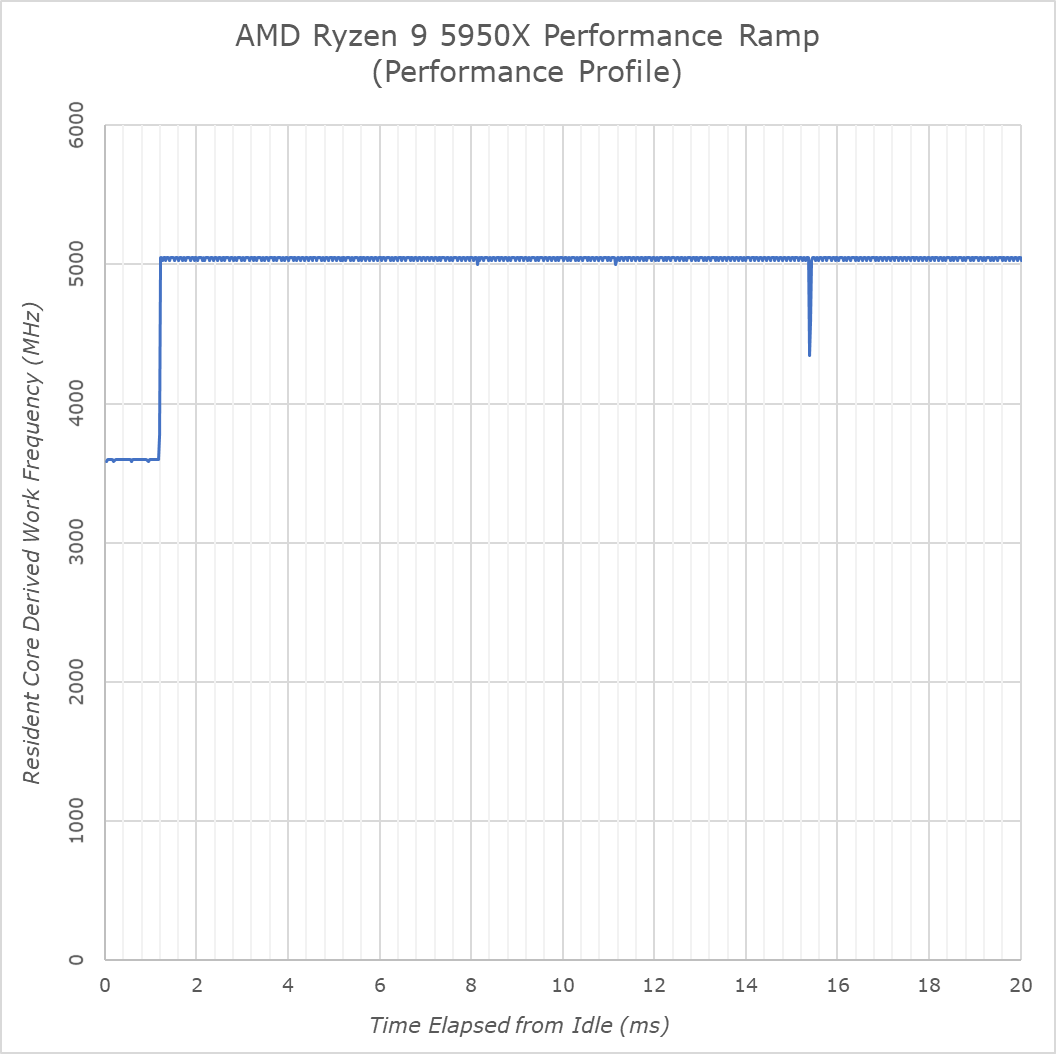
On the performance profile, the new 5950X looks to behave identical to the Ryzen 3000 series, ramping up to maximum frequency in 1.2ms. On the balanced profile, this is at 18ms to avoid needlessly upping the frequency from idle during sporadic background tasks.
Idle frequency on the new CPU lands in at 3597MHz and the Zen3 CPU here will boost up to 5050MHz on single-threaded workloads. In our test tool it actually reads out fluctuations between 5025 and 5050MHz, however that just seems to be an aliasing issue due to the timer resolution being 100ns and us measuring 20µs workload chunks. The real frequency as per base-clock and multiplier looks to be 5048.82MHz on this particular motherboard.


339 Comments
View All Comments
Jvanderlinde - Saturday, November 7, 2020 - link
Glad to read the 2700x is taken into account. The 5950X seems like a hell of an upgrade coming from that path. Gotta love AMD for what it's bin accomplishing in the last few years.Kallan007 - Saturday, November 7, 2020 - link
I just want to thank AMD for a lovely way to end 2020! I cannot wait for those AMD 6000 series card reviews! Good job as always AnandTech!Pumpkinhead - Saturday, November 7, 2020 - link
How is that possible that peak power for the 3700x having 8 cores is lower than for 3600 with 6 cores?nandnandnand - Saturday, November 7, 2020 - link
"Compared to other processors, for peak power, we report the highest loaded value observed from any of our benchmark tests."They selected the highest single wattage value from ANY of their tests. So at the same TDP, they should be very close to each other. I guess the point is to find the worst case scenario for each processor, rather than an average, to determine the power supply needed. Other reviews point to 3600 using less power on average:
https://www.tomshardware.com/reviews/amd-ryzen-5-3...
Pumpkinhead - Saturday, November 7, 2020 - link
>https://www.tomshardware.com/reviews/amd-ryzen-5-3...Interesting that 3700x being 1/3 faster in handbrake still draws only 13% more power, I always thought that in parallel workloads it power consumption scales linearly as you add more cores.
Even tho in AIDA stress test it draws 35% more power so peak consumption is different too, also look at the 5800x - draws almost twice as 5600x (also 6c vs 8c)
Kjella - Sunday, November 8, 2020 - link
It scales linearly until you hit the TDP, past that more cores lets you use a lower, more efficient frequency. As long as you can keep all cores loaded 8 cores on a 10W/core power budget will get less done than 16 cores at a 5W/core power budget even though 8*10 = 16*5. But with disabled cores you might have to run more of the chip, like the whole CCX to support 3 of 4 working cores. That will obviously be less efficient since the "overhead" has to be split by 3 instead of 4.Murilo - Saturday, November 7, 2020 - link
..and AMD price? ahahah.I want price!
psyclist80 - Saturday, November 7, 2020 - link
Im glad you guys added in Tiger Lake...very important data point. If it beat willow cove in its full implementation then its certainly going to beat the watered down 14nm version cypress cove and slay it on power efficiency.Im glad AMD has taken the crown back (last held 2003-2006)...as has been said in the past, the Empire will strike back...Hopefully Golden Cove can do that for Intel. That will face 5nm Zen 4 though...AMD looking strong for the next year or two!
Sushisamurai - Sunday, November 8, 2020 - link
apparently, looking at other reviews, there appears to be a performance uplift/downgrade (depends how you look at it) with the number of RAM sticks populated on the board (2 vs 4). I wonder how much of a difference it is with RAM speeds and memory stick population on the 5000 series.umano - Sunday, November 8, 2020 - link
I bought in june a 3800x and an x570 creator planning to upgrade to 5950x after zen 4 launches, but often, when we have more power, we find a way to crave for more. I work in fashion ph, for me the 35% bump in ps compared to my 3800x (bought because the price was the same as 3700) is a no brainer. It will also help me in capture one exports and zip compression. I did not think an upgrade so soon will benefit me so much, but you know life happens. Good job amd you made technology fun again