The Samsung 870 QVO (1TB & 4TB) SSD Review: QLC Refreshed
by Billy Tallis on June 30, 2020 11:40 AM ESTMixed IO Performance
Our tests of mixed read/write IO vary the workload from pure reads to pure writes at 10% increments. Each mix is tested for up to 1 minute or 32GB of data transferred. The mixed random IO test uses a queue depth of 4 while the mixed sequential IO test uses a queue depth of 1. The tests are confined to a 64GB span of the drive, and the drive is given up to one minute of idle time in between each mix tested.
 |
|||||||||
| Mixed Random IO | Mixed Sequential IO | ||||||||
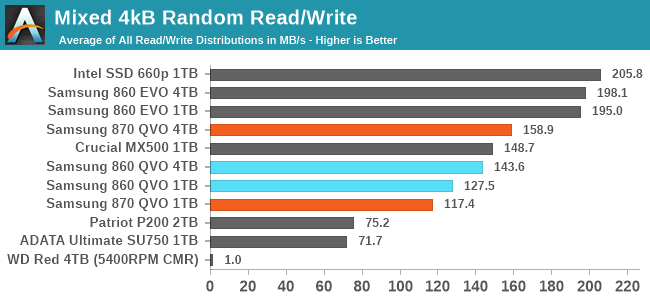
The Samsung 870 QVO brings improved mixed sequential IO performance: a big boost to the 1TB model and a small increment for the 4TB. For mixed random IO, the 4TB model also gets a decent improvement, but the 1TB 870 QVO's performance is a clear regression. However, even with that regression the 870 QVO still performs far better on mixed random IO than the DRAMless SSDs.
 |
|||||||||
| Mixed Random IO | Mixed Sequential IO | ||||||||
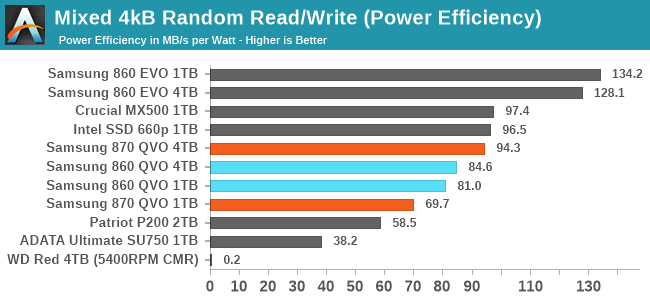
Power efficiency scores for the mixed random IO test generally follow the same pattern as the raw performance scores, but the DRAMless SSDs aren't as far behind the QLC and mainstream TLC drives. Over on the sequential IO side, most of the Samsung SATA drives had similar overall performance, but they still have fairly substantial power efficiency differences. The 870 QVO significantly improves power efficiency on the mixed sequential IO test compared to its predecessor, and has almost caught up to the TLC-based 860 EVO.
 |
|||||||||
| Mixed Random IO | |||||||||
| Mixed Sequential IO | |||||||||
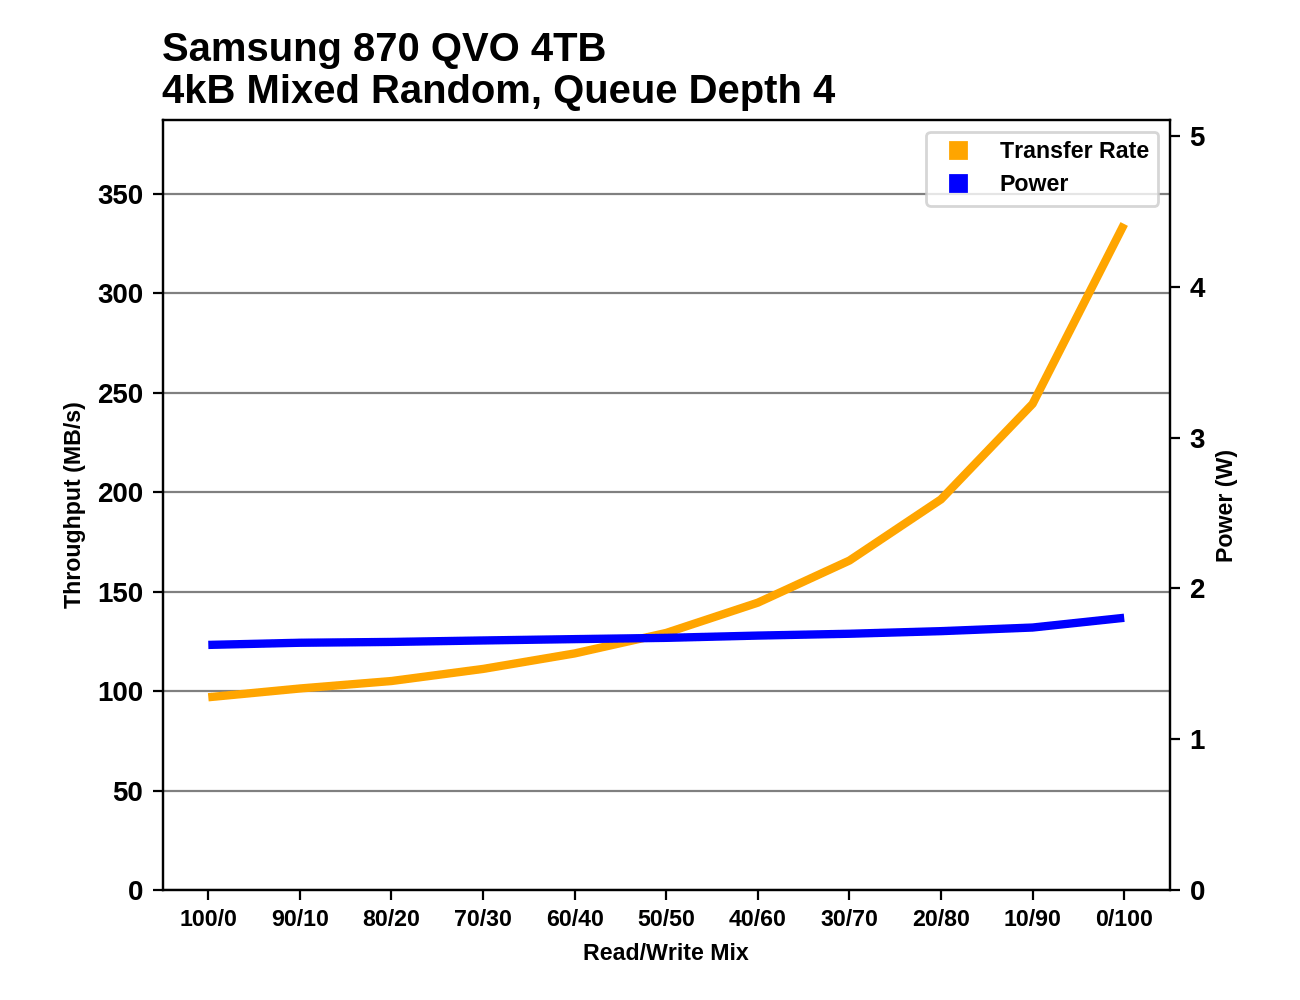
On the mixed random IO test, the 870 QVOs show clear improvement on the more read-heavy half of the test. As the workload continues to get more write-heavy, the 4TB 870 loses its lead over the 4TB 860, and the 1TB 870 hits a performance wall when it runs out of cache where the 1TB 860 QVO had no trouble.
During the mixed sequential IO test, the Samsung SATA drives all show broadly similar performance across the range of workloads, all bottoming out near a 30% read/70% write mix. The outlier was the 1TB 860 QVO which had substantially worse performance across most of the test, including a much lower worst-case performance. The 1TB 870 QVO shows drastic improvement over its predecessor.
Idle Power Measurement
SATA SSDs are tested with SATA link power management disabled to measure their active idle power draw, and with it enabled for the deeper idle power consumption score and the idle wake-up latency test. Our testbed, like any ordinary desktop system, cannot trigger the deepest DevSleep idle state.
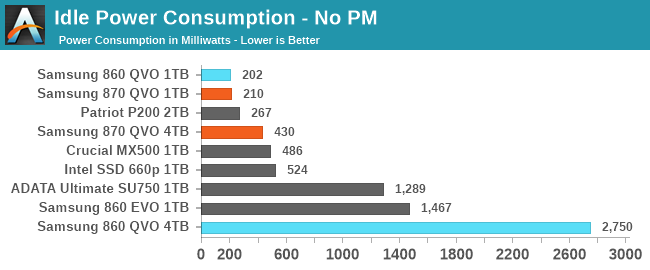
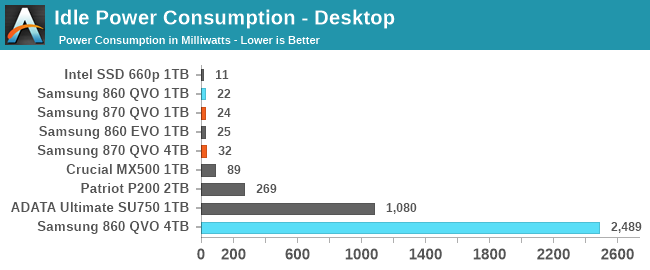
The big obvious difference in the power measurements here between the 870 QVO and its predecessor is for the 4TB model. When we tested the 4TB 860 QVO, SATA link power management did work, but the drive itself never went to sleep because it was busy with background garbage collection work the entire time our testbed was trying to measure its idle power. The 4TB 870 QVO finished its cleanup work in the time allotted by this test and was truly idle during the measurements.
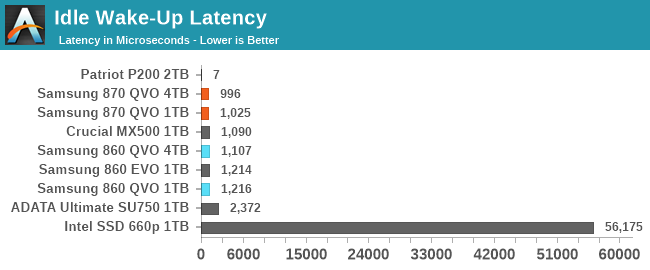
Idle wake-up performance is unsurprisingly quite similar for the various Samsung SATA SSDs, and the Crucial MX500 also takes about a millisecond to wake up from sleep. The two DRAMless SSDs show how budget drives often have broken power management, either by not sleeping at all (leading to near-instant wake-up), or by taking a bit long to wake up despite the sleep state still drawing quite a bit of power. And then there's the NVMe SSD which has a remarkably long wake-up time from this particular sleep state, but it was also drawing less power than the SATA drives in the slumber state.


64 Comments
View All Comments
Guspaz - Tuesday, June 30, 2020 - link
I bought a 2TB TLC Phison drive for a lower price than Samsung wants for their 2TB QLC drive. They're a ripoff.Guspaz - Tuesday, June 30, 2020 - link
Clarification: my 2TB TLC NVMe drive costs less than Samsung's 2TB QLC SATA drive.ddhelmet - Wednesday, July 1, 2020 - link
If you wanted an SSD just to put games, isn't 870 QVO identical in perfomance (loading speed) to 860 EVO?flowingbass - Wednesday, July 1, 2020 - link
Looks like these are good for use as game installation drives where capacity is good and random performance still better than hard drives. But price needs to be cheaperisthisavailable - Wednesday, July 1, 2020 - link
I disagree. What about when you decide to move games for example 90 GB GTA 5 folder and your write speeds drop to 80 MB/s?NoSoMo - Wednesday, July 1, 2020 - link
You're just better off buying a non-QLC SSD period --- These drive make no sense for anyone that knows better.StrangerGuy - Wednesday, July 1, 2020 - link
Yeah, I mean just how much brain damaged one can be to think buying any Samsung QVO over cheaper and faster TLC drives would be a good idea?chrysrobyn - Wednesday, July 1, 2020 - link
It's great to see a spinning hard drive in the benchmark comparisons. Puts a lot of them into perspective.Alim345 - Wednesday, July 1, 2020 - link
WD black 1tb was recently available for 130$, Intel's 660p nvme ssd is faster and cheaper than those Samsung drives. Who would buy those ssds? If qlc drives get substantially cheaper they might become viable for game storage needs.Oxford Guy - Wednesday, July 1, 2020 - link
QLC is garbage.Lipstick on a pig won't make me kiss one.