The Samsung 870 QVO (1TB & 4TB) SSD Review: QLC Refreshed
by Billy Tallis on June 30, 2020 11:40 AM ESTAnandTech Storage Bench - The Destroyer
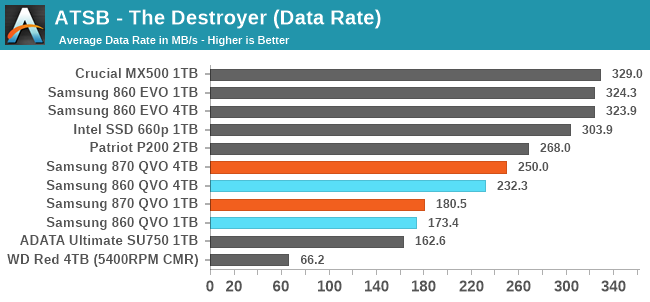
The Destroyer is an extremely long test replicating the access patterns of very IO-intensive desktop usage. A detailed breakdown can be found in this article. Like real-world usage, the drives do get the occasional break that allows for some background garbage collection and flushing caches, but those idle times are limited to 25ms so that it doesn't take all week to run the test. These AnandTech Storage Bench (ATSB) tests do not involve running the actual applications that generated the workloads, so the scores are relatively insensitive to changes in CPU performance and RAM from our new testbed, but the jump to a newer version of Windows and the newer storage drivers can have an impact.
We quantify performance on this test by reporting the drive's average data throughput, the average latency of the I/O operations, and the total energy used by the drive over the course of the test.
 |
|||||||||
| Average Data Rate | |||||||||
| Average Latency | Average Read Latency | Average Write Latency | |||||||
| 99th Percentile Latency | 99th Percentile Read Latency | 99th Percentile Write Latency | |||||||
| Energy Usage | |||||||||
The second-generation Samsung QLC drives offer slight performance increases over their predecessors on The Destroyer, but it's not enough to significantly change how a QVO rates against drives in other market segments. The 870 QVO is still trading wins against DRAMless SATA drives with TLC NAND, and clearly well behind the Intel QLC NVMe drive and the mainstream TLC SATA drives.
In general, the latency scores from the Samsung QVO drives are worse than from the DRAMless TLC drives, while the 4TB QVOs still have better overall throughput. The 1TB QVOs (both old and new) are prone to write latencies that are worse than the 5400RPM hard drive. Both capacities of the 870 QVO have worse read latency but better write latency scores than the 860 QVO.
Energy usage is a mixed bag. The 4TB 870 QVO is a slight improvement over its predecessor while the 1TB is a slight step backward. All of the QLC drives require substantially more energy to complete The Destroyer than mainstream TLC drives, and one of the DRAMless TLC drives comes out wa
AnandTech Storage Bench - Heavy
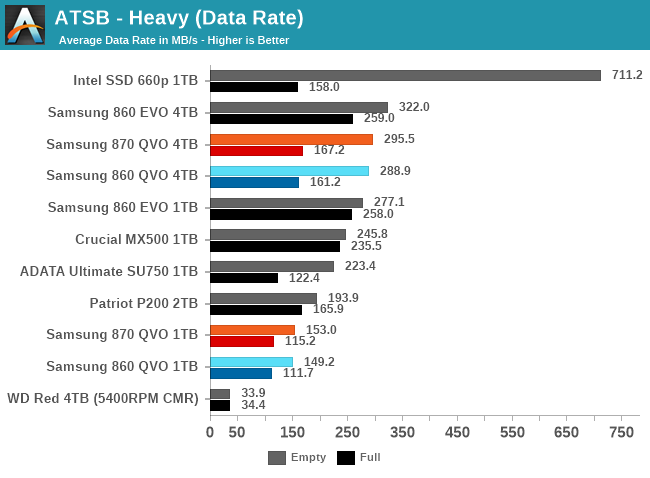
Our Heavy storage benchmark is proportionally more write-heavy than The Destroyer, but much shorter overall. The total writes in the Heavy test aren't enough to fill the drive, so performance never drops down to steady state. This test is far more representative of a power user's day to day usage, and is heavily influenced by the drive's peak performance. The Heavy workload test details can be found here. This test is run twice, once on a freshly erased drive and once after filling the drive with sequential writes.
 |
|||||||||
| Average Data Rate | |||||||||
| Average Latency | Average Read Latency | Average Write Latency | |||||||
| 99th Percentile Latency | 99th Percentile Read Latency | 99th Percentile Write Latency | |||||||
| Energy Usage | |||||||||
The Heavy test is quite a bit shorter than The Destroyer, so the scores show more impact from the peak performance of SLC caching. The 4TB Samsung QVOs offer overall performance that is competitive with mainstream TLC SATA drives, when the test is run on an empty drive and they get to make use of their full SLC cache sizes. Those conditions also allow the Intel 660p to show off its NVMe performance, but the 1TB Samsung QVOs have the smallest SLC caches and worst post-cache performance, and this test is long enough for that to become a problem. When the drives are filled before running the test, all of the QLC models fall short of the mainstream TLC drives.
Performance has again changed very little from the 860 QVO to the 870 QVO. A few of the latency scores have regressed slightly, but not by enough to matter. Both capacities of the 870 QVO manage to outperform the hard drive on every performance metric; write latency comes close for the smaller, slower 870 QVO, but the read latency scores are all several times better than the hard drive can manage.
The 870 QVO still requires a lot more energy to complete the test than more high-end TLC-based drives. This mostly comes down to extra energy used as a result of the test taking longer, with write operations having the biggest impact. The 4TB QVO is again more efficient than the slower 1TB model.
AnandTech Storage Bench - Light
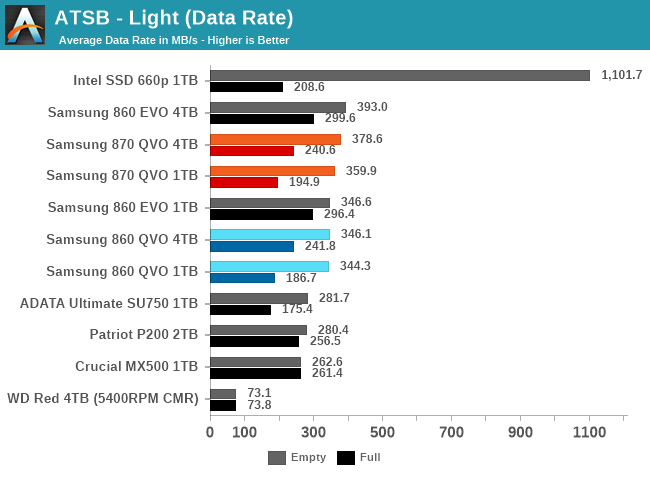
Our Light storage test has relatively more sequential accesses and lower queue depths than The Destroyer or the Heavy test, and it's by far the shortest test overall. It's based largely on applications that aren't highly dependent on storage performance, so this is a test more of application launch times and file load times. This test can be seen as the sum of all the little delays in daily usage, but with the idle times trimmed to 25ms it takes less than half an hour to run. Details of the Light test can be found here. As with the ATSB Heavy test, this test is run with the drive both freshly erased and empty, and after filling the drive with sequential writes.
 |
|||||||||
| Average Data Rate | |||||||||
| Average Latency | Average Read Latency | Average Write Latency | |||||||
| 99th Percentile Latency | 99th Percentile Read Latency | 99th Percentile Write Latency | |||||||
| Energy Usage | |||||||||
The Light test really highlights the benefits of putting a high-end SSD controller in an otherwise entry-level product. Samsung's controllers set the bar, and on lighter workloads like this test the QLC NAND doesn't drag the 870 QVO down to the level of non-Samsung SATA drives unless the test is run on a full drive. However, such a light workload also puts the NVMe competition in its best possible light where the Intel 660p is three times faster overall.
Latency does still spike for the full-drive test runs on the QLC drives, especially when looking at 99th percentile latencies. But unlike the Intel 660p, those spikes aren't bad enough to bring the worst-case latencies of the Samsung QVOs up to hard drive levels of lag.
Aside from the extra energy used by the QLC drives on the full-drive test runs, the energy usage differences between SSDs on this test are pretty minor, and the 870 QVO shows no meaningful change from the 860 QVO.


64 Comments
View All Comments
Guspaz - Tuesday, June 30, 2020 - link
I bought a 2TB TLC Phison drive for a lower price than Samsung wants for their 2TB QLC drive. They're a ripoff.Guspaz - Tuesday, June 30, 2020 - link
Clarification: my 2TB TLC NVMe drive costs less than Samsung's 2TB QLC SATA drive.ddhelmet - Wednesday, July 1, 2020 - link
If you wanted an SSD just to put games, isn't 870 QVO identical in perfomance (loading speed) to 860 EVO?flowingbass - Wednesday, July 1, 2020 - link
Looks like these are good for use as game installation drives where capacity is good and random performance still better than hard drives. But price needs to be cheaperisthisavailable - Wednesday, July 1, 2020 - link
I disagree. What about when you decide to move games for example 90 GB GTA 5 folder and your write speeds drop to 80 MB/s?NoSoMo - Wednesday, July 1, 2020 - link
You're just better off buying a non-QLC SSD period --- These drive make no sense for anyone that knows better.StrangerGuy - Wednesday, July 1, 2020 - link
Yeah, I mean just how much brain damaged one can be to think buying any Samsung QVO over cheaper and faster TLC drives would be a good idea?chrysrobyn - Wednesday, July 1, 2020 - link
It's great to see a spinning hard drive in the benchmark comparisons. Puts a lot of them into perspective.Alim345 - Wednesday, July 1, 2020 - link
WD black 1tb was recently available for 130$, Intel's 660p nvme ssd is faster and cheaper than those Samsung drives. Who would buy those ssds? If qlc drives get substantially cheaper they might become viable for game storage needs.Oxford Guy - Wednesday, July 1, 2020 - link
QLC is garbage.Lipstick on a pig won't make me kiss one.