AMD’s New EPYC 7F52 Reviewed: The F is for ᴴᴵᴳᴴ Frequency
by Dr. Ian Cutress on April 14, 2020 9:45 AM EST- Posted in
- CPUs
- AMD
- Enterprise
- Enterprise CPUs
- EPYC
- SP3r2
- CPU Frequency
- Rome
- 7Fx2
Frequency Ramp, Latency and Power
Frequency Ramp
One of the key items of a modern processor is its ability to go from an idle state up to a peak turbo state. For consumer workloads this is important for the responsiveness of a system, such as opening a program or interacting with a web page, but for the enterprise market it ends up being more relevant when each core can control its turbo, and we get situations with either multi-user instances or database accesses. For these systems, obviously saving power helps with the total cost of ownership, but being able to offer a low latency transaction in that system is often a key selling point.
For our 7F52 system, we measured a jump up to peak frequency within 16.2 milliseconds, which links in really well with the other AMD systems we have tested recently.
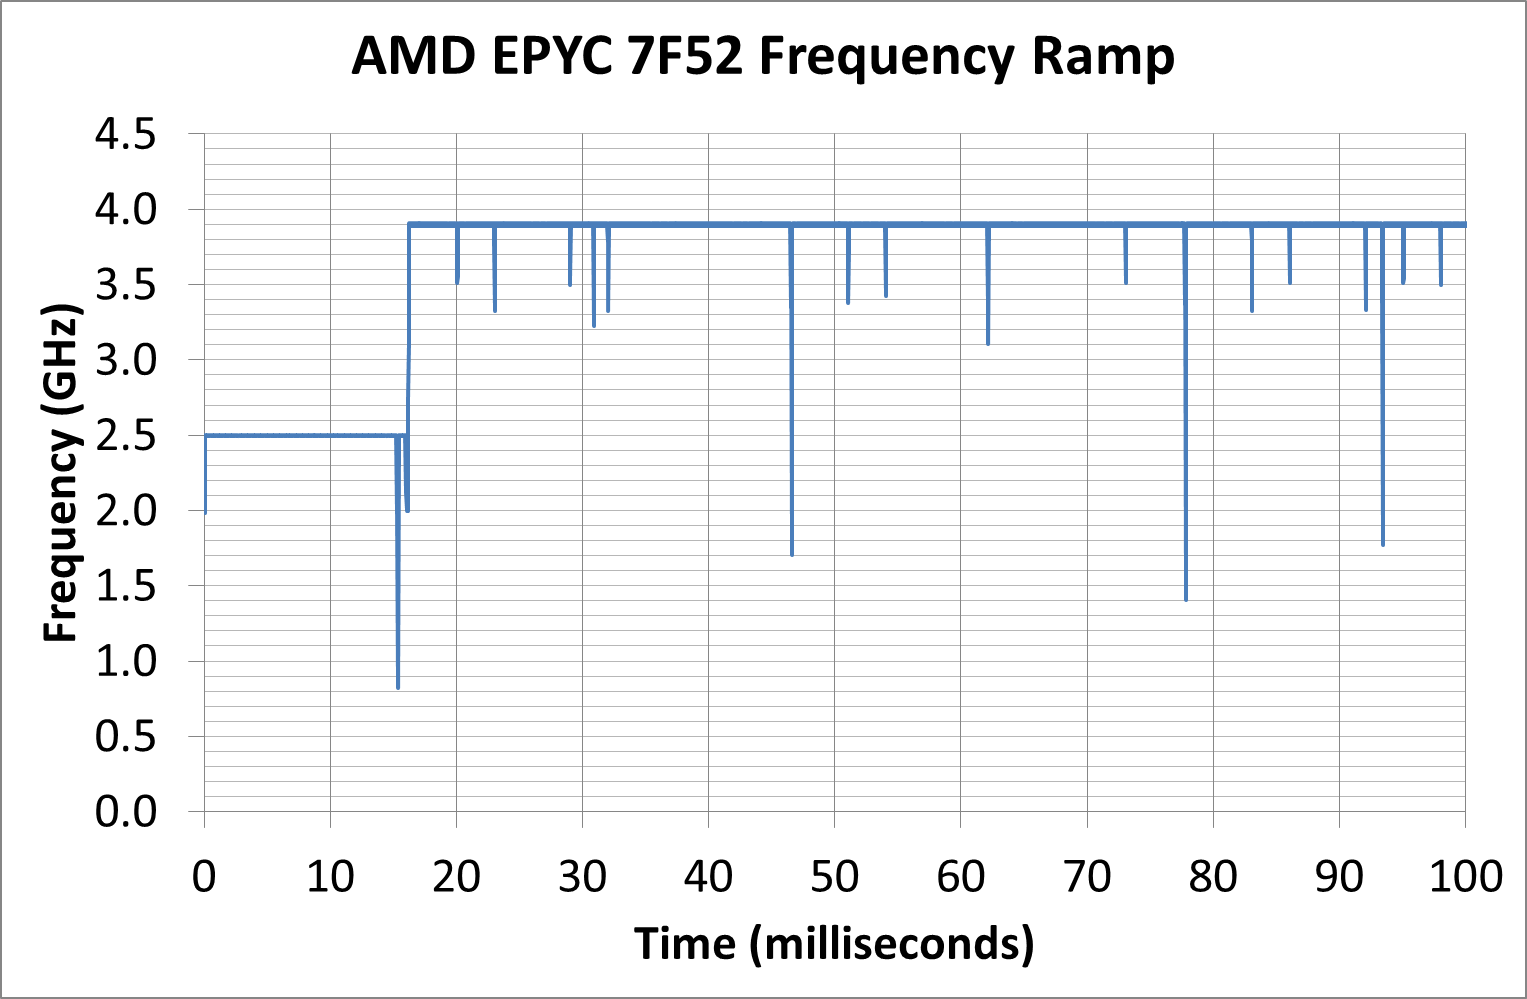
In a consumer system, normally we would point out that 16 milliseconds is the equivalent to a single frame on a 60 Hz display, although for enterprise it means that any transaction normally done within 16 milliseconds on the system is a very light workload that might not even kick up the turbo at all.
Cache Latency
As we’ve discussed in the past, the key element about Cache Latency on the AMD EPYC systems is the L3 cache – the way these cores are designed, with the quad-core core complexes, means that the only L3 each core can access is that within its own CCX. That means for every EPYC CPU, whether there is four cores per CCX enabled, or if there is only one core per CCX enabled, it only has access to 16 MB of L3. The fact that there is 256 MB across the whole chip is just a function of repeating units. As a result, we can get a cache latency graph of the following:

This structure mirrors up with what we’ve seen in AMD CPUs in the past. What we get here for the 7F52 is:
- 1.0 nanoseconds for L1 (4 clks) up to 32 KB
- 3.3 nanoseconds for L2 (13 clks) up to 256 KB,
- 4.8-5.6 nanoseconds (19-21 clks) at 256-512 KB (Accesses starting to miss the L1 TLB here)
- 12-14 nanoseconds (48-51 clks) from 1 MB to 8 MB inside the first half the CCX L3
- Up to 37 nanoseconds (60-143 clks) at 8-16 MB for the rest of the L3
- ~150 nanoseconds (580-600+ clks) from 16 MB+ moving into DRAM
Compared to one of our more recent tests, Ryzen Mobile, we see the bigger L3 cache structure but also going beyond the L3 into DRAM, due to the hop to the IO die and then out to the main memory there’s a sizeable increase in latency in accessing main memory. It means that for those 600 or so cycles, the core needs to be active doing other things. As the L3 only takes L2 cache line rejects, this means there has to be a lot of reuse of L3 data, or cyclical math on the same data, to take advantage of this.
Core-to-Core Latency
By only having one core per CCX, the 7F52 takes away one segment of its latency structure.
- Thread to Thread in same core: 8 nanoseconds
- Core to Core in same CCX: doesn't apply
- Core to Core in different CCX on same CPU in same quadrant: ~110 nanoseconds
- Core to Core in different CCX on same CPU in different socket quadrant: 130-140 nanoseconds
- Core to Core in a different socket: 250-270 nanosecons
All of the Power
Enterprise systems, unlike consumer systems, often have to adhere to a strict thermal envelope for the server and chassis designs that they go into. This means that, even in a world where there’s a lot of performance to be gained from having a fast turbo, the sustained power draw of these processors is mirrored in the TDP specifications of that processor. The chip may offer sustained boosts higher than this, which different server OEMs can design for and adjust the BIOS to implement, however the typical expected performance when ‘buying a server off the shelf’ is that if the chip has a specific TDP value, that will be the sustained turbo power draw. At that power, the system will try and implement the highest frequency it can, and depending on the microarchitecture of the power delivery, it might be able to move specific cores up and down in frequency if the workload is lighter on other cores.
By contrast, consumer grade CPUs will often boost well beyond the TDP label, to the second power limit as set in the BIOS. This limit is different depending on the motherboard, as manufacturers will design their motherboards beyond Intel specifications in order to supplement this.
For our power numbers, we take the CPU-only power draw at both idle and when running a heavy AVX2 load.
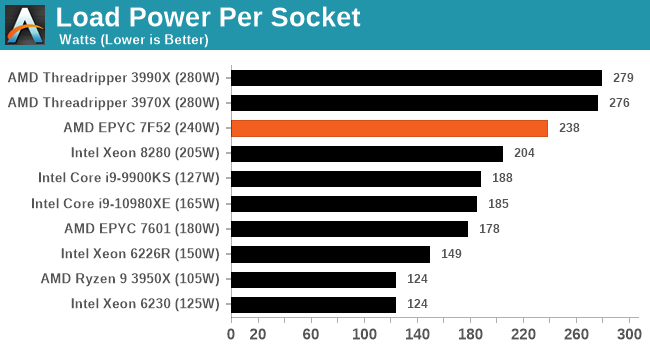
When we pile on the calories, all of our enterprise systems essentially go to TDPmax mode, with every system being just under the total TDP. The consumer processors give it a bit more oomph by contrast, being anywhere from 5-50% higher.
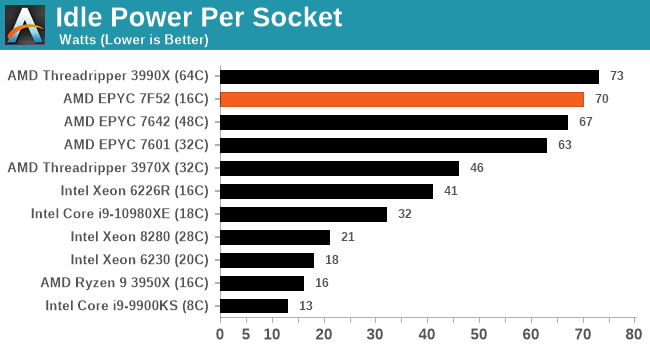
In our high performance power plan, the AMD CPUs idle quite high compared to the Intel CPUs – both of our EPYC setups are at nearly 70 W per processor a piece, while the 32C Threadripper is in about that 45 W region. Intel seems to aggressively idle here.


97 Comments
View All Comments
Qasar - Tuesday, April 14, 2020 - link
just get ryan to send you some of those watts up units. i have one as well, very handy :-)DanNeely - Wednesday, April 15, 2020 - link
US models are probably 110V only, and won't work with UK 220V power.Qasar - Wednesday, April 15, 2020 - link
just checked.. there are only ones for 110v. which is too badtyleeds - Thursday, April 16, 2020 - link
Hey Ian. Use the american units and run them off a double-conversion UPS. You can set the output to 110/60hz and nobodies the wiser.duploxxx - Friday, April 17, 2020 - link
where is Johan De Gelas? He used to write quite some nice reviews of server benchmarkskobblestown - Wednesday, April 15, 2020 - link
As I noted in a previous comment, many people here are not just about the numbers, but about the insights. How different architectural choices influence performance. So while I wouldn't mind to have the benchmarks that cover the target applications of a CPU line, I will not like it if it sticks to just that. And in this particular case, the people that would read it as an evaluation guide for specific application are a very small minority of Anandtech's reader base. At least I think so.Of course, it's a pity that people like you don't have anywhere else to go, servethehome.com notwithstanding - it has its problems too.
The Hardcard - Tuesday, April 14, 2020 - link
I wonder about the appeal of these for workstation use. Unless AMD allows Threadrippers to reach their memory capacity potential, this might be the most powerful option - price notwithstanding.schujj07 - Tuesday, April 14, 2020 - link
If you are going to be using software that can get the most out of this chip, much like the Intel W-3275 or Threadripper 3970X, then the hardware cost is minimal. The amount of time you save of the content creation or per core licensing, depending on the software, is worth the added money. In enterprise environments the server cost is minimal, especially compared to SAN and software licenses. The company I work for got a SuperMicro 2U4N with dual Epyc 7502s and 1TB RAM per node and the cost was ~$60K. While this isn't officially supported SAP HANA, it does pass their production performance assessment tool. Just to get a SAN that is SAP HANA certified starts at ~$250k. The SAP HANA DB can run over $1 million just for licensing. VMware vSphere Enterprise Plus licensing is $5800/socket for 3 years if your CPU has less than 32 cores, if you have more than that you need to get a second license for that socket. You can quickly see where $3100/CPU is pennies in the grand scheme of things.nft76 - Tuesday, April 14, 2020 - link
Why is Cascade Lake Xeon so much slower than others, also Intel's consumer parts, in some of the SPEC2006 tests? In libquantum, lbm, and soplex in particular the difference is much greater that I would have expected.anonomouse - Tuesday, April 14, 2020 - link
Those are all of heavily memory (latency, bandwidth) bound workloads in SPEC, too, which points to something very strange. CLX-R should not be >5x slower than CLX on lbm.