Intel NUC10i7FNH Frost Canyon Review: Hexa-Core NUC Delivers a Mixed Bag
by Ganesh T S on March 2, 2020 9:00 AM ESTBAPCo SYSmark 2018
The Intel NUC10i7FNH (Frost Canyon) was evaluated using our Fall 2018 test suite for small-form factor PCs. In the first section, we will be looking at SYSmark 2018.
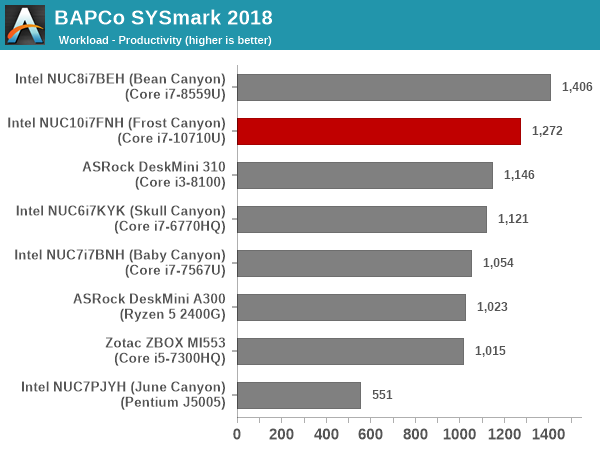
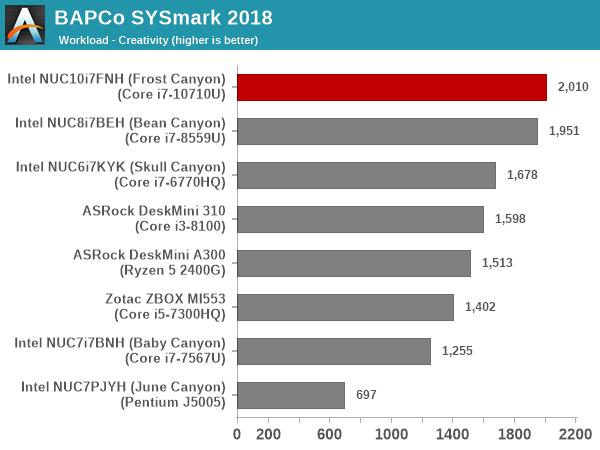
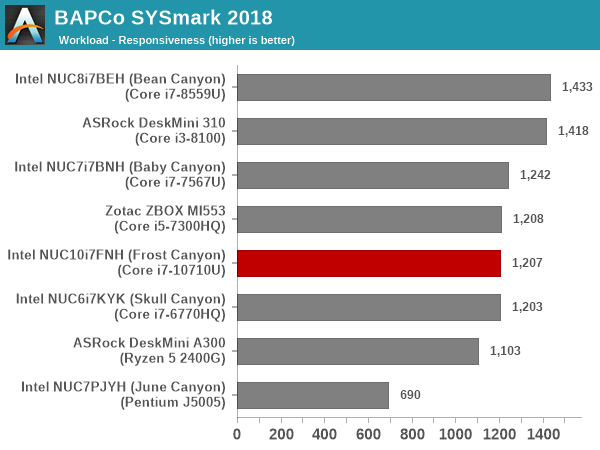
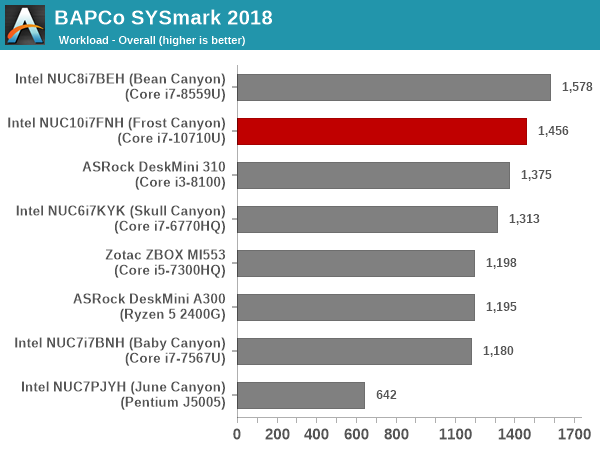
BAPCo's SYSmark 2018 is an application-based benchmark that uses real-world applications to replay usage patterns of business users in the areas of productivity, creativity, and responsiveness. The 'Productivity Scenario' covers office-centric activities including word processing, spreadsheet usage, financial analysis, software development, application installation, file compression, and e-mail management. The 'Creativity Scenario' represents media-centric activities such as digital photo processing, AI and ML for face recognition in photos and videos for the purpose of content creation, etc. The 'Responsiveness Scenario' evaluates the ability of the system to react in a quick manner to user inputs in areas such as application and file launches, web browsing, and multi-tasking.
Scores are meant to be compared against a reference desktop (the SYSmark 2018 calibration system, a Dell Optiplex 5050 tower with a Core i3-7100 and 4GB of DDR4-2133 memory to go with a 128GB M.2 SATA III SSD). The calibration system scores 1000 in each of the scenarios. A score of, say, 2000, would imply that the system under test is twice as fast as the reference system.
SYSmark 2018 also adds energy measurement to the mix. A high score in the SYSmark benchmarks might be nice to have, but, potential customers also need to determine the balance between power consumption and the efficiency of the system. For example, in the average office scenario, it might not be worth purchasing a noisy and power-hungry PC just because it ends up with a 2000 score in the SYSmark 2014 SE benchmarks. In order to provide a balanced perspective, SYSmark 2018 also allows vendors and decision makers to track the energy consumption during each workload. In the graphs below, we find the total energy consumed by the PC under test for a single iteration of each SYSmark 2018 workload. For reference, the calibration system consumes 5.36 Wh for productivity, 7.71 Wh for creativity, 5.61 Wh for responsiveness, and 18.68 Wh overall.
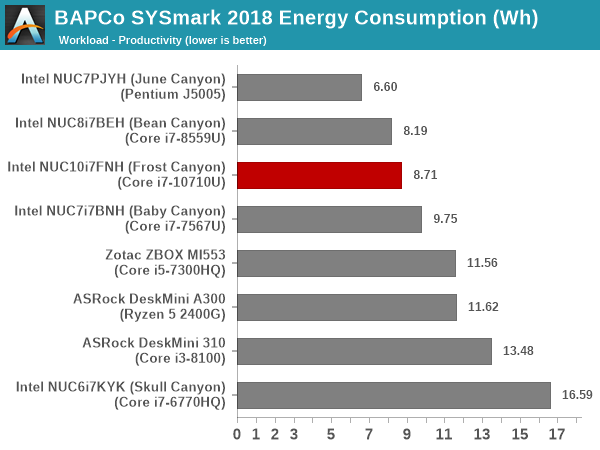
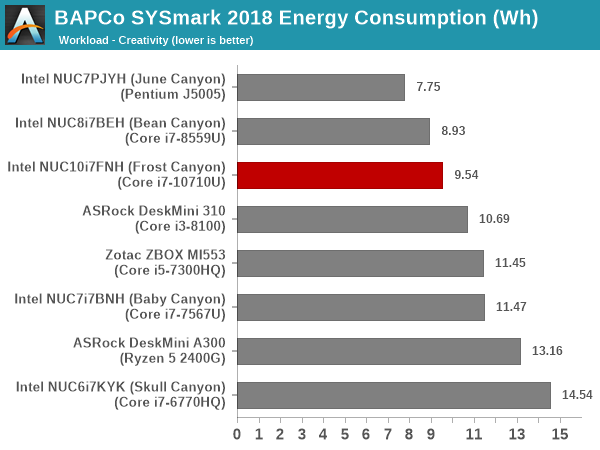
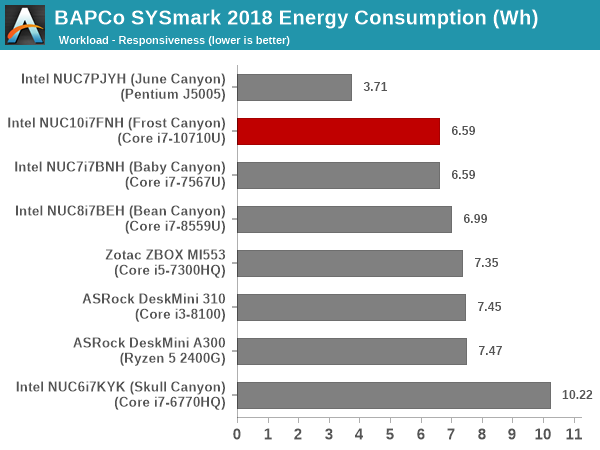
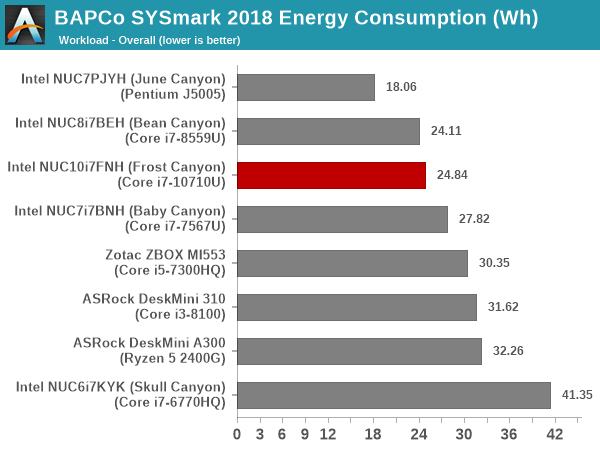
The 'Creativity' workload benefits from the extra cores in Frost Canyon compared to the Core i7-8559U in the Bean Canyon. Our Bean Canyon review configuration is also equipped with a WD Black 3D NVMe SSD (PCIe 3.0 x4) that delivers much better performance compared to the PCIe 3.0 x2 Kingston A1000-class in the Frost Canyon configuration. This results in the responsiveness score for the NUC10i7FNH coming in the middle of the pack compared to the other systems in the sample set. This pulls down the Frost Canyon NUC well below the Bean Canyon NUC in the overall score. The energy consumption is also worse off.


85 Comments
View All Comments
TMCHouse - Tuesday, March 3, 2020 - link
Hmm, I was expecting a real review with benchmarks, not just a system / specifications description. As a note, the people commenting on the graphics are spot on, I purchased one of these systems and the graphics performance is sub par to a NUC8I5BEH system. I've based this upon running multiple benchmarks and the frame rates are better on the older system with the Iris graphics. Unless you require loads of processor cores, you are better off with the older systems.GreenReaper - Monday, March 9, 2020 - link
I think perhaps you missed the other pages of the article? There are links and a combo box dropdown at the bottom, above the comments.not_anton - Saturday, March 7, 2020 - link
$600 barebone and they give you a huge ugly generic power brick to save like $10?Intel should but one of those Apple NUC minis to see how it should be done.
crashtech - Sunday, March 8, 2020 - link
I can't believe they would regress in GPU! I question the value of the extra cores in such a device instead of improved graphics.fishjie - Monday, November 29, 2021 - link
Ok I'm glad I read this before buying. I own a NUC 6 skull canyon with i7 6770 and was shocked to see some of the benchmarks beat the new NUC 10. granted my use case is mostly watching netflix on my tv but i would want to game occasionally on it. going to explore some other options. Maybe the NUC 8 i guess. The explanation in the concluding remarks was helpful:"However, while the NUC8 was an upgrade over NUC7 in every respect, the Frost Canyon NUC10 slips up a little. Intel's 10th generation U-series processors come in two different versions – the 10nm Ice Lake and the 14nm Comet Lake. Intel's high-end Iris Graphics is available only on Ice Lake, and unfortunately, the Frost Canyon is based on Comet Lake. This means that, for a variety of graphics intensive workloads, the NUC10 actually performs worse than the Iris Plus graphics-equipped NUC8."