Intel NUC10i7FNH Frost Canyon Review: Hexa-Core NUC Delivers a Mixed Bag
by Ganesh T S on March 2, 2020 9:00 AM ESTUL Benchmarks: PCMark and 3DMark
This section deals with a selection of the UL Futuremark benchmarks - PCMark 10, PCMark 8, and 3DMark. While the first two evaluate the system as a whole, 3DMark focuses on the graphics capabilities.
PCMark 10
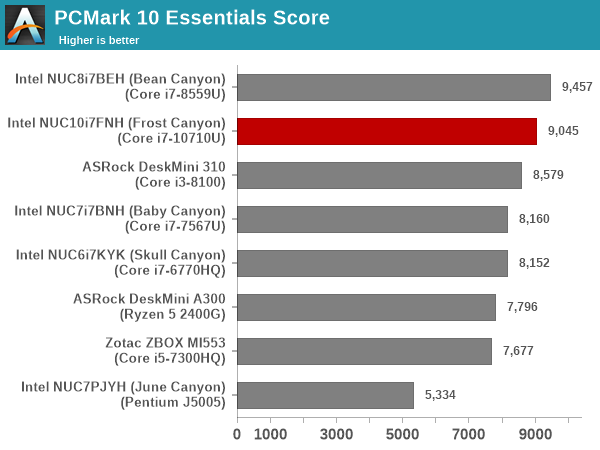
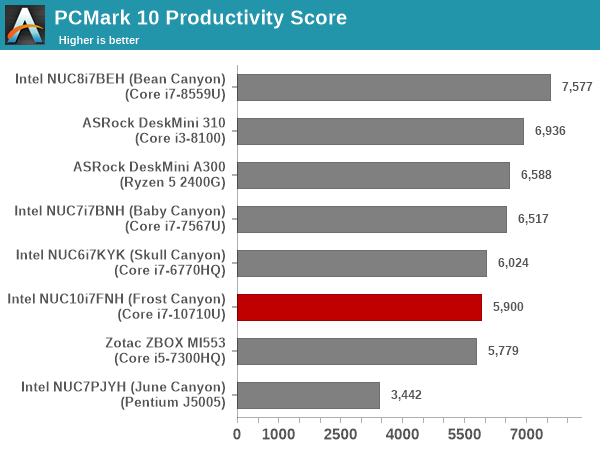
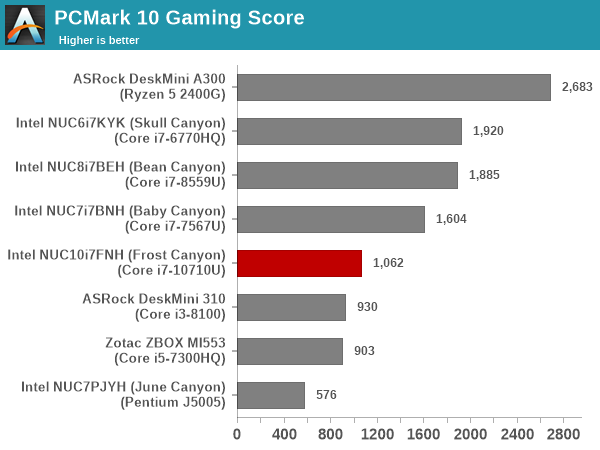
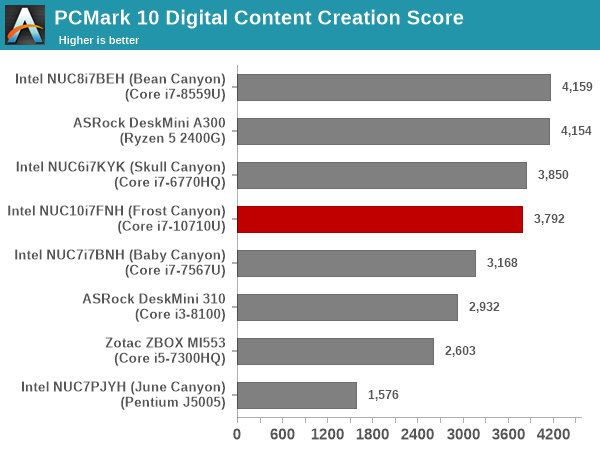
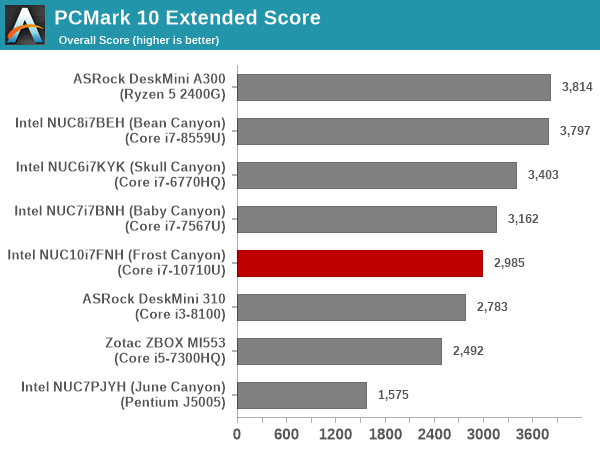
UL's PCMark 10 evaluates computing systems for various usage scenarios (generic / essential tasks such as web browsing and starting up applications, productivity tasks such as editing spreadsheets and documents, gaming, and digital content creation). We benchmarked select PCs with the PCMark 10 Extended profile and recorded the scores for various scenarios. These scores are heavily influenced by the CPU and GPU in the system, though the RAM and storage device also play a part. The power plan was set to Balanced for all the PCs while processing the PCMark 10 benchmark.
The Frost Canyon NUC comes in the middle of the pack, getting bettered by either systems with CPUs capable of higher TDP or better-performing storage. The hexa-core capabilities do not deliver any substantial benefits across various PCMark 10 scenarios, and the absence of Iris Plus Graphics / eDRAM pulls down the 'Gaming Score'.
PCMark 8
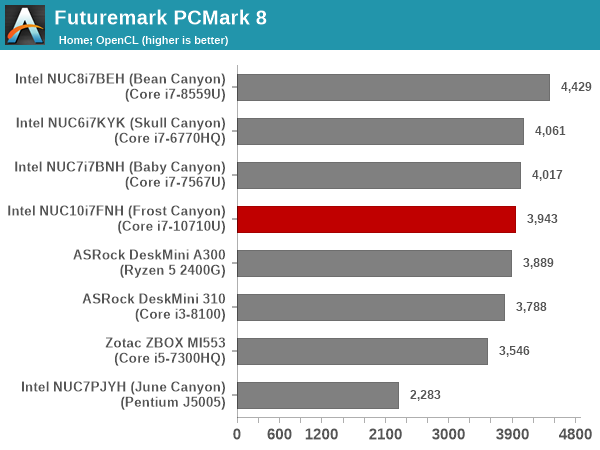
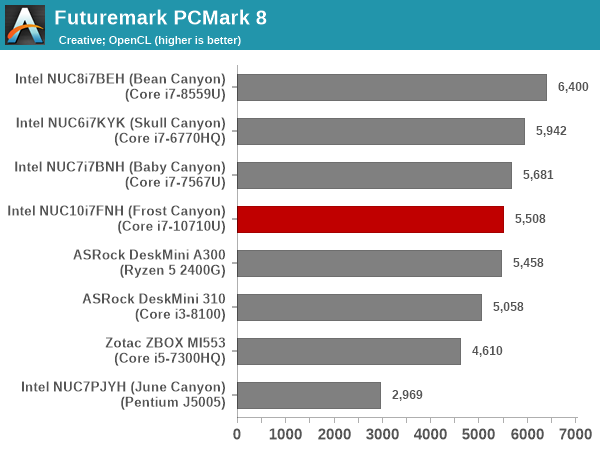
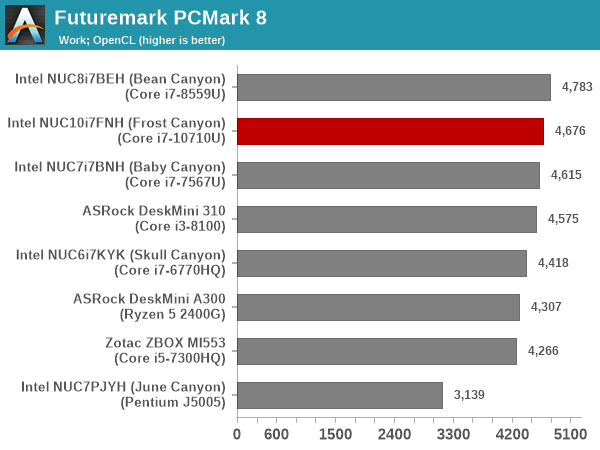
We continue to present PCMark 8 benchmark results (as those have more comparison points) while our PCMark 10 scores database for systems grows in size. PCMark 8 provides various usage scenarios (home, creative and work) and offers ways to benchmark both baseline (CPU-only) as well as OpenCL accelerated (CPU + GPU) performance. We benchmarked select PCs for the OpenCL accelerated performance in all three usage scenarios. These scores are heavily influenced by the CPU in the system, and the scores roughly track what was observed in the PCMark 10 workloads.
3DMark
UL's 3DMark comes with a diverse set of graphics workloads that target different Direct3D feature levels. Correspondingly, the rendering resolutions are also different. We use 3DMark 2.4.4264 to get an idea of the graphics capabilities of the system. In this section, we take a look at the performance of the Intel NUC10i7FNH (Frost Canyon) across the different 3DMark workloads.
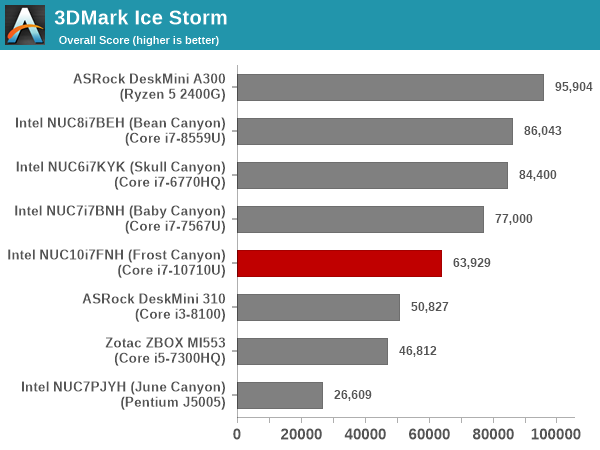
3DMark Ice Storm
This workload has three levels of varying complexity - the vanilla Ice Storm, Ice Storm Unlimited, and Ice Storm Extreme. It is a cross-platform benchmark (which means that the scores can be compared across different tablets and smartphones as well). All three use DirectX 11 (feature level 9) / OpenGL ES 2.0. While the Extreme renders at 1920 x 1080, the other two render at 1280 x 720. The graphs below present the various Ice Storm worloads' numbers for different systems that we have evaluated.
| UL 3DMark - Ice Storm Workloads | |||
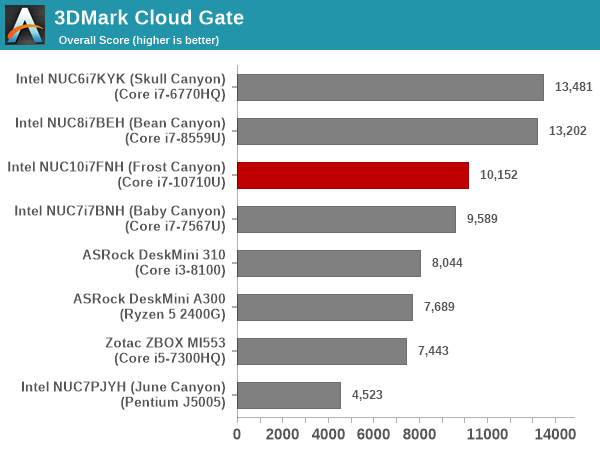
3DMark Cloud Gate
The Cloud Gate workload is meant for notebooks and typical home PCs, and uses DirectX 11 (feature level 10) to render frames at 1280 x 720. The graph below presents the overall score for the workload across all the systems that are being compared. The absence of eDRAM / Iris Plus Graphics results in the Frost Canyon performing significantly worse compared to the Bean Canyon.
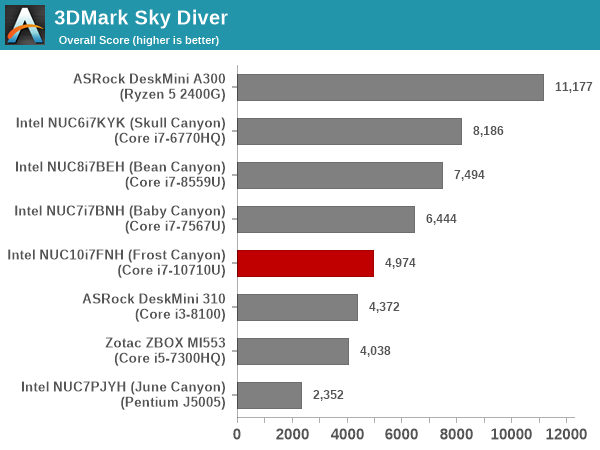
3DMark Sky Diver
The Sky Diver workload is meant for gaming notebooks and mid-range PCs, and uses DirectX 11 (feature level 11) to render frames at 1920 x 1080. The graph below presents the overall score for the workload across all the systems that are being compared. At 1080p, Frost Canyon falls further behind, and is below Baby Canyon's performance - pointing to the lack of GPU prowess.
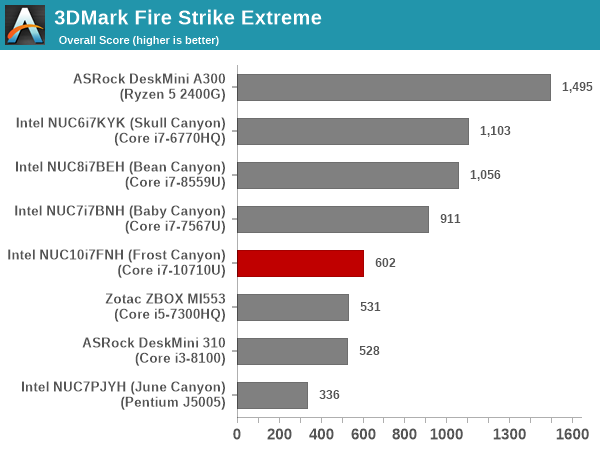
3DMark Fire Strike Extreme
The Fire Strike benchmark has three workloads. The base version is meant for high-performance gaming PCs. Similar to Sky Diver, it uses DirectX 11 (feature level 11) to render frames at 1920 x 1080. The Ultra version targets 4K gaming system, and renders at 3840 x 2160. However, we only deal with the Extreme version in our benchmarking - It renders at 2560 x 1440, and targets multi-GPU systems and overclocked PCs. The graph below presents the overall score for the Fire Strike Extreme benchmark across all the systems that are being compared. The results are similar to the Sky Diver workload.
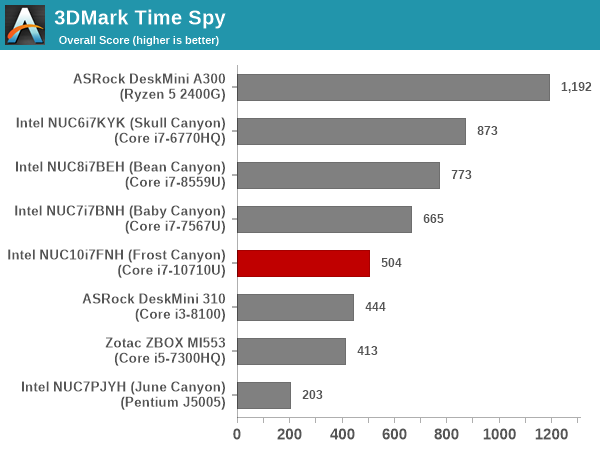
3DMark Time Spy
The Time Spy workload has two levels with different complexities. Both use DirectX 12 (feature level 11). However, the plain version targets high-performance gaming PCs with a 2560 x 1440 render resolution, while the Extreme version renders at 3840 x 2160 resolution. The graphs below present both numbers for all the systems that are being compared in this review, with results being similar to the 1080p Sky Diver workload.
| UL 3DMark - Time Spy Workloads | |||
3DMark Night Raid
The Night Raid workload is a DirectX 12 benchmark test. It is less demanding than Time Spy, and is optimized for integrated graphics. The graph below presents the overall score in this workload for different system configurations.
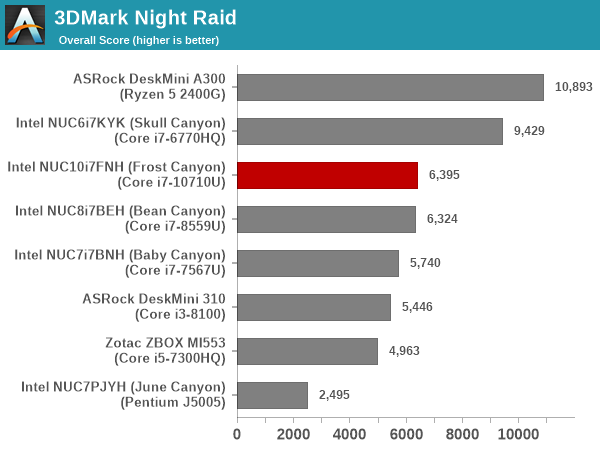
Overall, for CPU-bound graphics workloads, the Frost Canyon performs well, but, in other cases, the absence of eDRAM and the need to share the TDP with a hexa-core CPU block shows its effects. In almost all cases, the Bean Canyon NUC either vastly overperforms the Frost Canyon NUC, or, is neck-to-neck with it.


85 Comments
View All Comments
PeachNCream - Monday, March 2, 2020 - link
Ganesh explained why the NUC was opened up in the article. Besides that, NUC systems are built to be user-accessible and are pretty simple to pull apart. It's like 4 screws to get the case open and pulling one ribbon cable off the motherboard to disconnect the mechanical drive. The barebones models are the same hardware and you have to crack the case to add storage or RAM or you do not have a complete computer.nico_mach - Tuesday, March 3, 2020 - link
I don't actually disagree with his reasoning, but I definitely have mixed feelings as a review.I forgot about the Atom NUCs completely. There's a name I haven't heard in a long time.
watzupken - Monday, March 2, 2020 - link
With the new AMD APU arriving this year, I wonder if this is dead in the water considering the higher cost of the NUC. 14nm+++ is not going to save Intel when facing off 7nm from AMD as shown in the current processor stack from both teams.timecop1818 - Monday, March 2, 2020 - link
"7nm".Intel's "14nm+++++" (keep adding pluses, retards) is closer to 10nm than AMD's crap.
Fulljack - Monday, March 2, 2020 - link
while fabrication nomenclature are now nowhere near it's actual marketed size, Intel's 14nm are still nowhere close with their own 10nm, and couldn't compete with TSMC's 7nmQasar - Monday, March 2, 2020 - link
keep posting useless, anti amd, crap. keep showing the rest of us, and demonstrate to the world that you are a nitwit, then we will let you hang yourself, king oft trollsLord of the Bored - Thursday, March 5, 2020 - link
Isn't this copy/paste'd from one of your other shill threads? Come on, man. Intel isn't paying you to repost the same old bullshit, your fans demand new content!Korguz - Thursday, March 5, 2020 - link
timecop1818 cant post new content, cause it doesnt have any.xenol - Monday, March 2, 2020 - link
The NUC product line is sort of dead in the water any way, I'd argue.YB1064 - Monday, March 2, 2020 - link
It would be helpful to include a small table that of benchmarks vs CPU performance scaling. Perhaps this is hard to do, but as a naive simple example:Benchmark#1 - scales with threads/cores
Benchmark#2 - scales with clocks/IPC
This is most likely highly complicated, but if anybody can do it, it is you guys. Ian, care to take a stab?