Examining Intel's Ice Lake Processors: Taking a Bite of the Sunny Cove Microarchitecture
by Dr. Ian Cutress on July 30, 2019 9:30 AM EST- Posted in
- CPUs
- Intel
- 10nm
- Microarchitecture
- Ice Lake
- Project Athena
- Sunny Cove
- Gen11
Performance Claims:
+18% IPC vs. Skylake,
+47% Performance vs. Broadwell
With every new product generation, the company releasing the product has to put some level of expectations on performance. Depending on the company, you’ll either get a high level number summarizing performance, or you’ll get reams and reams of benchmark data. Intel did both, especially with a headline ‘+18%’ value, but in recent months the company has also been on a charge about what sort of benchmarking is worth doing. I want to take a quick diversion down that road, and give my thoughts on the matter.
First, I want to define some terms, just so we’re all on the same page.
- A synthetic test is a benchmark engineered to probe a feature of the processor, often to find its peak capability in one or several specific task. A synthetic test does not often reflect a real-world scenario, and likely doesn’t use real world software. Synthetic benchmarks are designed to be stable and repeatable, and the analysis often describing how a processor performs in an ideal scenario.
- A real-world test uses software that the user ends up using, along with a representative workload for that software. These tests are usually most applicable to end-users looking to purchase a product, as they can see actual use-case results. Real-world tests can have obvious pitfalls: it can be hard to test across multiple machines with only a single license, and testing one piece of software has no guarantee on performance on another.
A typical analysis of a processor does two things: what can it do (synthetic) and how does it perform (real-world). Users interested in the development of a platform, how it will expand and grow, or engineers peering over the fence, or even investors looking at the direction the company is going, will look at what products can do. People looking at what to use, what to work with, are more interested in the performance. Reviewers should get this concept, and companies like Intel should get this too – with Intel hiring a number of ex-reviewers of late, this is coming through.
A couple of months ago, Intel approached subsets of reviewers to discuss best benchmarking practices. On the table were real-world benchmarks, and which benchmarks represent the widest array of the market. Under fire was Cinebench, a semi-synthetic test (it uses a real-world engine on example data) that Intel believed didn’t represent the performance of a processor.
Intel provided data from one of its commissioned surveys on software that people use. Their data was based on a list of all consumers, from entry-level users up to prosumers, casual gamers, and enthusiasts, but also covering commercial use cases. At the top of the list were the obvious examples, such as OS and browsers: Explorer.exe, Edge, Chrome. In the top set were important widely distributed software packages, such as Photoshop (all versions), Steam, WinRAR, Office programs, and popular games like Overwatch. The point Intel was trying to make with this list is that a lot of reviewers run software that isn’t popular, and should aim to cover the widest market as possible.
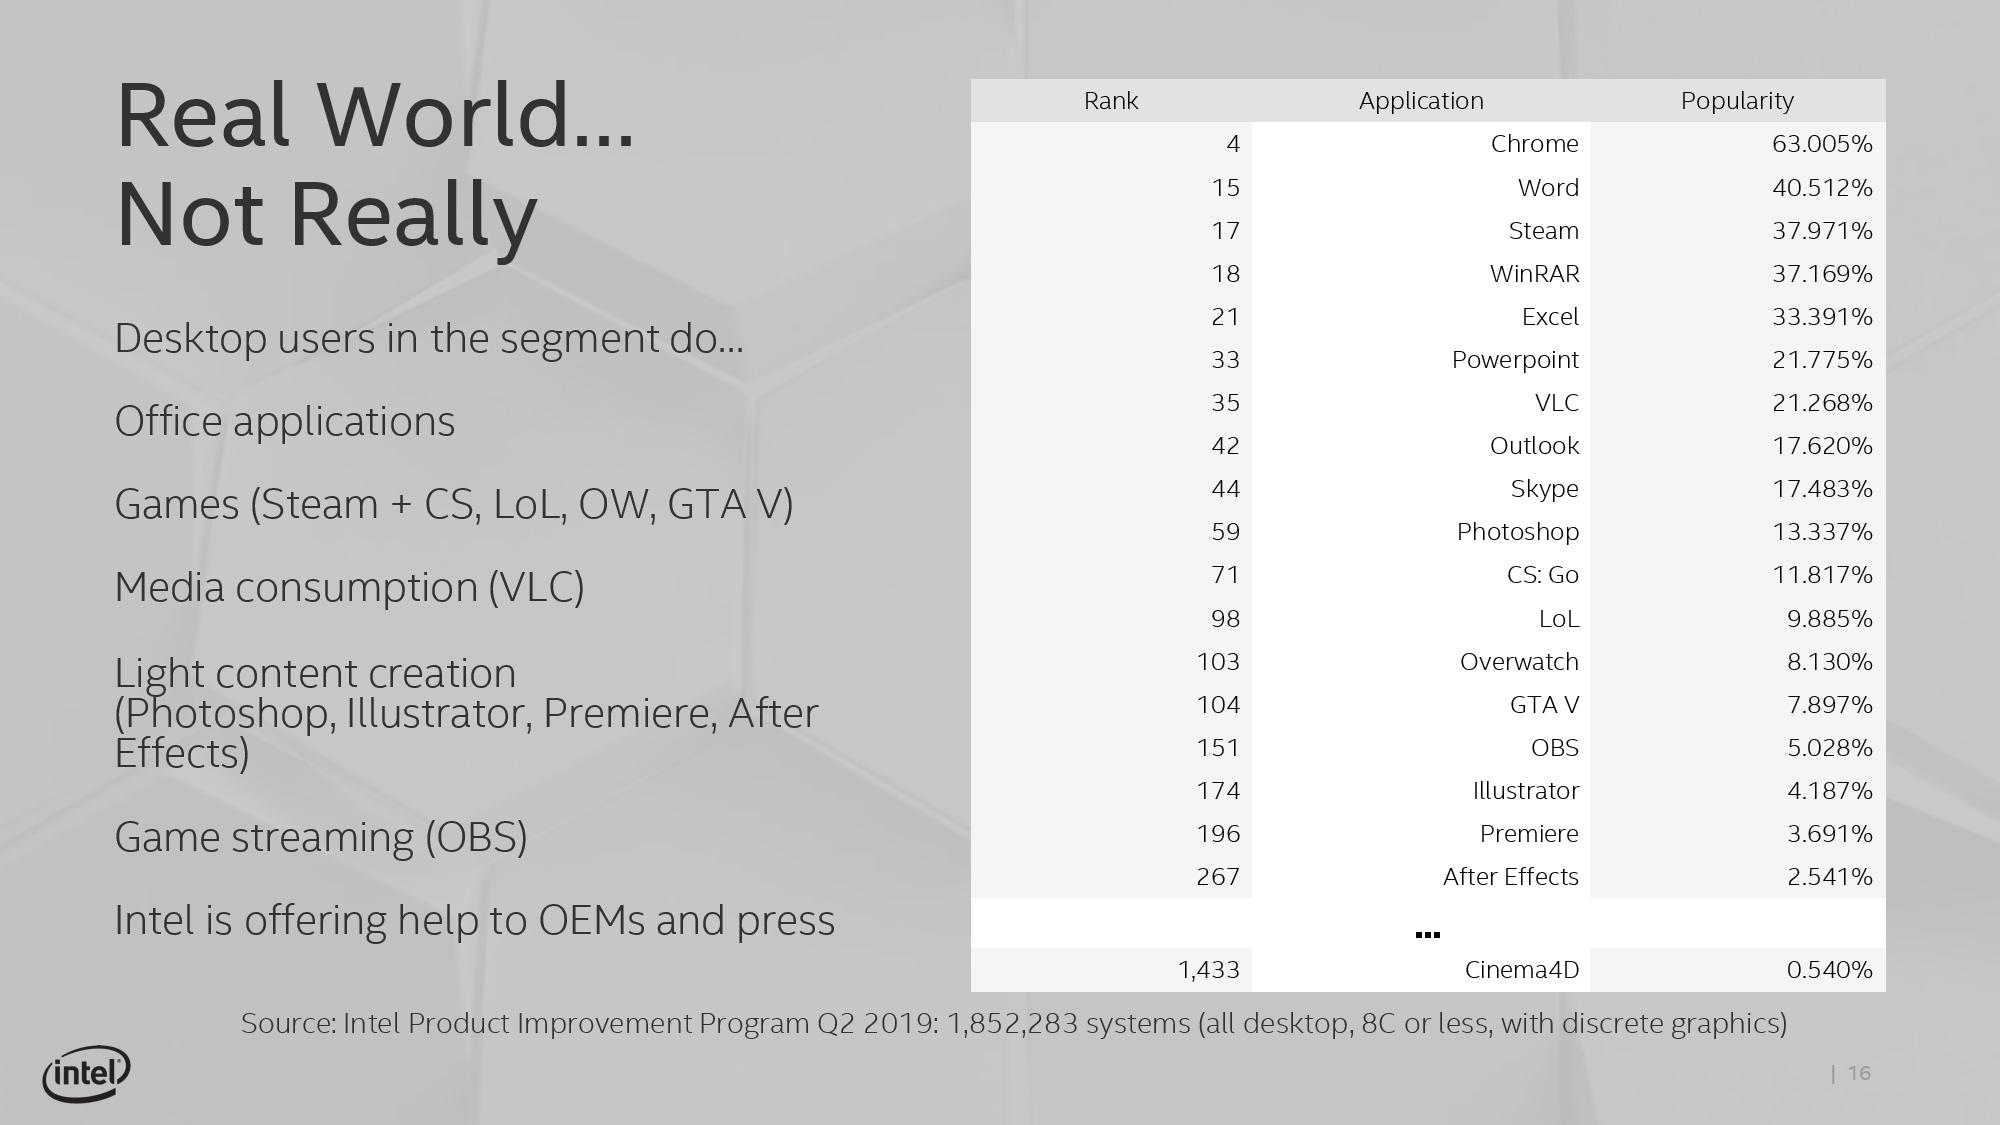
The key point they were trying to make was that Cinebench, while based on Cinema4D and a rendering tool used by a number of the community, wasn’t the be-all and end-all of performance. Now this is where Intel’s explanation became bifurcated: despite this being a discussion on what benchmarks reviewers should consider using, Intel’s perspective was that citing a single number, as Intel’s competitors have done, doesn’t represent true performance in all use cases. There was a general feeling that users were taking single numbers like this and jumping to conclusions. So despite the fact that the media in the room all test multiple software angles, Intel was clear in that they didn’t want a single number to dominate the headlines, especially when it’s from software that is ranked (according to Intel’s survey) somewhere in the 1400s.
Needless to say, Intel got a bit of backlash from the press in the room at the time. Key criticisms were that those present, when they get hardware, test a variety of software, not just Cinebench, to try and give a more overall view. Other key elements included that the survey covered all users, from consumer, commercial, and workstation: a number of the press in the room have audiences that are enthusiasts, so they will cater their benchmark accordingly. There was also a discussion that a number of software packages listed in the top 100 are actually difficult to benchmark, due to licensing arrangements designed to stop repeated installs across multiple systems. Typically most software vendors aren’t interested in working with the benchmark community to help evaluate performance, in the event that it exposes deficiencies in their code base. There was also the way in that readers were adapting over time: most focused readers want their specific software tested, and it is impossible to test 50 different software packages, so a few that can be streamlined in a benchmark suite are used as a representative sample, and typically Cinebench is one of those in the rendering arena, alongside POV-Ray, Corona, etc.
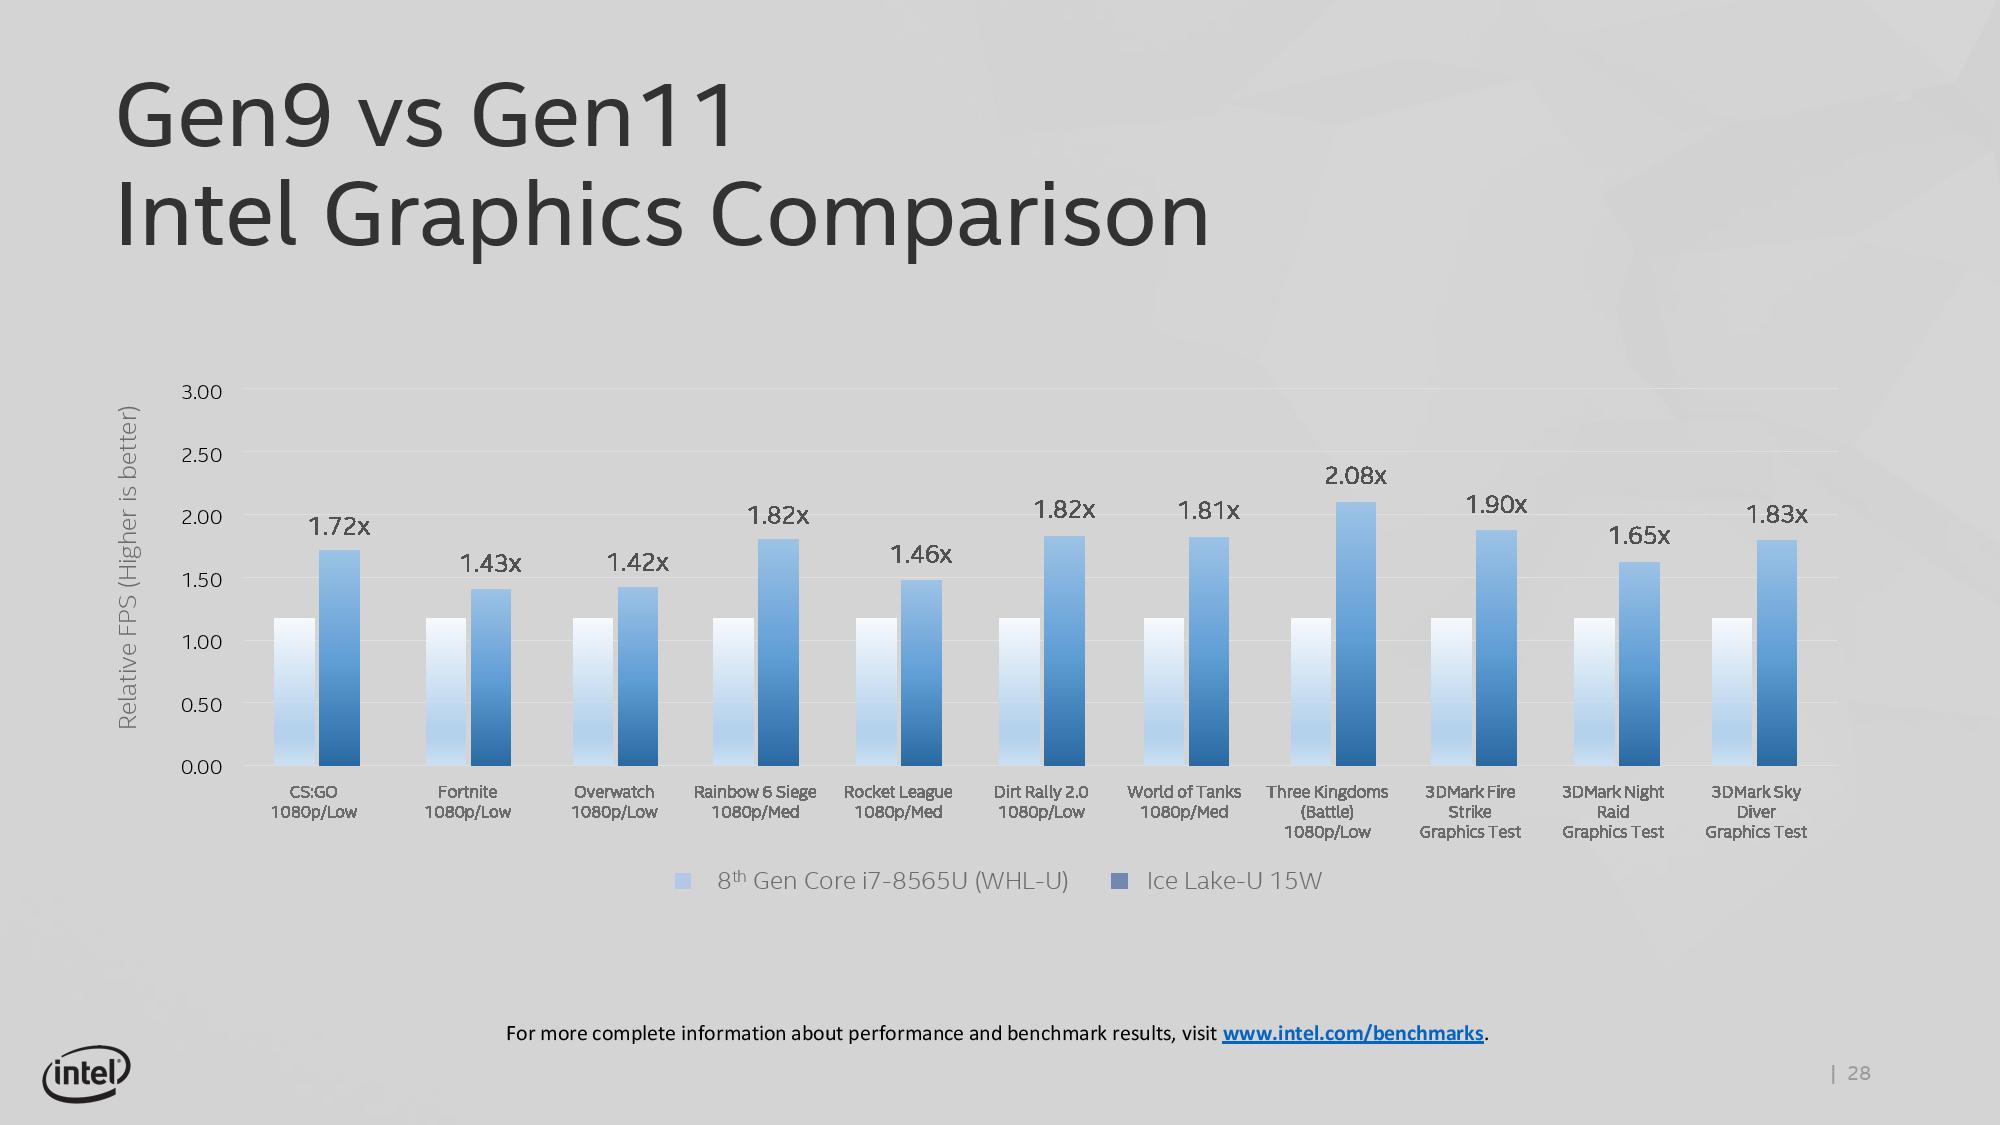
Intel, at this stage in the discussion, still went on to show how the new hardware performs on a variety of tests. We’ve covered these images before on previous pages, but Intel stated a significant uplift in graphics compared to the current 14nm offerings, from 40% up to 108%:
As well as comparisons to the competition:
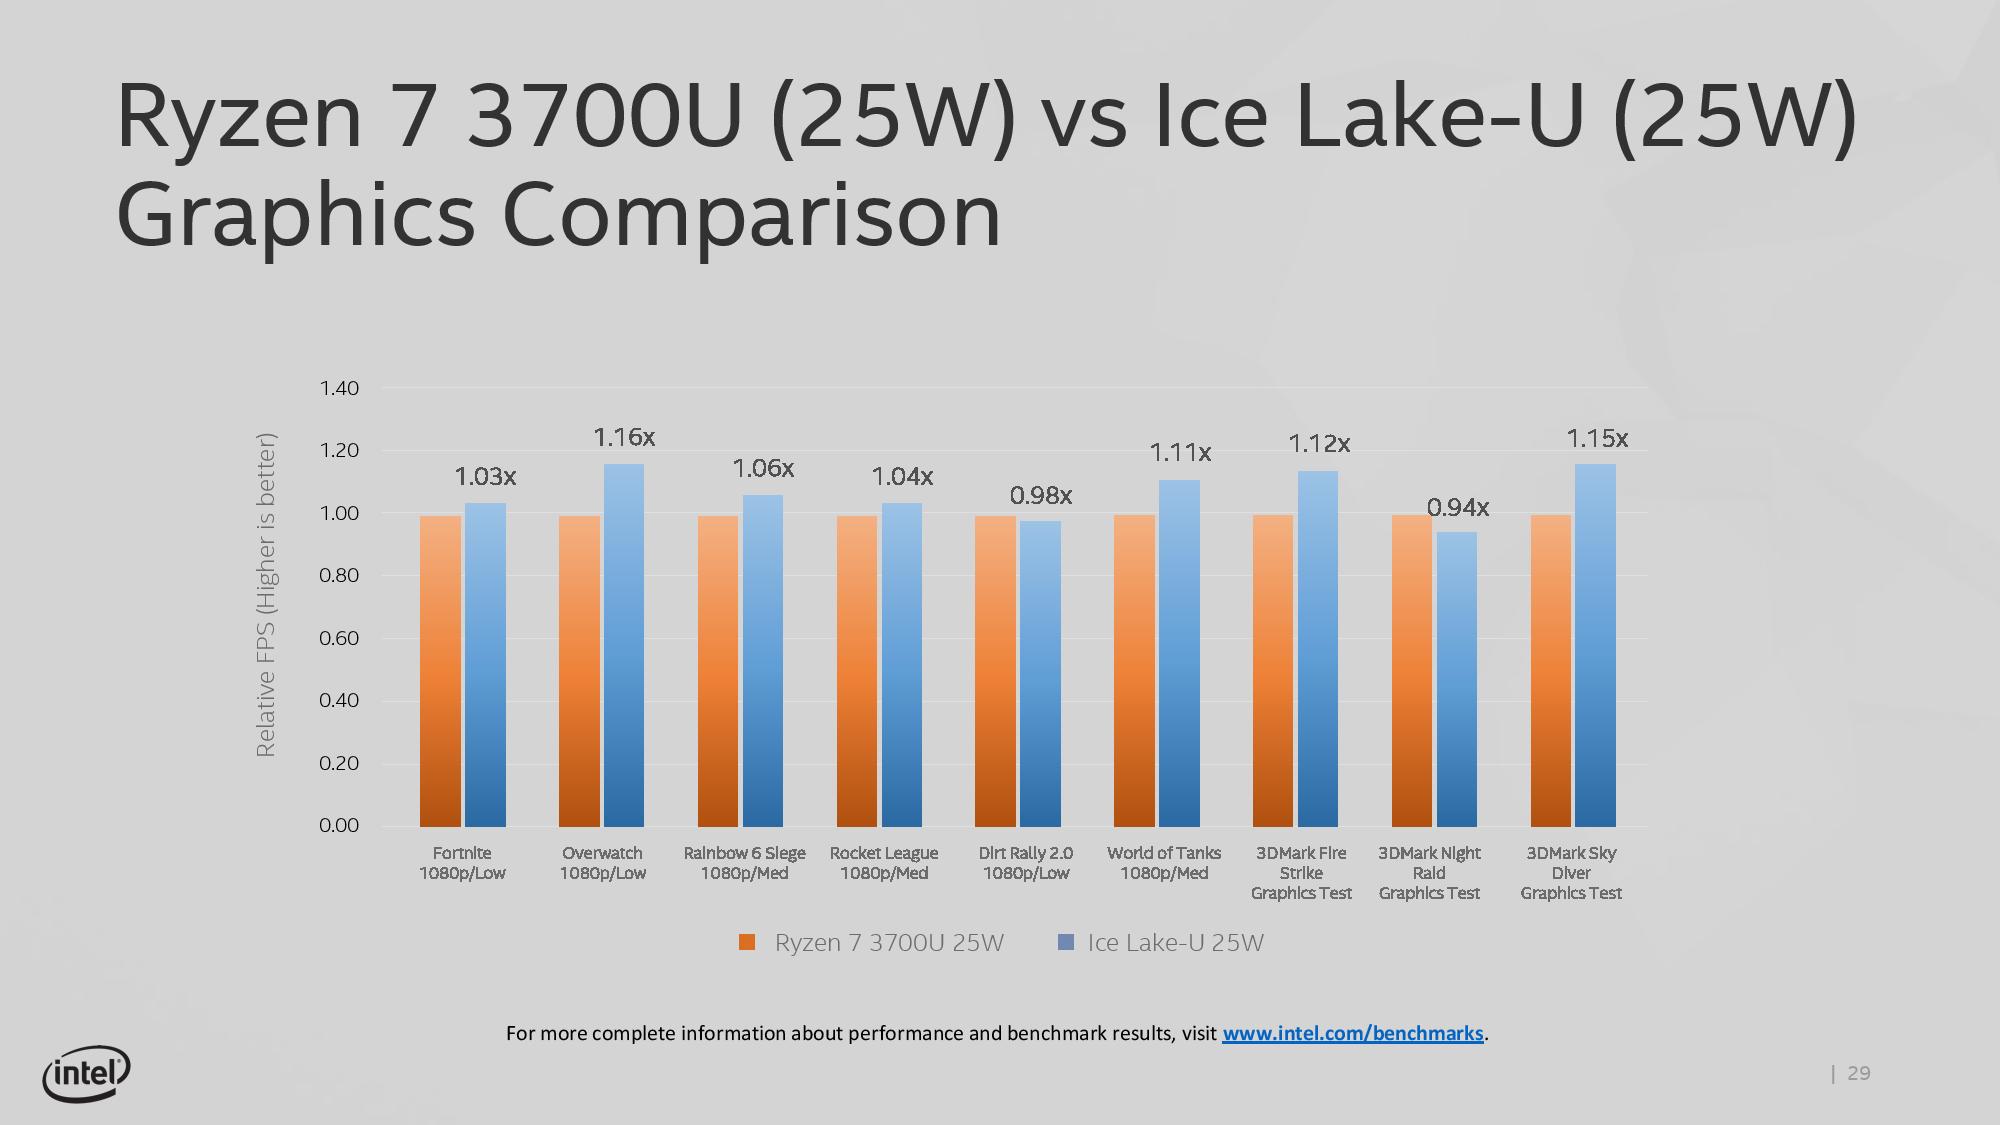
Aside from 3DMark, these are all ‘real-world’ tests.
Move forward a few weeks, and Intel’s Tech Day where Ice Lake is discussed, and Intel brings up IPC.

Intel’s big statement is that Sunny Cove, a 2019 product, offers 18% more instructions per clock against Skylake, a 2015 product. In order to come to that conclusion, as expected, Intel has to turn to synthetic testing: SPEC2006, SPEC2017, SYSMark 2014 SE, WebXPRT, and Cinebench R15. Wait, what was that last one? Cinebench?
So there are two topics to discuss here.
First is the 18% increase over four years – that’s the equivalent to a 4.2% compound annual growth rate. Some users will state that we should have had more, and that Intel’s issues with its 10nm manufacturing process means that this should have been a 2017 product (which would have been an 8.6% CAGR). Ultimately Intel built enough of an IPC increase lead over the last decade to afford something like this, and it shows that there isn’t an IPC wall just yet.
Second is the use of Cinebench, and the previous version at that. Given what was discussed above, various conclusions could be drawn. I’ll leave those up to you. Personally, I wouldn’t have included it.
Aside from IPC, Intel also spoke about actual single-threaded performance about Sunny Cove in its 15W mode.

At a brief glance, I would have expected this graph to be from real-world analysis. But given the blurb at the bottom it shows that these results are derived from SPEC2006, specifically 1-thread int_rate_base, which means that these are synthetic results, so we’ll analyze them with that in mind. This test also gets lots of benefit from turbo, with each test likely to fit inside the turbo window of an adequately cooled system.
The base line here is Broadwell, Intel’s 5th Generation processor, which if you remember was the first Intel processor to have an integrated FIVR on the mobile parts for power efficiency. In this case we see that Intel puts Skylake as +9% above Broadwell, then moving through Kaby Lake and Whiskey Lake we see the effect of increasing that peak turbo frequency and power budget: when we moved from dual core to quad core 15W mobile processors, that peak turbo power budget increased from 19W to 44W, allowing longer turbo. Overall we hit +42% for 8th Gen Whiskey Lake over Broadwell.
Ice Lake, by comparison, is +47% over Broadwell. When moving from Broadwell to Ice Lake, which Intel expects most of its users to do, that’s a sizable single threaded performance jump, I won’t dispute that, although I will wait until we see real world data to come to a better conclusion.
However, if we compare Ice Lake to Whiskey Lake, we see only a +3.5% increase in single threaded performance. For a generation-on-generation increase, that’s even lower than the four-year CAGR from Skylake. Some of you might be questioning why this is happening, and it all comes down to frequency.
Intel’s current 8th Gen Whiskey Lake, the i7-8565U, has a peak turbo frequency of 4.8 GHz. In 15W mode, we understand that the peak frequency of Ice Lake is under 4.0 GHz, essentially handing Whiskey Lake a ~20% frequency advantage.
If this sounds odd, turn over to the next page. Intel is going to start tripping over itself with its new product lines, and we’ll do the math.


107 Comments
View All Comments
PeachNCream - Tuesday, July 30, 2019 - link
Are there really that many eGPUs out there though?HStewart - Tuesday, July 30, 2019 - link
Just do a search on amazon for eGPU and you find 3 pages full of then. ASUS, Gigibyte, and Dell are examples plus many 3rd party.PeachNCream - Tuesday, July 30, 2019 - link
Not for sale. Actually in use by people.The_Assimilator - Wednesday, July 31, 2019 - link
2.Retycint - Wednesday, July 31, 2019 - link
One of the reasons that eGPU adoption rates are low is precisely because of the limitation mentioned above - huge performance drop (anywhere from 30-50% I think) compared to PCI-E connection, due to bandwidth limitations.DanNeely - Wednesday, July 31, 2019 - link
The performance issue is TB3 overhead. Running a GPU on an internal PCIe3 x4 link will come within a few percent of an x16.repoman27 - Tuesday, July 30, 2019 - link
"There is still some communication back and forth with the chipset (PCH), as the Type-C ports need to have USB modes implemented."Just to add to that, all of the high-speed signaling (Thunderbolt, DisplayPort, SuperSpeed USB) is handled by the CPU die, and the PCH only transacts in USB 2.0 and the low-speed, out-of-band management channel for Thunderbolt (LSx).
I fully understand why you (Ian) included the asterisk, because many OEMs won't bother implementing Thunderbolt 3 due to the additional expense / complexity, but to be fair to Intel, they integrated Thunderbolt as much as they possibly could. It's really not feasible to include all of the power and analog signal conditioning necessary for Thunderbolt 3 on the CPU package.
Galatian - Tuesday, July 30, 2019 - link
The numbers of the iGPU don’t really add up. They are comparing their best new GPU to last Gens UHD 420. I don't see the performance gain.at8750 - Tuesday, July 30, 2019 - link
Probably,CML-U
i7-10510U 4C 1.8GHz TB:4.9/4.8/4.3GHz
i5-10210U 4C 1.6GHz TB:4.2/4.1/3.9GHz
ICL-U
i7-1065G7 4C 1.3GHz TB:3.9/3.8/3.5GHz
i5-1034G1 4C 0.8GHz TB:3.6/3.6/3.3GHz
digitalgriffin - Tuesday, July 30, 2019 - link
Ian,You do know pure Silicon is highly toxic? I wouldn't even hang it in your house unless it was plated in a clear lacquer. It degrades when exposed to open air. And it's been shown to cause cancer. I know you wouldn't actually bite it. But be sure to wash your hands.