The Team Group MP34 512GB SSD Review: Refining Phison's NVMe Workhorse
by Billy Tallis on May 15, 2019 9:00 AM EST- Posted in
- SSDs
- Storage
- Toshiba
- Phison
- M.2
- NVMe
- BiCS
- 3D TLC
- Team Group
- PS5012-E12
Whole-Drive Fill
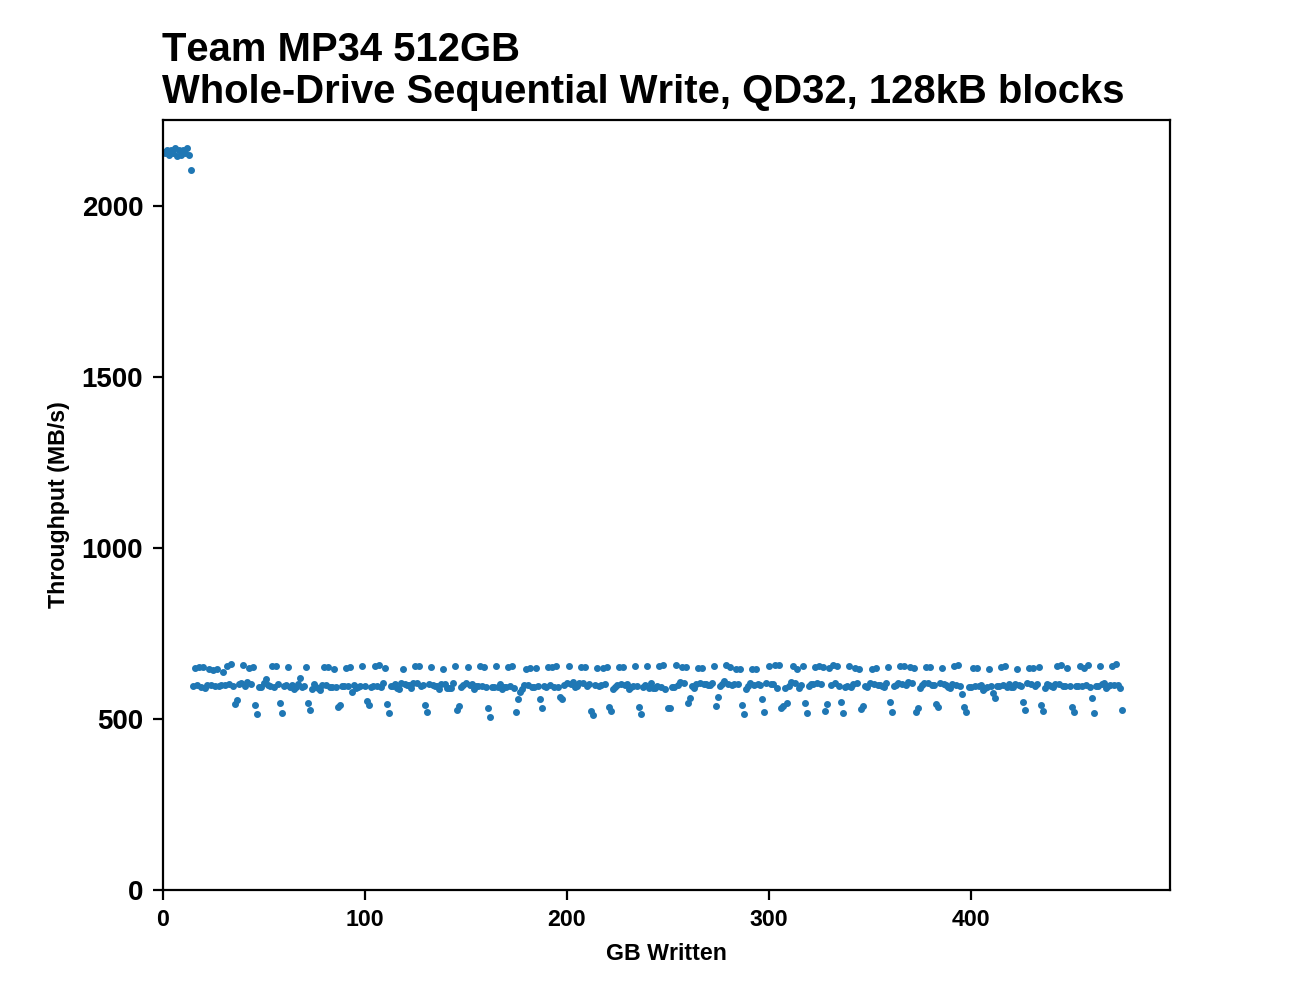
This test starts with a freshly-erased drive and fills it with 128kB sequential writes at queue depth 32, recording the write speed for each 1GB segment. This test is not representative of any ordinary client/consumer usage pattern, but it does allow us to observe transitions in the drive's behavior as it fills up. This can allow us to estimate the size of any SLC write cache, and get a sense for how much performance remains on the rare occasions where real-world usage keeps writing data after filling the cache.
 |
|||||||||
The Team Group MP34's use of the latest 12.2 firmware for the Phison E12 controller brings another visible change in the long-term write behavior. After the SLC write cache is filled, we no longer see periodic jumps back up to full SLC write speed; instead, the MP34's post-SLC write speed is very consistent, and a bit higher than on previous firmware. The SLC cache seems to be about 14-15GB on this 512GB drive, which is 1-2GB larger than on the 512GB Gigabyte Aorus RGB.
 |
|||||||||
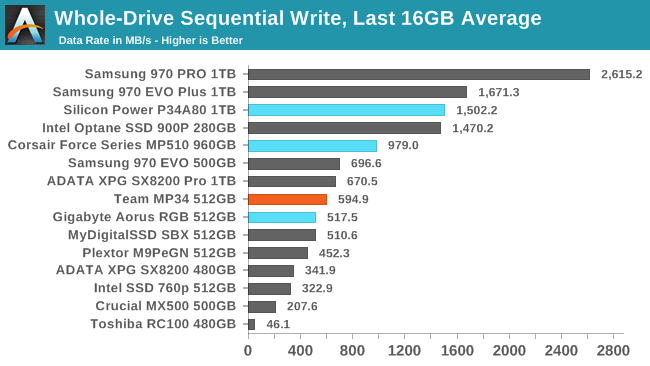
| Average Throughput for last 16 GB | Overall Average Throughput | ||||||||
The more consistent sustained write performance of the newer firmware also brings a slight overall performance increase, with about a 3% increase in speed for filling the entire drive. The 512GB E12 drives aren't too far behind Samsung on this metric, but the 1TB drives (all with older firmware) are far slower than Samsung's latest.
BAPCo SYSmark 2018
BAPCo's SYSmark 2018 is an application-based benchmark that uses real-world applications to replay usage patterns of business users, with subscores for productivity, creativity and responsiveness. Scores represnt overall system performance and are calibrated against a reference system that is defined to score 1000 in each of the scenarios. A score of, say, 2000, would imply that the system under test is twice as fast as the reference system.
SYSmark scores are based on total application response time as seen by the user, including not only storage latency but time spent by the processor. This means there's a limit to how much a storage improvement could possibly increase scores, because the SSD is only in use for a small fraction of the total test duration. This is a significant difference from our ATSB tests where only the storage portion of the workload is replicated and disk idle times are cut short to a maximum of 25ms.
| AnandTech SYSmark SSD Testbed | |
| CPU | Intel Core i5-7400 |
| Motherboard | ASUS PRIME Z270-A |
| Chipset | Intel Z270 |
| Memory | 2x 4GB DDR4-2666 CL15 |
| Case | In Win C583 |
| Power Supply | Cooler Master G550M |
| OS | Windows 10 64-bit, version 1803 |
Our SSD testing with SYSmark uses a different test system than the rest of our SSD tests. This machine is set up to measure total system power consumption rather than just the drive's power.
 |
|||||||||
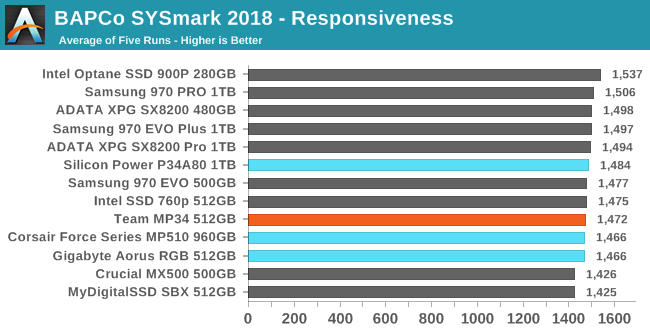
| Creativity | Productivity | Responsiveness | Overall | ||||||
SYSmark 2018 is not a very storage-intensive test, so only the Responsiveness subscore shows a clear difference between SATA and NVMe SSDs. The Team MP34's performance is a few points higher than the Gigabyte Aorus RGB SSD, but this is within the ordinary variation between runs.
Energy Usage
The SYSmark energy usage scores measure total system power consumption, excluding the display. Our SYSmark test system idles at around 26 W and peaks at over 60 W measured at the wall during the benchmark run. SATA SSDs seldom exceed 5 W and idle at a fraction of a watt, and the SSDs spend most of the test idle. This means the energy usage scores will inevitably be very close. A typical notebook system will tend to be better optimized for power efficiency than this desktop system, so the SSD would account for a much larger portion of the total and the score difference between SSDs would be more noticeable.
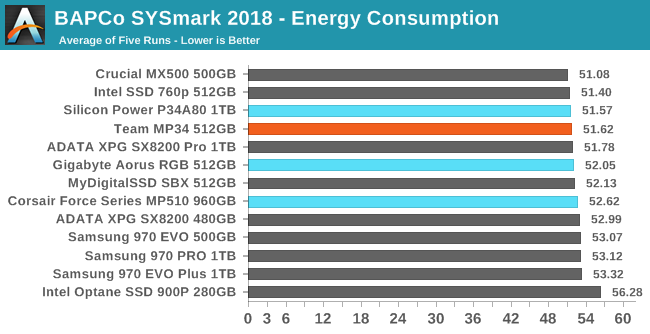
The Team MP34's energy consumption is unsurprisingly lower than the similar drive that has RGB LEDs, but the 1TB Silicon Power P34A80 (another Phison E12 drive) is even a bit more power efficient thanks to its higher performance.


17 Comments
View All Comments
ssd-user - Sunday, May 19, 2019 - link
I see that you are still in denial about how it was you who couldn't read diagrams. I'd also like to point out that I'm actually trying to be the change I want to see exactly by asking for the sorting to be fixed.Because the sorting clearly is wrong. I pointed out a very stark example of when a much worse drive sorts above the better ones.
Also, your lack of reading comprehension is showing in how you think this is only about TRIM. As I said, this is about disk full situations. And even with TRIM, the disk may simply be close to full. Not everybody buys an SSD that is twice as big as it needs to be.
I was also pointing out that even if your drive isn't full, it may well show the full behavior in reality.
Sorry for not being your ideal party buddy.
peevee - Monday, May 20, 2019 - link
Who uses their SSDs full to the brim and in sustained write mode? Honestly, that scenario is not even realistic for properly managed DB servers, let alone in client systems where the only wait time which actually happens is during system boot/application launch/data load on up to 80% full (in Anandtech-speak "empty" system).Client writes are all cached first and the write itself happens in background, the user does not have to wait anything.
AT does not even test this scenario properly, even their "Light" test is WAY too write-heavy for that.
A synthetic which would reflect that is something like "64kb random read" (runs are 16 clusters=64k on NTFS, and most DLLs are close to that size).
MDD1963 - Wednesday, May 15, 2019 - link
660P from Intel is $109 for 1 TB....; even though it is 'only' 2x PCI-e lanes capable, it is still more than 'snappy' for that sort of cost/capacity ratio....peevee - Monday, May 20, 2019 - link
Why do they even use x4 PCIe when they cannot even saturate x2? Really, peak read of 1.4GB/s is pathetic.DyneCorp - Monday, June 17, 2019 - link
"The write endurance ratings are still competitive with high-end drives that offer five year warranties"The MP34 has over twice the endurance of any SSD utilizing the SM2262 with Micron NAND. I apologize, but I'm not understanding what you mean by "still competitive". Seems as if Phison is outclassing the competition in certain regards. A small sacrifice in performance for exceptionally more endurance.
DyneCorp - Monday, June 17, 2019 - link
Metrics*, not regards ha.crimson117 - Friday, April 24, 2020 - link
Looks like the new MP34's offer a 5-year warranty:256GB - TM8FP4256G0C101
512GB - TM8FP4512G0C101
1TB - TM8FP4001T0C101
https://www.teamgroupinc.com/en/product/mp34
https://www.teamgroupinc.com/en/catalog/act.php?ac...