The ASRock DeskMini A300 Review: An Affordable DIY AMD Ryzen mini-PC
by Ganesh T S on April 26, 2019 8:00 AM ESTPower Consumption and Thermal Performance
The power consumption at the wall was measured with a 4K display being driven through the HDMI port. In the graphs below, we compare the idle and load power of the ASRock DeskMini A300 with other SFF PCs evaluated before. For load power consumption, we ran the AIDA64 System Stability Test with various stress components, as well as a combination of Prime95 and Furmark, and noted the maximum sustained power consumption at the wall.
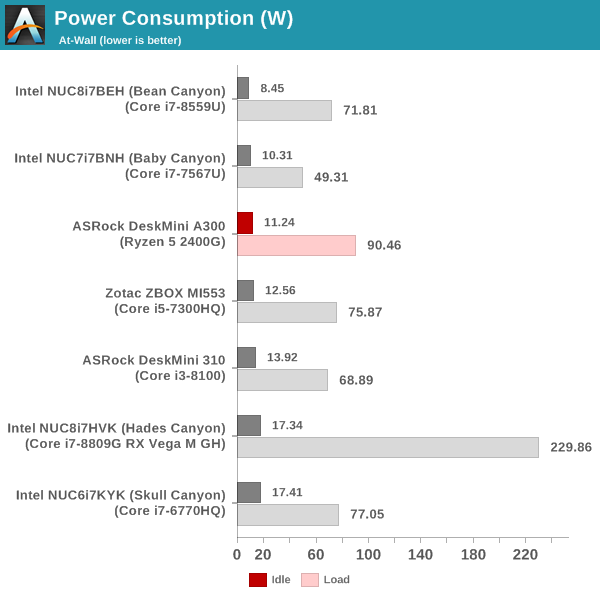
The key comparison here is against the DeskMini 310. Thanks to the use of a more power-efficient NVMe SSD, and the A300 PCH that essentially acts as a transparent bridge, the idle power consumption of the DeskMini A300 is a full 2W lower than the DeskMini 310. The load case, however, is completely different. We see the DeskMini A300 sustaining more than 90W at the wall. This number is higher than the load consumption of any other iGPU-only system we are comparing against.
Our thermal stress routine starts with the system at idle, followed by four stages of different system loading profiles using the AIDA64 System Stability Test (each of 30 minutes duration). In the first stage, we stress the CPU, caches and RAM. In the second stage, we add the GPU to the above list. In the third stage, we stress the GPU standalone. In the final stage, we stress all the system components (including the disks). Beyond this, we leave the unit idle in order to determine how quickly the various temperatures in the system can come back to normal idling range. The various clocks, temperatures and power consumption numbers for the system during the above routine are presented in the graphs below.
| ASRock DeskMini A300 System Loading with the AIDA64 System Stability Test | |||
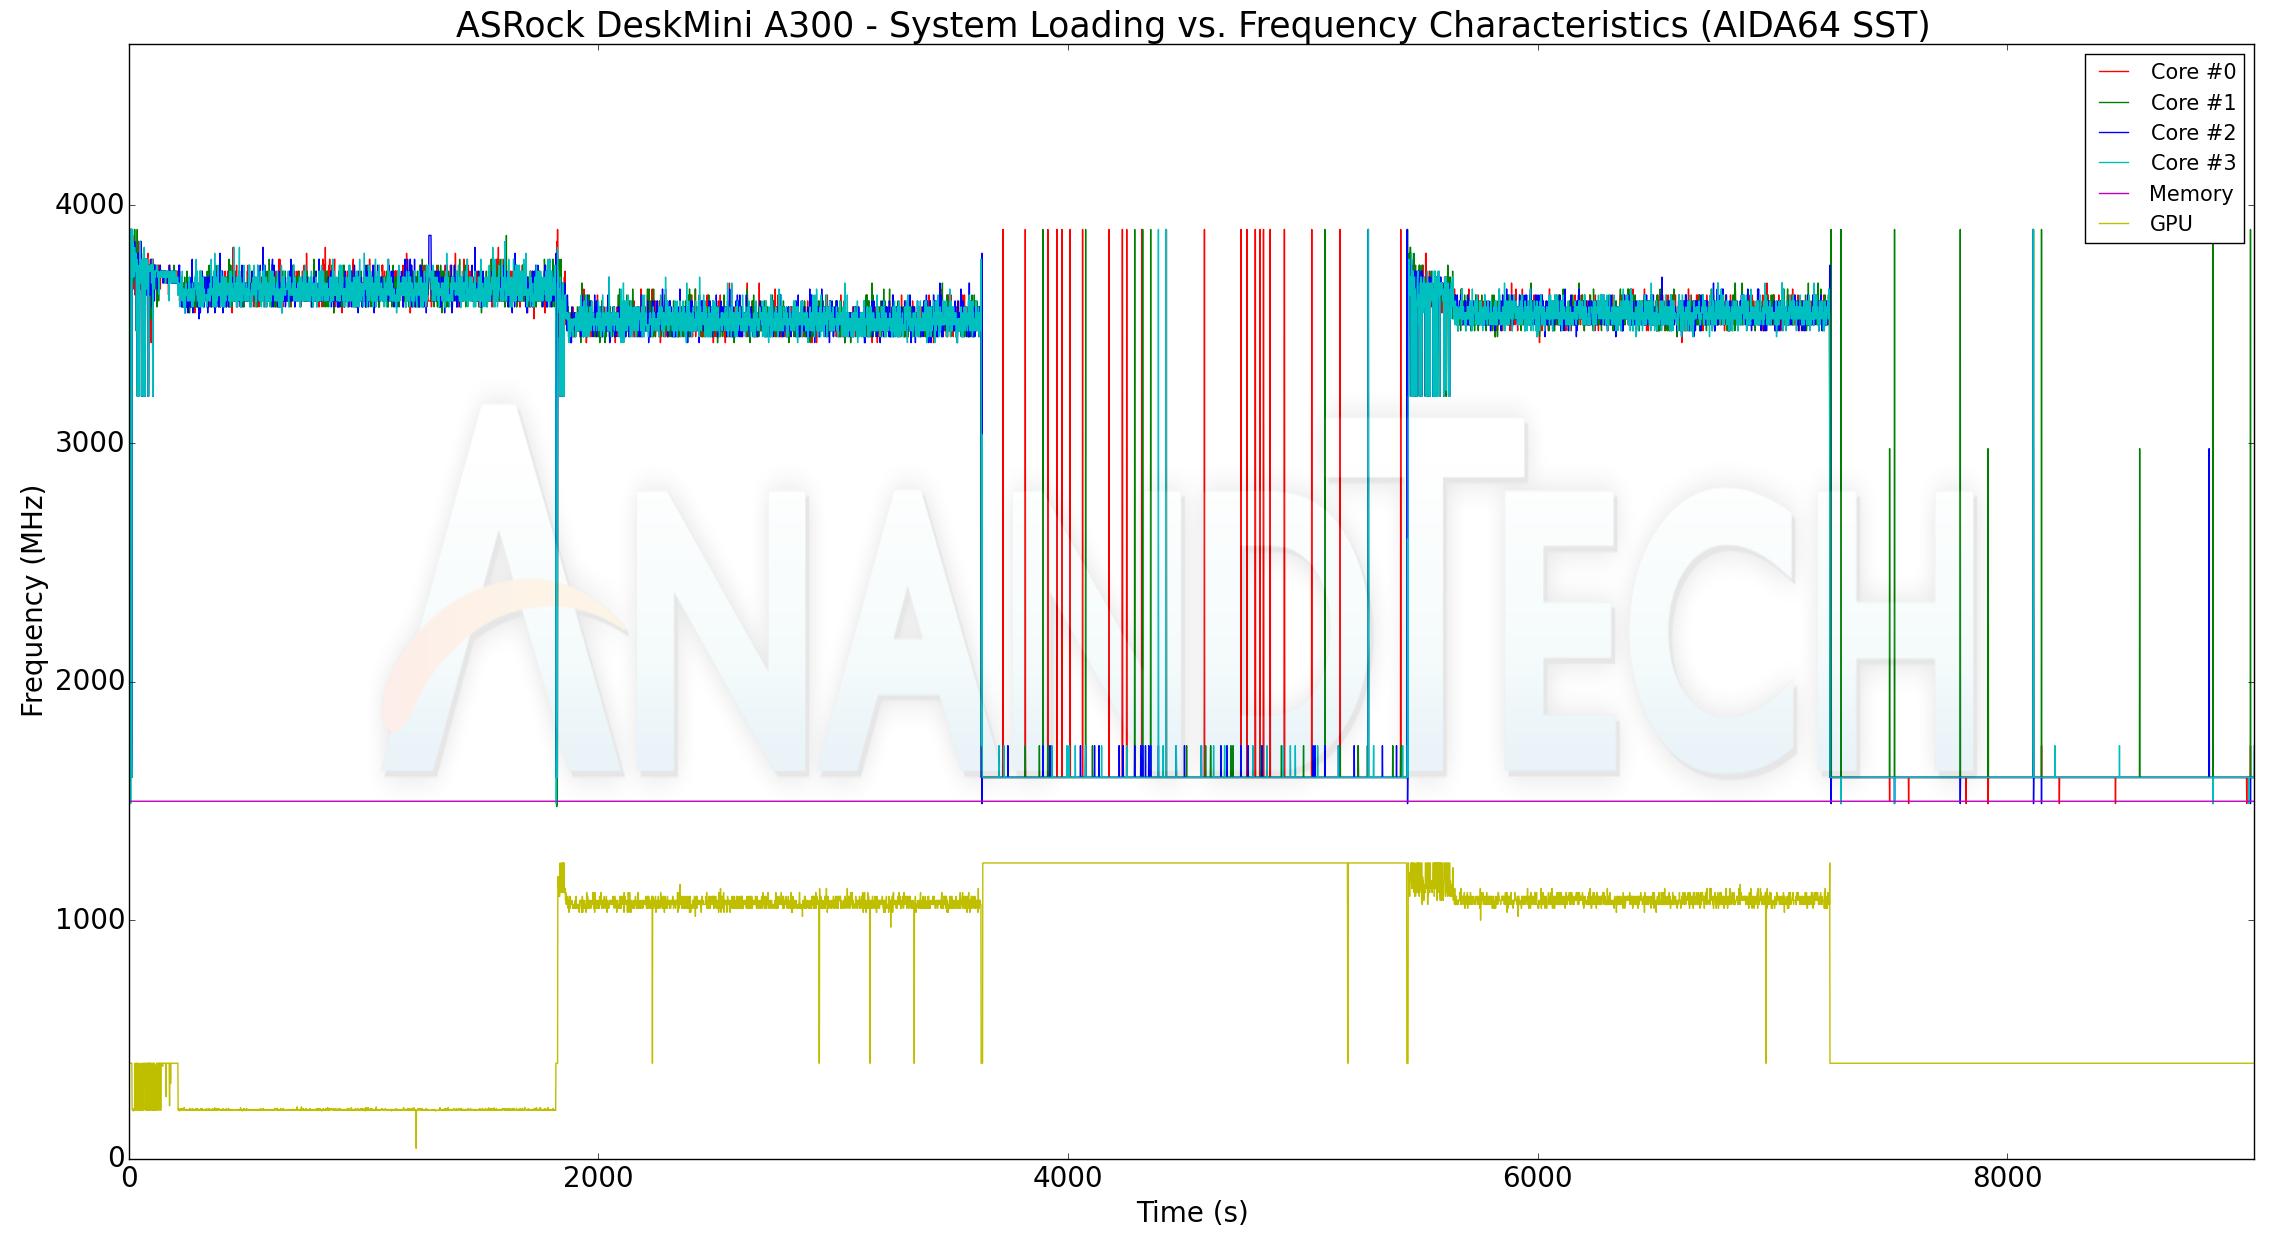
At the start of our stress routine, we see most of the cores at the boost clock (3.9 GHz), but, the temperature quickly approaches 78C. The DeskMini A300 BIOS seems to treat that as the indicator to bring down the cores to the base clock of 3.6 GHz. In this initial period, the package power (labeled as reported, but, is more likely to be the power consumption of the x86 cores alone) is around 35W. That drops down to 30W after the cores go back to the base clock. After adding the GPU loading, the cores clocks do go down a bit to around 3.4 GHz (as the GPU ramps up from around 200 MHz to around 1.1 GHz). The reported package power remains constant at 30W. Unlike the reported package power, the at-wall power consumption provides hard irrefutable numbers. In the boost clock state, the wall power goes as high as 80W before settling down to around 72W. When the GPU load is added, the metric stabilizes around 85W. If the GPU alone is loaded, the core clocks jump down to 1.6 GHz, and the GPU starts running at the rated clock (1250 MHz). The at-wall consumption is around 43W. When stressing everything in the system, the added storage workload slightly bumps up the at-wall consumption by a couple of watts, but, other metrics remain similar to the second stage. The temperature of the cores never exceed 80C at any point in the AIDA64 system stability test.
We also run a custom stress test involving Prime95 and Furmark. Starting with Prime95 alone, we add Furmark to the mix after 30 minutes. After another 30 minutes of simultaneous CPU and GPU loading, we terminate the Prime95 process alone and let the GPU run at full throttle. The metrics graphed for the AIDA64 system stability test are also graphed here.
| ASRock DeskMini A300 System Loading with Prime95 and Furmark | |||
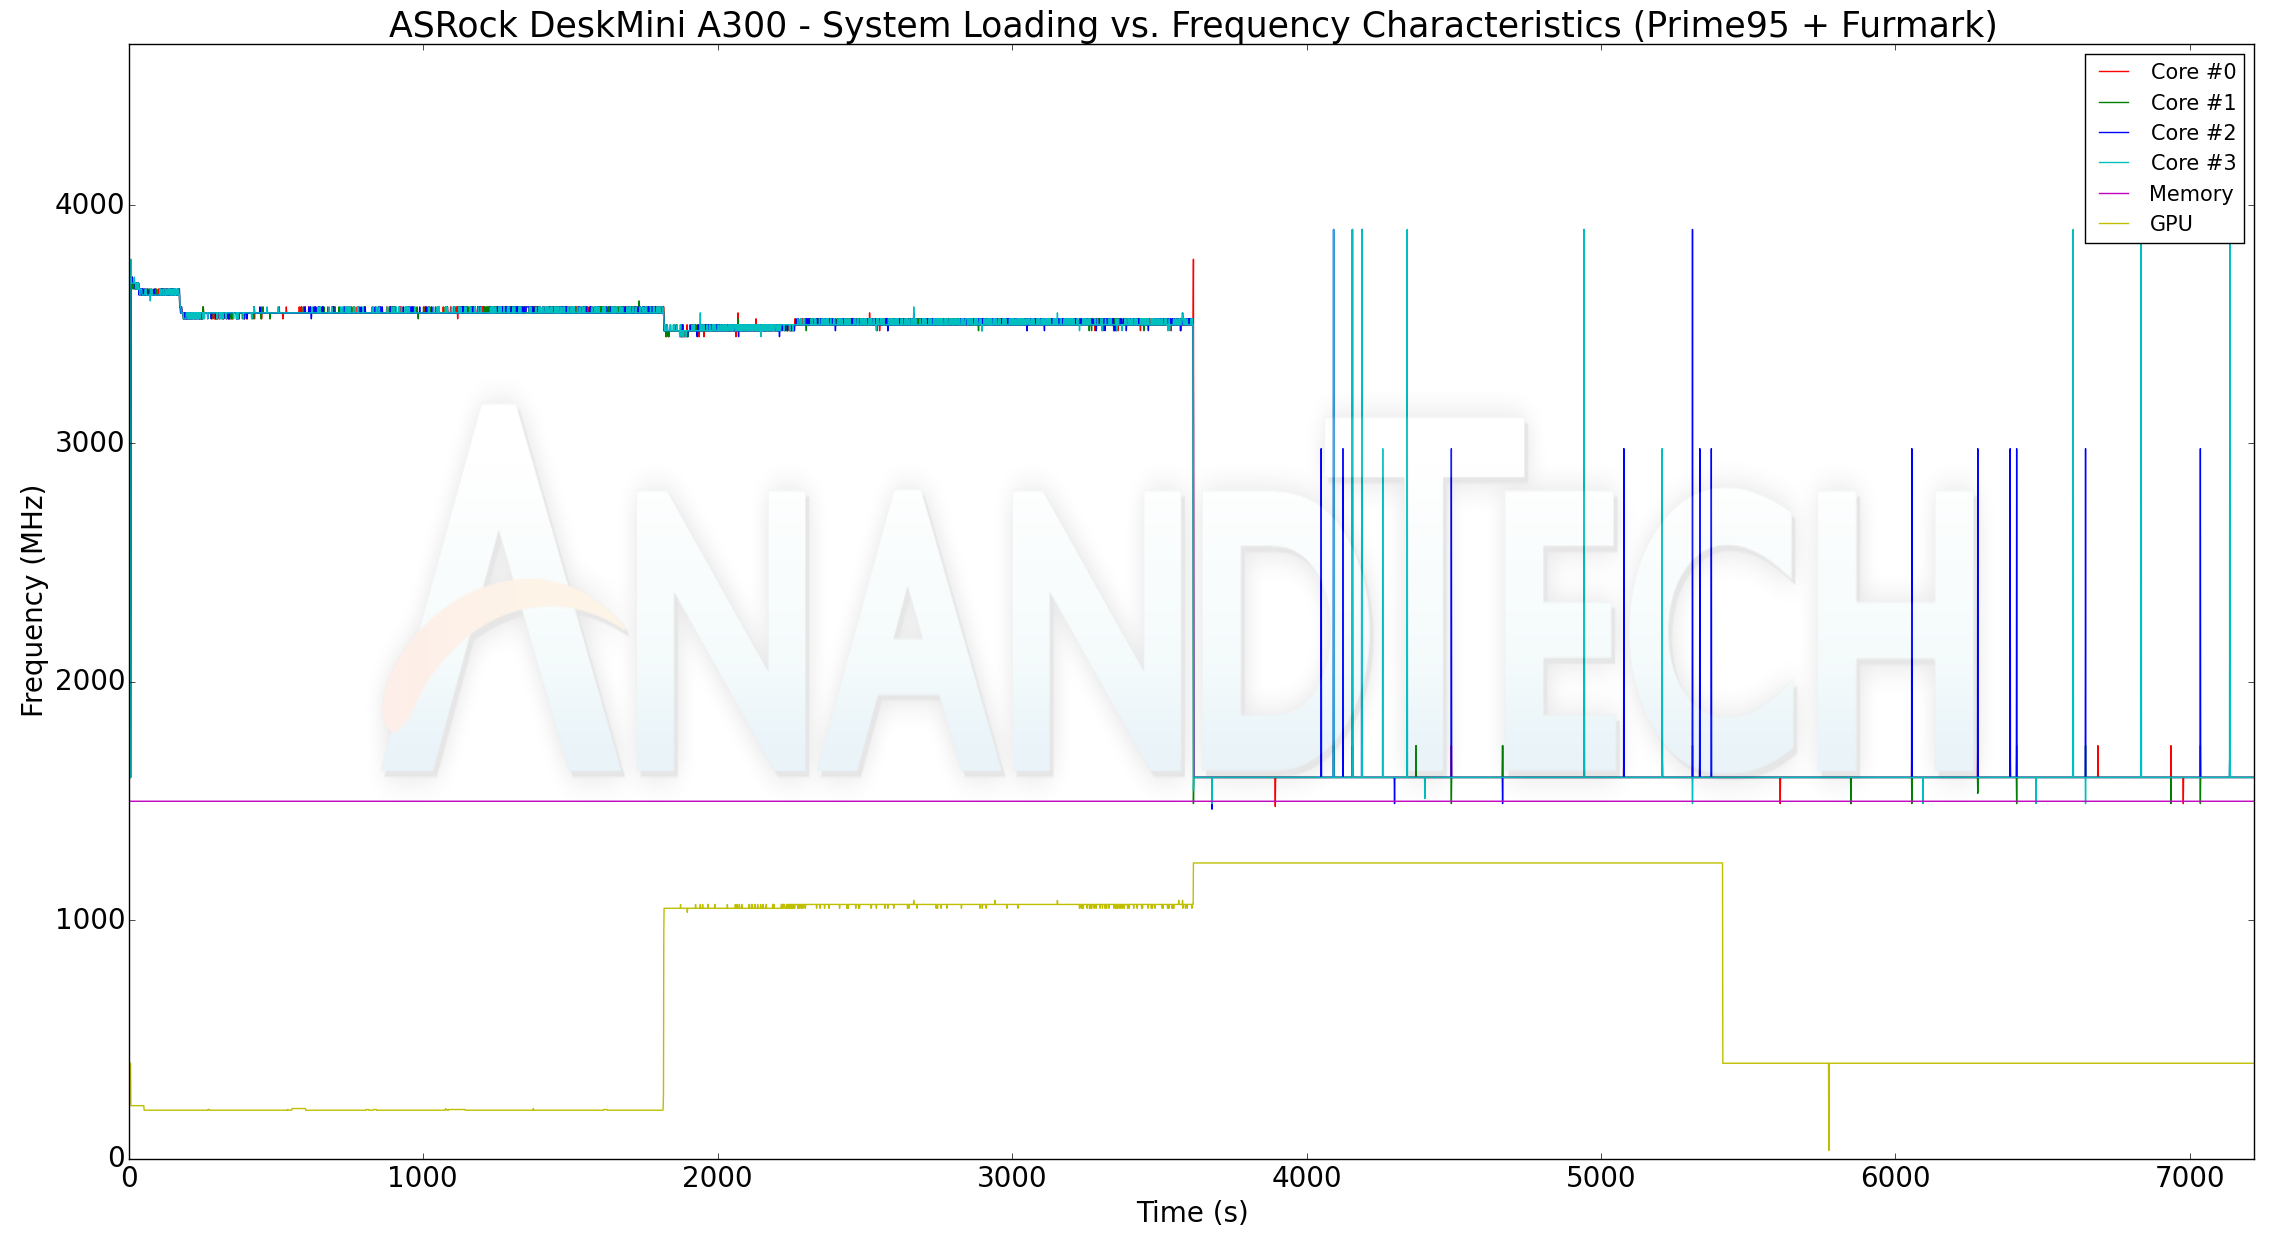
Interestingly, Prime95 doesn't trigger the boost clocks for the cores. Otherwise, the loading characteristics for the frequencies, temperature, and power are largely the same as what we observe with the AIDA64 system stability test workloads. The only thing of note is that Prime95 and Furmark together make the system consume north of 90W at the wall.
The thermal solution is very effective, ensuring that the temperatures never cross 80C while allowing the APU's CPU cores and GPU to operate at the advertised frequencies / rated power consumption. The 90W peak power consumption also indicates that the Ryzen 5 2400G is operating at its rated TDP of 65W in the DeskMini A300.


88 Comments
View All Comments
ganeshts - Friday, April 26, 2019 - link
Actually, it is OK with Kodi (XBMC) and Microsoft Edge / VideoUI app on Windows. It is only VLC and LAV Video Decoder having issues.DigitalFreak - Friday, April 26, 2019 - link
" The hardware itself is actually rather capable (as noted above), but the the current state of the Radeon drivers holds it back."Same old story that's been going on for a decade or more with ATI/AMD.
Irata - Friday, April 26, 2019 - link
Some more power consumption numbers: (A300 vs. A310)Idle power: 81%
Max power consumption (stressing CPU+GPU): 131%.
But this gives us:
- Gaming performance: no numbers for the A310, however the A300 has an average gaming performance of 204 % vs. Bean Canyon (using the fps shown as default) at 126 of its power consumption, so again it is more power efficient.
Cinebench Muti-threaded rendering: 137% of he A310's performance @ (using the max power consumption as a guideline) 131% of the power consumption.
Note: It would be nice to show the power consumption for all benchmarks, i.e. gaming, 7-zip, cinebench....
Mil0 - Sunday, April 28, 2019 - link
I was thinking along this lines, thanks for doing the math. It seems the A300 is basically always more power efficient.Especially given that machines like this will spend a lot of time at or near idle. If the light load scenario comes close to the 81% power usage, in the long run this could save quite a bit of power.
niva - Monday, April 29, 2019 - link
So you guys are reaching a different conclusion than what the article stated in terms of efficiency?In the conclusions paragraph it stated that this machine is "not particularly energy efficent."
I also glanced at the numbers initially and was confused as to how they reached that conclusion but didn't do math. Why did the author use that language?
mikato - Tuesday, April 30, 2019 - link
The language you refer to is the author comparing it to the Intel Mini-PC competitors, and not just the other ASRock DeskMini. Commenters Irata and Mil0 above were comparing DeskMini A300 vs DeskMini A310.Irata - Wednesday, May 1, 2019 - link
That is correct, although in the case of gaming results, I had to compare it to another system since there was no data for the A310.The thought was, how does the performance delta align with the power consumption delta. Now it seems that Ganesh disagrees as I am using linear values but imho this approach seems valid to me as well.
So if it has 10% less performance but uses 10% less power, at least for me the energy efficieny is identical. Same if it has 10% more performance but uses 10% more power.
plonk420 - Saturday, May 4, 2019 - link
never had an issue with drivers on AMD except for an edge case: trying to install newer ones on Windows Server 2008 R2 Enterprise.sadly this might be an issue with the disconnect between OEM and AMD's drivers
Irata - Friday, April 26, 2019 - link
I found this a bit odd:"For traditional office and business workloads, it gets the job done; and while it's not particularly energy efficient, the upfront cost itself is lower".
Looking at the Bapco Sysmark overall power consumption numbers, the DeskMini A300 and 310 have basically identical numbers (32.26 vs. 31.62 Wh). Seeing the the performance delta is not considerable I find this statement a bit odd. And these are Bapco Sysmark numbers which need to be taken with a rock of salt.
davie887 - Friday, April 26, 2019 - link
Intel CAN'T be shown in anything other that their best light.Anyone who questions them has to prepare for the consequences :D