Intel's Bean Canyon (NUC8i7BEH) Coffee Lake NUC Review - Ticking the Right Boxes
by Ganesh T S on April 3, 2019 8:00 AM EST- Posted in
- Systems
- Intel
- NUC
- UCFF
- Thunderbolt 3
- Cannon Point
- Coffee Lake-U
UL Benchmarks - PCMark, 3DMark, and VRMark
This section deals with a selection of the UL Futuremark benchmarks - PCMark 10, PCMark 8, 3DMark, and VRMark. While the first two evaluate the system as a whole, 3DMark and VRMark focus on the graphics capabilities.
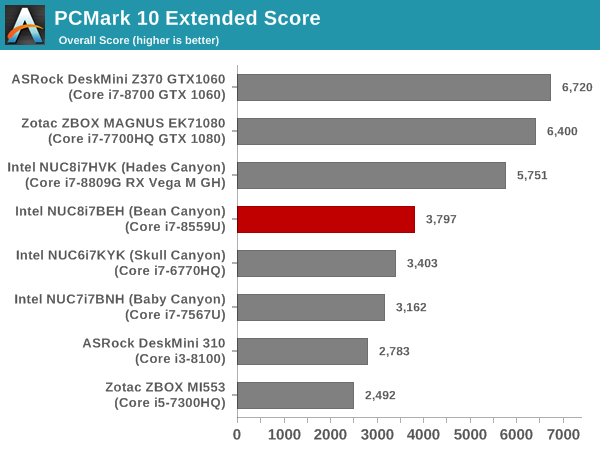
PCMark 10
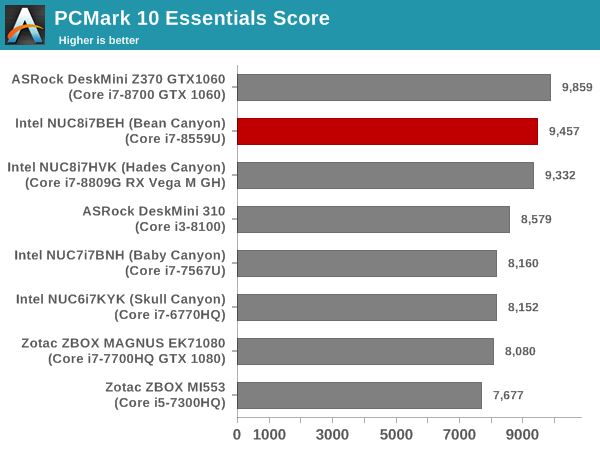
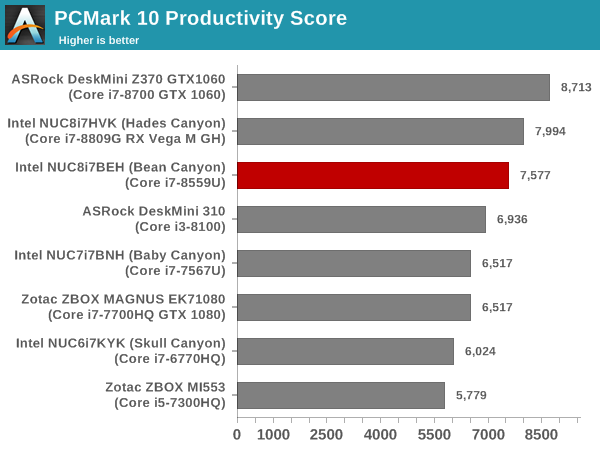
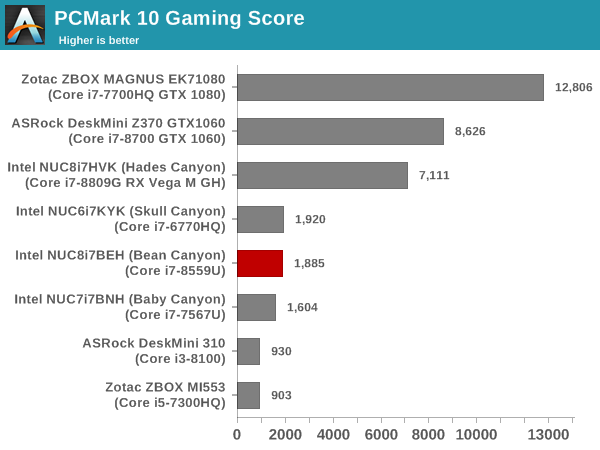
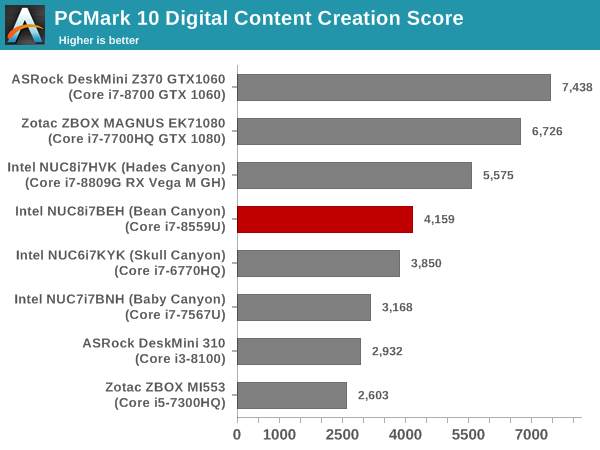
UL's PCMark 10 evaluates computing systems for various usage scenarios (generic / essential tasks such as web browsing and starting up applications, productivity tasks such as editing spreadsheets and documents, gaming, and digital content creation). We benchmarked select PCs with the PCMark 10 Extended profile and recorded the scores for various scenarios. These scores are heavily influenced by the CPU and GPU in the system, though the RAM and storage device also play a part. The power plan was set to Balanced for all the PCs while processing the PCMark 10 benchmark.
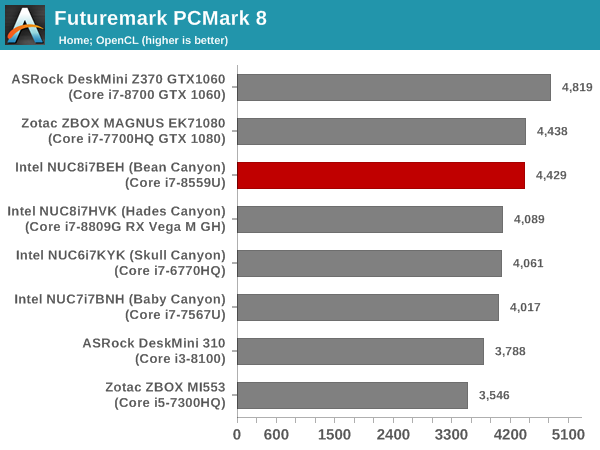
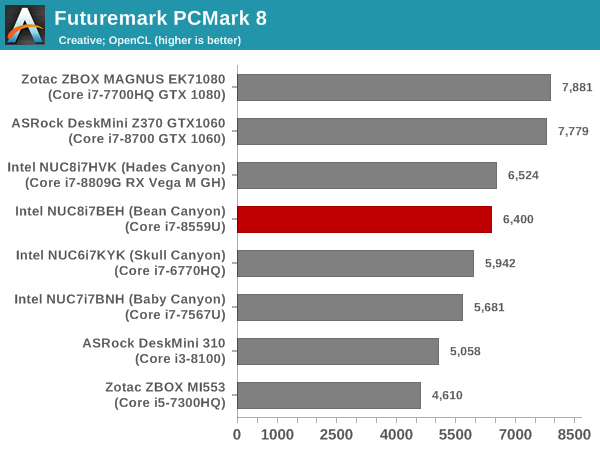
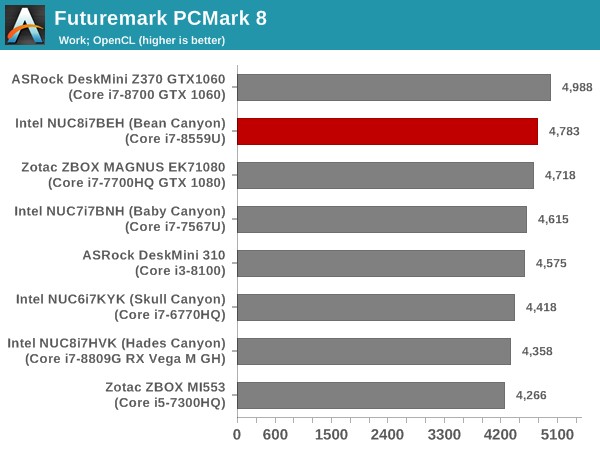
PCMark 8
We continue to present PCMark 8 benchmark results (as those have more comparison points) while our PCMark 10 scores database for systems grows in size. PCMark 8 provides various usage scenarios (home, creative and work) and offers ways to benchmark both baseline (CPU-only) as well as OpenCL accelerated (CPU + GPU) performance. We benchmarked select PCs for the OpenCL accelerated performance in all three usage scenarios. These scores are heavily influenced by the CPU in the system.
3DMark
UL's 3DMark comes with a diverse set of graphics workloads that target different Direct3D feature levels. Correspondingly, the rendering resolutions are also different. We use 3DMark 2.4.4264 to get an idea of the graphics capabilities of the system. In this section, we take a look at the performance of the Intel NUC8i7BEH (Bean Canyon) across the different 3DMark workloads.
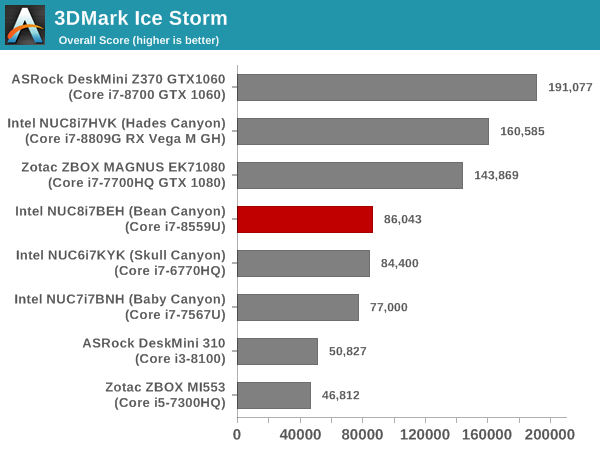
3DMark Ice Storm
This workload has three levels of varying complexity - the vanilla Ice Storm, Ice Storm Unlimited, and Ice Storm Extreme. It is a cross-platform benchmark (which means that the scores can be compared across different tablets and smartphones as well). All three use DirectX 11 (feature level 9) / OpenGL ES 2.0. While the Extreme renders at 1920 x 1080, the other two render at 1280 x 720. The graphs below present the various Ice Storm workloads' numbers for different systems that we have evaluated.
| UL 3DMark - Ice Storm Workloads | |||
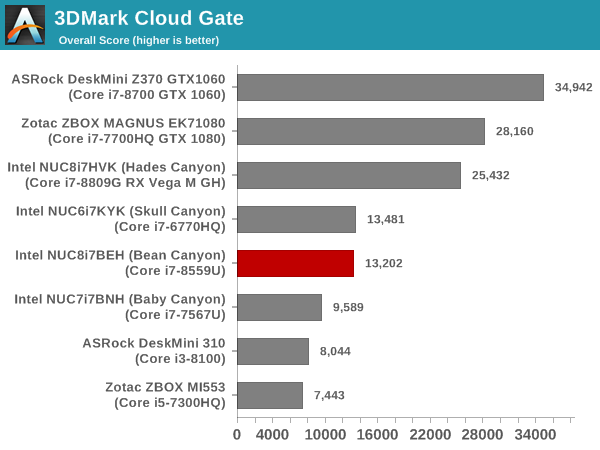
3DMark Cloud Gate
The Cloud Gate workload is meant for notebooks and typical home PCs, and uses DirectX 11 (feature level 10) to render frames at 1280 x 720. The graph below presents the overall score for the workload across all the systems that are being compared.
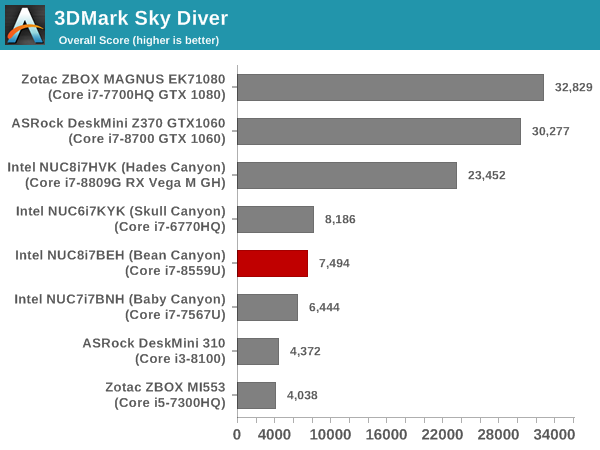
3DMark Sky Diver
The Sky Diver workload is meant for gaming notebooks and mid-range PCs, and uses DirectX 11 (feature level 11) to render frames at 1920 x 1080. The graph below presents the overall score for the workload across all the systems that are being compared.
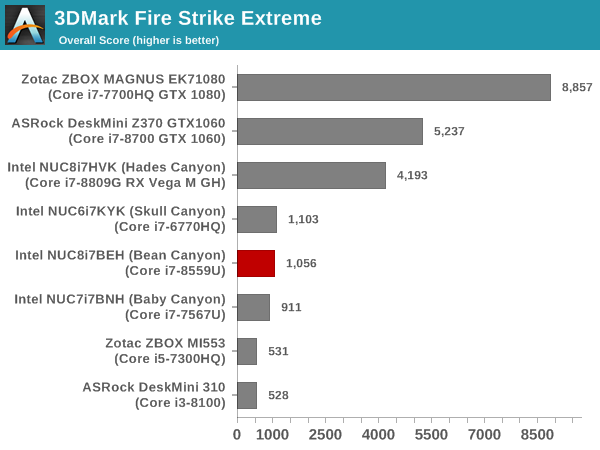
3DMark Fire Strike Extreme
The Fire Strike benchmark has three workloads. The base version is meant for high-performance gaming PCs. Similar to Sky Diver, it uses DirectX 11 (feature level 11) to render frames at 1920 x 1080. The Ultra version targets 4K gaming system, and renders at 3840 x 2160. However, we only deal with the Extreme version in our benchmarking - It renders at 2560 x 1440, and targets multi-GPU systems and overclocked PCs. The graph below presents the overall score for the Fire Strike Extreme benchmark across all the systems that are being compared.
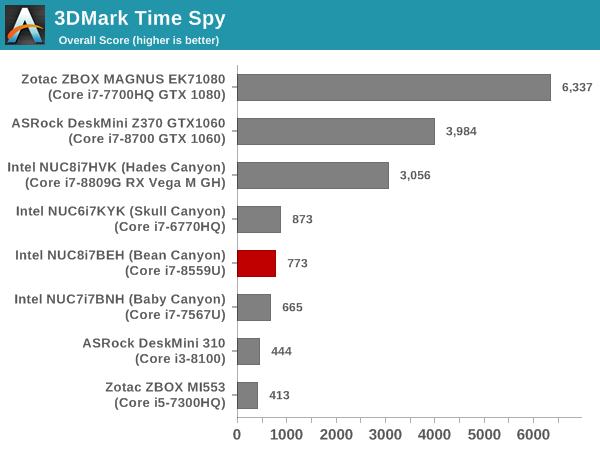
3DMark Time Spy
The Time Spy workload has two levels with different complexities. Both use DirectX 12 (feature level 11). However, the plain version targets high-performance gaming PCs with a 2560 x 1440 render resolution, while the Extreme version renders at 3840 x 2160 resolution. The graphs below present both numbers for all the systems that are being compared in this review.
| UL 3DMark - Time Spy Workloads | |||
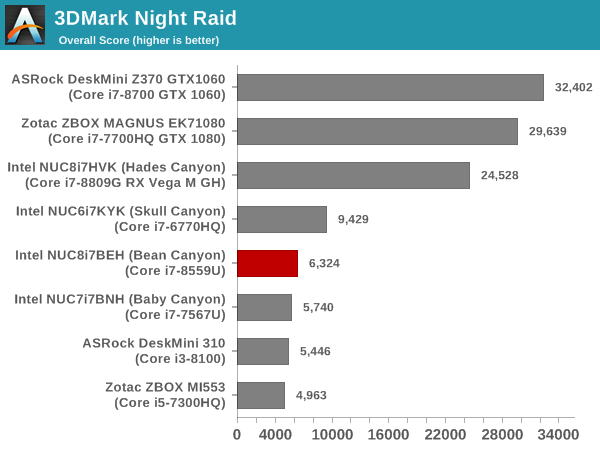
3DMark Night Raid
The Night Raid workload is a DirectX 12 benchmark test. It is less demanding than Time Spy, and is optimized for integrated graphics. The graph below presents the overall score in this workload for different system configurations.
The VRMark Professional Edition v1.2.1701 comes with three rooms. Each room can be run either in desktop or HMD mode, with varying minimum requirements for the same workload. The benchmark results include the average FPS achieved, and a score based on the FPS. A pass or fail indicator is also provided based on whether the average FPS exceeds the required FPS. In this section, we take a look at the performance of the Intel NUC8i7BEH (Bean Canyon) on a comparative basis across the three workloads in desktop mode.
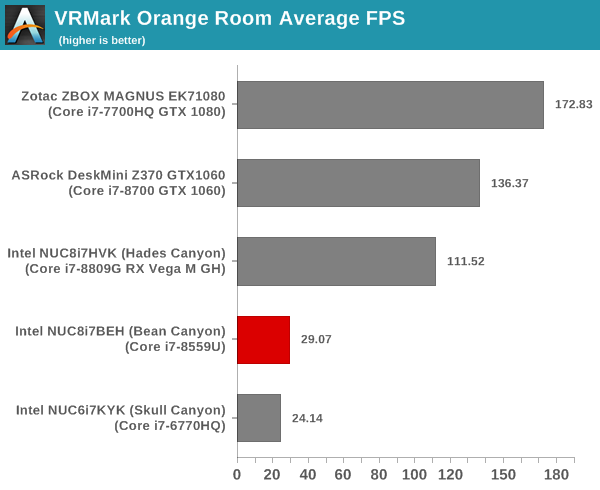
VRMark Orange Room
The Orange Room is meant to test the effectiveness of a system for handling the requirements of the HTC Vive and the Oculus Rift. The recommended hardware for both VR HMDs should be able to easily achieve the desired target FPS (88.9 fps). However, in the desktop mode, the target performance is 109 fps without any frame drops. Systems benching with an average FPS lesser than that are deemed to have failed the VRMark Orange Room benchmark. The graphs below present the average FPS and score for the different systems being considered today.
| UL VRMark - Orange Room | |||
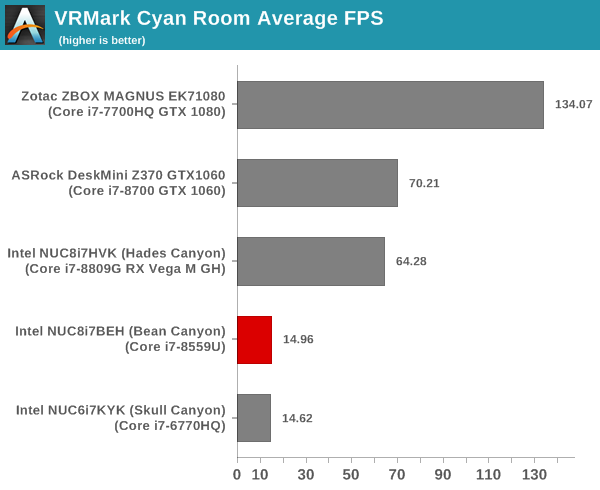
VRMark Cyan Room
The Cyan Room sits between the Orange and Blue rooms in complexity. It is a DirectX 12 benchmark. Similar to the Orange room, the target metrics are 88.9 fps on HMDs and 109 fps on the desktop monitor. The graphs below present the average FPS and score for the different systems being considered today.
| UL VRMark - Cyan Room | |||
VRMark Blue Room
The Blue Room is the most demanding of the three workloads. At the time of introduction of VRMark in October 2016, no publicly available system running as sold was able to pass the test. The performance of a system in this benchmark is an indicator of its VR-readiness for future generation of HMDs. Similar to the other workloads, the passing performance metrics are 88.9 fps on HMDs and 109 fps on desktop monitors. The complexity of the workload is due to the higher resolution (5012 x 2880) and additional geometry making it necessary to increase the number of Direct3D API calls. The graphs below present the average FPS and score for the different systems being considered today.
| UL VRMark - Blue Room | |||
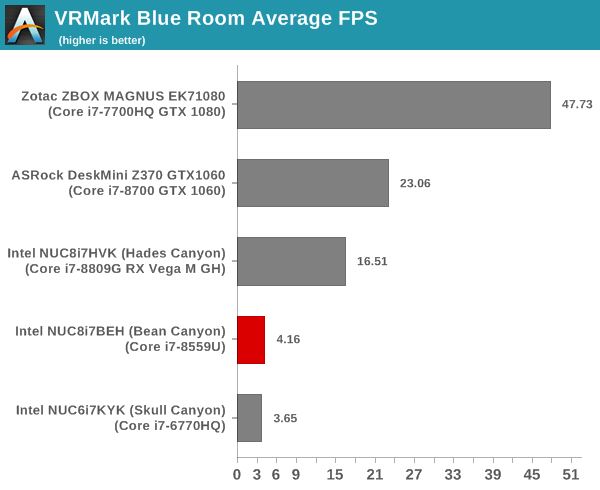
As expected, the integrated GPU is not VR-capable. However, the Thunderbolt 3 port can be used to hook up a VR-capable eGPU in an eGFX enclosure, if needed.


81 Comments
View All Comments
DimeCadmium - Thursday, April 4, 2019 - link
You do realize the skull doesn't have to be visible?PeachNCream - Thursday, April 4, 2019 - link
It's not just the morbid case cover that bothers me. The fact is that the brand name in general is something that discourages my interest in an otherwise solid computing device. I don't need death or bones or corpse-like branding on my computer parts. That kind of thing has a way of crawling into your head and sticking around in there. It may seem trivial, but to someone that has had to see and deal with real world violence, it just isn't something I want associated with something I use for work and play at home.GreenReaper - Thursday, April 4, 2019 - link
What I want to know is this: where are all these canyons? Time was, codenames were based on actual locations, but nowadays I'm not sure. There's nothing on Google Maps...mikato - Thursday, April 4, 2019 - link
Me too. And if Bean Canyon isn't a real place, then I can't understand how such a ridiculous name would be used for a CPU.MrCommunistGen - Wednesday, April 3, 2019 - link
I'm not at all disagreeing with your point -- Intel has made pretty substantial gains in efficiency -- but we should all just remember that the CPUs in both systems are probably blowing WAY past their TDP (non-turbo) ratings to achieve the performance we're seeing in these benchmarks.MrCommunistGen - Wednesday, April 3, 2019 - link
I kept not finding the Power Consumption figures in the article. Under a full CPU + GPU load it looks like Bean Canyon is pulling ~72W at the wall and Skull Canyon is pulling ~77W at the wall.Still impressive since Bean Canyon tends to be a bit faster and has a smaller GPU configuration.
IntelUser2000 - Wednesday, April 3, 2019 - link
Skull Canyon just sucks. It should be performing 30-50% faster than this one. No wonder nothing outside of a single Intel NUC used it. The previous two Iris Pros sucked too. Each generation made it worse.FATCamaro - Wednesday, April 3, 2019 - link
These make a Mac mini look like a deal.cacnoff - Wednesday, April 3, 2019 - link
Ganesh,"Perhaps an additional Thunderbolt 3 controller directly attached to the CPU's PCIe lanes could make the platform look even more attractive."
This is a 14nm U-Series Part, there are no CPU PCIe lanes on it. Maybe complain about the U-Series parts not having pcie on the cpu package rather than about the NUC not having a feature that is impossible to support.
jordanclock - Wednesday, April 3, 2019 - link
You sure about that? Ark pretty clearly lists the 8559U has having 16 PCIe lanes.