The Samsung Galaxy S10+ Snapdragon & Exynos Review: Almost Perfect, Yet So Flawed
by Andrei Frumusanu on March 29, 2019 9:00 AM ESTMemory Subsystems Compared - Latency
Memory is an integral part of a CPU’s performance. We all know that fundamentally memory performance can be summarised into two metrics: The delay it takes to actually access a certain piece of memory, meaning the memory latency, and how much of this memory you can transfer in a given amount of time, meaning the memory throughput, or memory bandwidth. Traditionally, things have been relatively straightforward in terms quantising these metrics, in recent years however, and in particular with this new generation of CPUs, we see things get quite complicated as components such as a CPU’s memory prefetchers can blur the lines between what the physical capabilities of the hardware are and what is actually happening in the real-world.
To better investigate these topics over the last few weeks I’ve invested a bit of time into rewriting our memory test tools from scratch and to attempt to better divulge characteristics of today’s modern CPUs. Unfortunately nowadays publishing a single figure for memory latency isn’t sufficient to properly characterise the memory performance of a platform, and in particular it might not be a valid comparison figure when comparing things between different platforms.
In terms of memory latency tests, the main tools at use are still a variety of pointer-chasing patterns, designed to target different parts of the microarchitectures and bring to light hardware characteristics. In the following page, I can summarize the followings data-points and what they do:
- TLB Trash: This is a simple pattern designed to randomly touch a single cache line per memory page. The goal here is to determine the TLB miss penalty at different TLB levels, and it also exposes the page capacity for each TLB level. Because we’re only touching a single cache line, the actual cache pressure is at an absolute minimum which means for the majority of platforms the actual used memory should fit into L2 caches.
- Full Random: This is a worst case scenario in terms of memory latency. We’re traversing a fully random chain of cache lines throughout the full buffer region. The latency exposed here not only will contain the hardware access latencies, but if the buffer size exceeds the TLB capacity, it will also contain a great amount of TLB miss penalties.
- R per R page: Randomly traverse a random page in the buffer. We also fully randomly access the cache lines within a page, making sure we touch all cache lines before we move on to the next random page.
- R Disjointed, R Spread: Variations of the previous test, but with some permutations in order to attempt to fool some prefetchers.
- R in Range nP/n*pagesizeKB: The memory buffer is dissected into regions of a given size and the regions are randomly traversed. Same principle as R in R page, however at different region sizes.
- R in RV prange: Same as previous, however with non-constant page regions varying from 1 to 32 times page size.
In general, the patterns that matter the most are the TLB Trash, Full Random and for some chipsets the R Disjointed pattern. The latter I mention because I found it to generally be able to fool some of the classical prefetchers. The range patterns are generally caught by most prefetchers nowadays as well, however it’s still interesting to see the results just to have an idea of how aggressive the prefetchers are, and latency curve itself can also reveal different cache latency levels or when one reaches DRAM for certain.
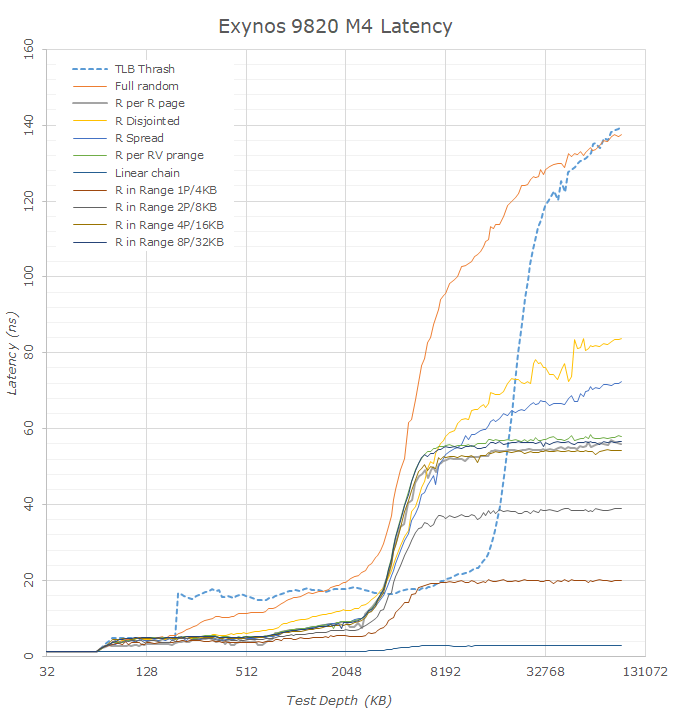
Starting off with the Exynos 9820 on the new M4 cores, we already see a huge difference in the latency behaviour, with the chip showing very different figures than those of the Exynos 9810. To analyse the M4/M3 cores against other microarchitectures we have to keep in mind Samsung’s more unusual TLB hierarchy. The M3 and M4 cores besides the A12’s Vortex cores are the only CPUs whose TLB capacity actually exceeds the equivalent cache hierarchy capacity by a noticeable margin.
Looking at the TLB Trash curve in particular we can see one improvement of the new M4 core is that it upped the size of the microTLB from 32 pages up to 48 pages. Samsung still has an extremely weird behaviour here where if one accesses just a single page more than the capacity of the microTLB then the latency suddenly jumps in a cliff-edge fashion as if the microTLB would no longer be used at all. This is contrasting to the all other CPU cores which have a more gradual transition until the accessed page count is more than double the lowest level TLB capacity, meaning the latency we’re seeing is a gradually raising mix of the lowest level TLB latency plus the next level TLB lookup latency.
As just mentioned, because of the 4096 entry main TLB of the M3/M4, we’re seeing the TLB latency curve go beyond what we actually have in terms of total cache capacity. This has an interesting effect in the full random latency figures of the Exynos 9810 and Exynos 9820 as we have a window between 4MB and ~16MB which in theory contains little to no TLB misses. Looking at the linear and prefetched patterns we see that things flatten out after 7-8MB which signals the end of the effects the cache hierarchy has on the test. Taking this window as an apples-to-apples comparison between the SoCs we see that latencies have gone down from ~124ns on the Exynos 9810 to ~95ns on the Exynos 9820. In theory this latency decrease should be structural to the design of the SoC and its memory controllers, which matches Samsung’s PR about the chip in saying they have made big upgrades in this regard.
Another interesting characteristic we can see is that many of the remaining patterns show drastically lower latency. Instead of showing some kind of structural improvements of the SoC, the actual cause here is the introduction of a new prefetcher on the M4. Here we see the usage of a new spatial memory stream prefetcher which is able to identify higher-level region and depth information in access patterns. Unfortunately for our test tools this means that many of the patterns become useless in terms of determining actual hardware latencies as we can no longer fool the prefetchers.
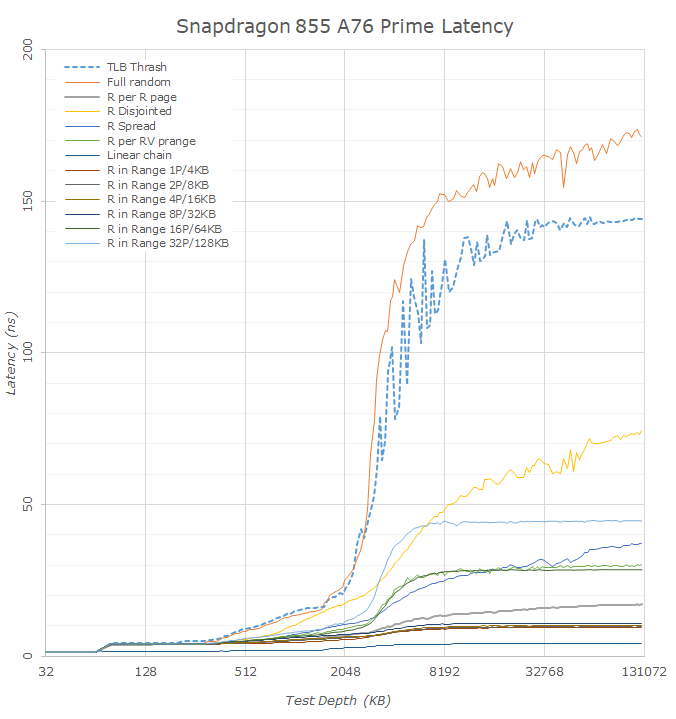
Switching over to the Snapdragon SoCs, we can use a similar methodology to compare the Snapdragon 855 to the Snapdragon 845. It’s to be noted that in terms of the figures here it’s not an apples-to-apples to the Exynos SoC, and the Cortex A75 and A76’s L2 TLB has only 1024 4K page entries, meaning page-table-walk free latency figures are only available till 4MB for the full-random data. Keeping this in mind we can see that the estimated latency from CPU to an active DRAM page is about the same at around 140ns for both SoCs. It’s actually hard to determine the exact figure here as the things vary quite a lot depending what point on the curve we’re measuring. Again, this figure would include page-walk latencies; Qualcomm’s actual structural latency would indeed be much better, around the 90ns figure as shown by some of the patterns on the Snapdragon 845.
What has actually improved drastically in the Snapdragon 855 is the deeper DRAM latency. I didn’t actually go ahead and measure larger test depths, but we can already see there’s a massive difference between the S845 and S855. The former started exceeding 200ns at 128MB while the S855 falls in at 170ns at the same point. Fundamentally this is a structural change in how Qualcomm configures its DRAM architecture in terms of banks and ranks, and greatly improves on some of the bigger latency issues of the Snapdragon 845.
One other thing to note about the new Snapdragon 855 and which also applies to the Kirin 980 is the way the other patterns behave. Arm states that the new Cortex A76 has new state-of-the-art prefetchers and looking at what the CPU is able to do one my patterns I’d very much agree with this claim. Compared to other microarchitectures including Apple’s and Intel’s latest, the Cortex A76 prefetchers are making mince-meat out of my patterns showing the lowest latencies of any platform on the market right now. I tried for a bit trying to design something that would fool the prefetchers but this is something I’ll have to continue working on. The nature of region-based prefetchers means that fundamentally any patterns which has some sort of higher-level repeatability will get caught and predicted, which unfortunately means designing a structured test other than a full random pattern is a bit complicated to achieve.
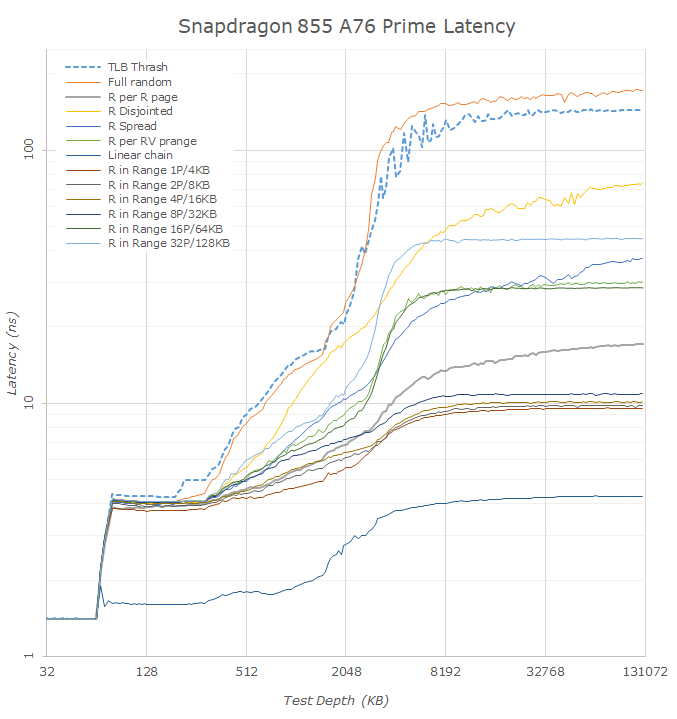
Switching over from linear graphs to logarithmic graphs this makes transitions in the cache hierarchies easier to analyse.
In the Exynos 9820 M4 results we again see the odd microTLB to mid-TLB behaviour. Interestingly the data would suggest the M4 cores only have access to 3MB of the L3. This would possibly make sense for the Exynos 9820 if the 1MB slice wound be reserved for the A55 and A75 cores. Looking back at the Exynos 9810 data however we see a similar result where the latencies jump at exactly 3MB. That chip didn’t share the L3 with the A55 cores as far as I’m aware, and if Samsung hadn’t confirmed there’s 4MB of L3 on the chip I would have said there was 3MB. I’m not too certain what’s going on here and what happened to that 1MB on the Exynos 9810.
The new A75 cores on the Exynos 9820 very much look like having 256KB L2 caches, and the L3 results points out to being 1MB. What I do find weird is the very long and gradual latency increase the deeper we go into DRAM, as opposed to a more sudden jump. I would attribute this again to how the DRAM banks and ranks are configured on the new chip.
On the Snapdragon 855 we see the 512KB vs 256KB L2 cache difference between Prime and Gold cores. A weird behaviour for which I have no explanation is the latency behaviour between the two cores in the 2-5MB region. Looking at the data, it looks as if the middle cores would have more cache available to them, with the curves being positioned more akin to the behaviour of the Kirin 980 than the Snapdragon 855’s Prime cores. I would have guessed that the Prime cores are bypassing the system level cache/SLC while the Gold cores have access to it, however after having reached out to Qualcomm on the matter they said this was not the case. Thus I remain a bit baffled on what is going on, it's possible this is just measurement noise and there was some activity on the LLC while I testing the Gold cores.
Comparing the L3 curves between the Snapdragon 855 and the Kirin 980 we see the former have better latencies. We don’t know what frequency HiSilicon is running their L3 at, but this lower latency on the part of the Snapdragon could also be due to Qualcomm’s choice of a smaller 2MB cache versus 4MB on the Kirin.
This is also a good opportunity to put Apple’s A12 Vortex core in context. One advantage Apple has in terms of memory architecture is that iOS uses 16KB pages versus 4KB on Android and Windows. While this is a negative for memory allocation space, it’s a positive for performance as there’s less TLB work to be done. Here Apple’s memory hierarchy is quite absurd as it’s just outright flat at excellent latencies till about 3MB, after which some complex TLB behaviour comes into effect.


229 Comments
View All Comments
xian333c - Wednesday, April 17, 2019 - link
How to buy that unicorn on table in ur shout?Brightontech - Sunday, April 21, 2019 - link
it is an awesome phone<a href="https://www.brightontech.net/2019/04/audiovideo-ed... Editor and Video Converter</a>
Video Editor and Video Converter
Jhereck - Tuesday, April 23, 2019 - link
Hi Andrei another question regarding the patch designed to increase PELT resonsiveness : is there any way a third party kernel can include it, therefore making s9 and s10 the devices they should be ?You know like last year when you tried to play with s9 exynos kernel in order to match snapdragon power and power efficency ?
Thanks in advance
Rixos - Thursday, May 2, 2019 - link
It's kind of sad, I was actualy looking at the s10e as a replacement device for my galaxy S7 but as I live in Europe I would be getting the Exynos variant. Worse audio quality, less processing power and worse camera results. Basically seeing this kind of ruined the purchase for me. In some sense I wish I would not have seen it, the S10e is likely still a great upgrade for my S7 but knowing that there is a better version out there just ruins it for me. I guess ignorance sometimes really is bliss.theblitz707 - Thursday, May 23, 2019 - link
I see this is in every review. I actually went to stores and used my phones ambient light sensor and an another phones flashlight to measure display brightnesses. Although slightly inaccurate lg g7 gave a 1050lux reading with boost on.(all test on apl100) Taking that as a base s9 plus did 1020 s10 plus did 1123 and p20 pro did around 900 when i shone my flashlight to each sensor. So why everyone makes it seem like they are less bright than they actually are? Does using a flashlight to trigger high brightness impossible to imagine? Let me tell you those oled screens get very bright with high ambient light like outside on a sunny day.ballsystemlord - Monday, June 3, 2019 - link
Spelling and grammar corrections. I did not read the whole thing, so there maybe more.Samsung new L3 cache consists of two different structures
Possesive:
Samsung's new L3 cache consists of two different structures
Similarly, the A75's should be a ton more efficient the A55 cores at the upper performance points of the A55's.
Missing "than":
Similarly, the A75's should be a ton more efficient than the A55 cores at the upper performance points of the A55's.
Arm states that the new Cortex A76 has new state-of-the-art prefetchers and looking at what the CPU is able to do one my patterns I'd very much agree with this claim.
Missing "to":
Arm states that the new Cortex A76 has new state-of-the-art prefetchers and looking at what the CPU is able to do to one my patterns I'd very much agree with this claim.
The nature of region-based prefetchers means that fundamentally any patterns which has some sort of higher-level repeatability will get caught and predicted, which unfortunately means designing a structured test other than a full random pattern is a bit complicated to achieve.
"have" not "has" and a missing y:
The nature of region-based prefetchers means that fundamentally any patterns which have some sort of higher-level repeatability will get caught and predicted, which unfortunately means designing a structured test other than a fully random pattern is a bit complicated to achieve.
Switching over from linear graphs to logarithmic graphs this makes transitions in the cache hierarchies easier to analyse.
Excess "this" and analyze is with a "z":
Switching over from linear graphs to logarithmic graphs makes transitions in the cache hierarchies easier to analyze.
Indeed one of the bigger microarchitectural changes of the core was the addition of a second data store unit.
Missing comma:
Indeed, one of the bigger microarchitectural changes of the core was the addition of a second data store unit.
...we see that in the L3 memory region store curve is actually offset by 1MB compared to the flip/load curves, which ending only after 3MB.
"ed" not "ing":
...we see that in the L3 memory region store curve is actually offset by 1MB compared to the flip/load curves, which ended only after 3MB.
"Traditionally such misses are tracked by miss status holding registers (MSHRs), however I haven't seen Arm CPUs actually use this nomenclature."
This is almost certainly a run on sentence with missing punctuation. Try:
"Traditionally, such misses are tracked by miss status holding registers (MSHRs). However, I haven't seen Arm CPUs actually use this nomenclature."
"Again to have a wider range of performance comparison across ARMv8 cores in mobile here's a grand overview of the most relevant SoCs we've tested:"
Missing comma:
"Again, to have a wider range of performance comparison across ARMv8 cores in mobile here's a grand overview of the most relevant SoCs we've tested:"
giallo - Monday, June 17, 2019 - link
how much did they pay you to write this bullshit? you must be true downstheblitz707 - Monday, August 19, 2019 - link
i discovered something about display brightness on oleds recently. I did a test with a7 with auto brightness on.Lets assume, on a slightly dark room you set your brightness to 25nits(whites), so when you go out to the sun phone boosts around 750-800 nits.
Now lets assume on a slightly dark room you set your brightness to 250 nits, now when you go out to the sun phone boosts to 900nits. (what i actually did was not go in a dark room but while i was outside i covered the sensor with my hand so it thought i was in a dim place)
I used to assume everytime you go out to sun it would get maxed but apparently it still depends on what you set your phone before.(dumb a bit if you ask me, cuz you know, its THE sun, brightest thing..) I believe this might be the reason why you didnt reach to 100APL 1200nits.
P.s. I know every brightness sensor is different but i had tested lg on full white and i had gotten 1050 lux, i also tested s10 or plus, all white and i had gotten 1120lux on white,100APL.(It was painfully hard to find the sensor to shine the flashlight, its somewhere around upper part of the phone under the display).
It would be cool if you retested the brightness in this way:
1- After you put auto brightness on, Go in a very dark room or cover the sensor, so phone put itself to a dark brightness, after that happens, set the brigthness to max while you are still in the dark room.(auto is still on).
2- Now go under sun or shine a phone flashlight to sensor and test the brightness on white APL100. That would be really nice.
theblitz707 - Monday, August 19, 2019 - link
lg is g7 on boosted, forgot to mention