Upgrading from an Intel Core i7-2600K: Testing Sandy Bridge in 2019
by Ian Cutress on May 10, 2019 10:30 AM EST- Posted in
- CPUs
- Intel
- Sandy Bridge
- Overclocking
- 7700K
- Coffee Lake
- i7-2600K
- 9700K
Comparing the Quad Cores: CPU Tests
As a straight up comparison between what Intel offered in terms of quad cores, here’s an analysis of all the results for the 2600K, 2600K overclocked, and Intel’s final quad-core with HyperThreading chip for desktop, the 7700K.
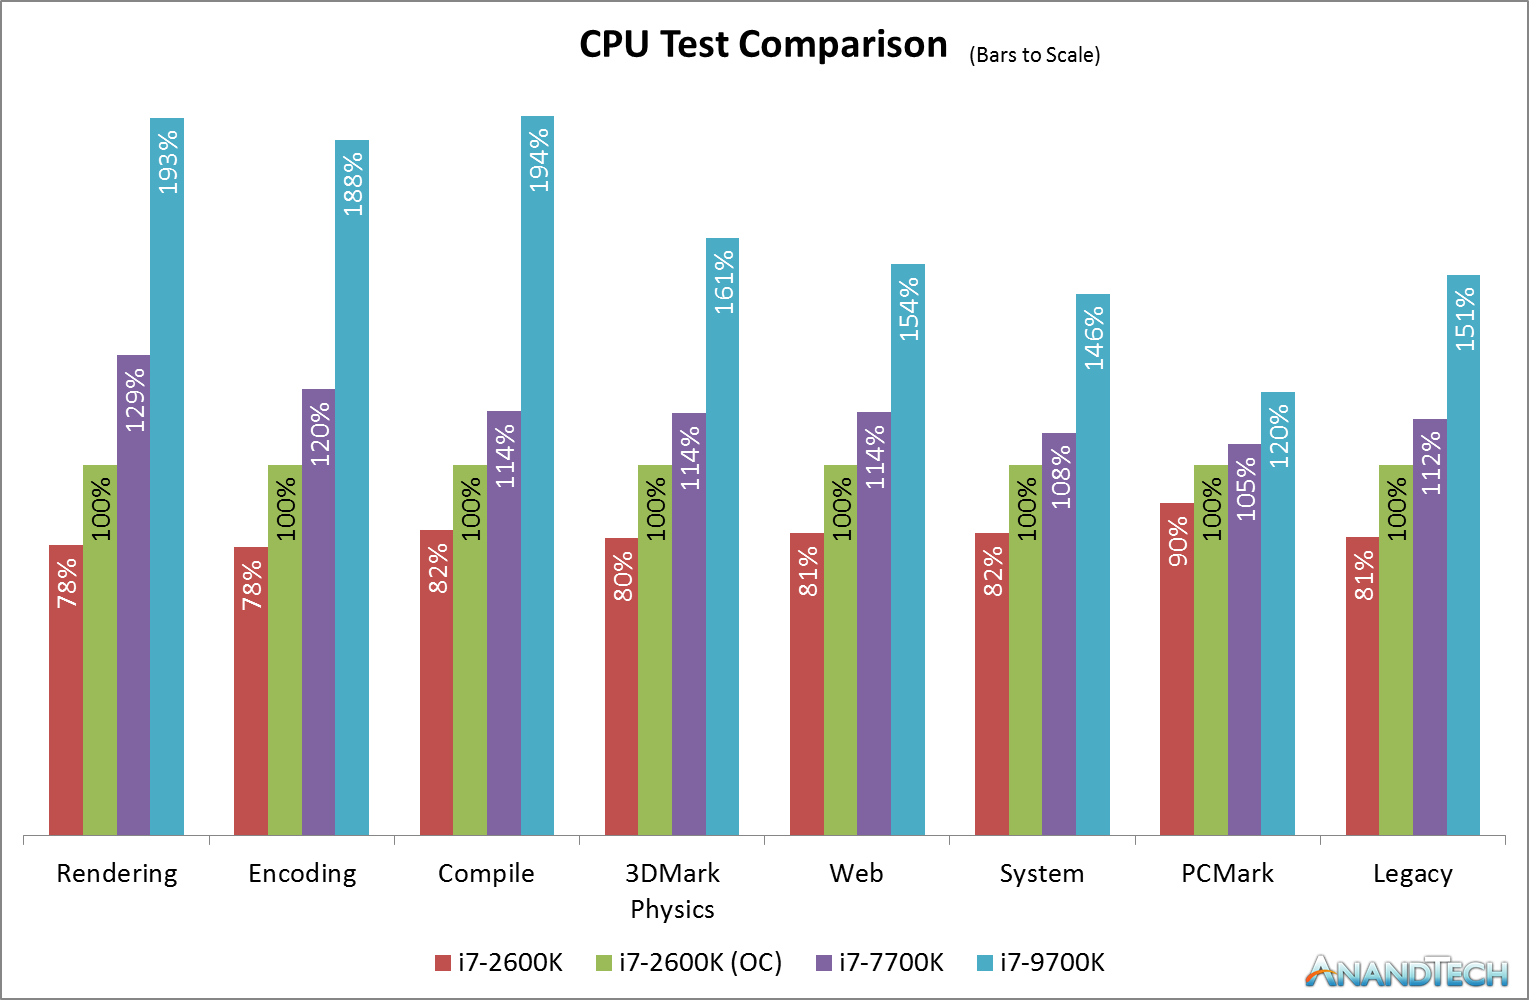
On our CPU tests, the Core i7-2600K when overclocked to a 4.7 GHz all-core frequency (and with DDR3-2400 memory) offers anywhere from 10-24% increase in performance against the stock settings with Intel maximum supported frequency memory. Users liked the 2600K because of this – there were sizable gains to be had, and Intel’s immediate replacements to the 2600K didn’t offer the same level of boost or difference in performance.
However, when compared to the Core i7-7700K, Intel’s final quad-core with HyperThreading processor, users were able to get another 8-29% performance on top of that. Depending on the CPU workload, it would be very easy to see how a user could justify getting the latest quad core processor and feeling the benefits for more modern day workloads, such as rendering or encoding, especially given how the gaming market has turned more into a streaming culture. For the more traditional workflows, such as PCMark or our legacy tests, only gains of 5-12% are seen, which is what we would have seen back when some of these newer tests were no longer so relevant.
As for the Core i7-9700K, which has eight full cores and now sits in the spot of Intel’s best Core i7 processor, performance gains are very much more tangible, and almost double in a lot of cases against an overclocked Core i7-2600K (and more than double against one at stock).
The CPU case is clear: Intel’s last quad core with hyperthreading is an obvious upgrade for a 2600K user, even before you overclock it, and the 9700K which is almost the same launch price parity is definitely an easy sell. The gaming side of the equation isn’t so rosy though.
Comparing the Quad Cores: GPU Tests
Modern games today are running at higher resolutions and quality settings than the Core i7-2600K did when it was first launch, as well as new physics features, new APIs, and new gaming engines that can take advantage of the latest advances in CPU instructions as well as CPU-to-GPU connectivity. For our gaming benchmarks, we test with four tests of settings on each game (720p, 1080p, 1440p-4K, and 4K+) using a GTX 1080, which is one of last generations high-end gaming cards, and something that a number of Core i7 users might own for high-end gaming.
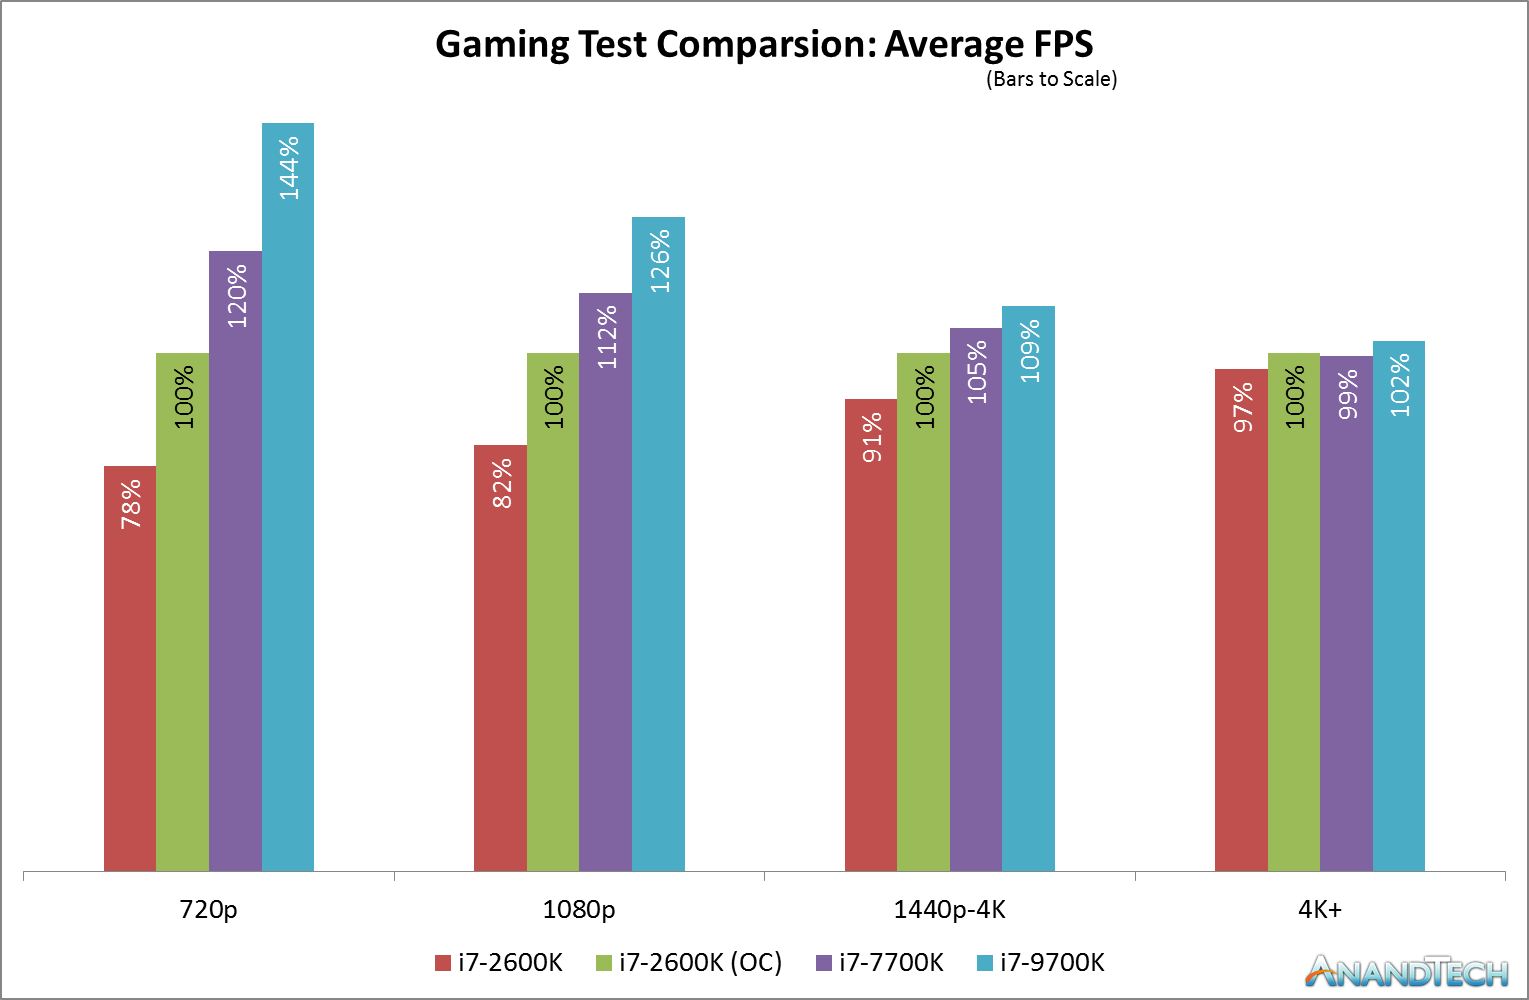
When the Core i7-2600K was launched, 1080p gaming was all the rage. I don’t think I purchased a monitor bigger than 1080p until 2012, and before then I was clan gaming on screens that could have been as low as 1366x768. The point here is that with modern games at older resolutions like 1080p, we do see a sizeable gain when the 2600K is overclocked. A 22% gain in frame rates from a 34% overclock sounds more than reasonable to any high-end focused gamer. Intel only managed to improve on that by 12% over the next few years to the Core i7-7700K, relying mostly on frequency gains. It’s not until the 9700K, with more cores and running games that actually know what to do with them, do we see another jump up in performance.
However, all those gains are muted at a higher resolutions setting, such as 1440p. Going from an overclocked 2600K to a brand new 9700K only gives a 9% increase in frame rates for modern games. At an enthusiast 4K setting, the results across the board are almost equal. As resolutions are getting higher, even with modern physics and instructions and APIs, the bulk of the workload is still on the GPU, and even the Core i7-2600K is powerful enough for it. There is the odd title where having the newer chip helps a lot more, but it’s in the minority.
That is, at least on average frame rates. Modern games and modern testing methods now test percentile frame rates, and the results are a little different.
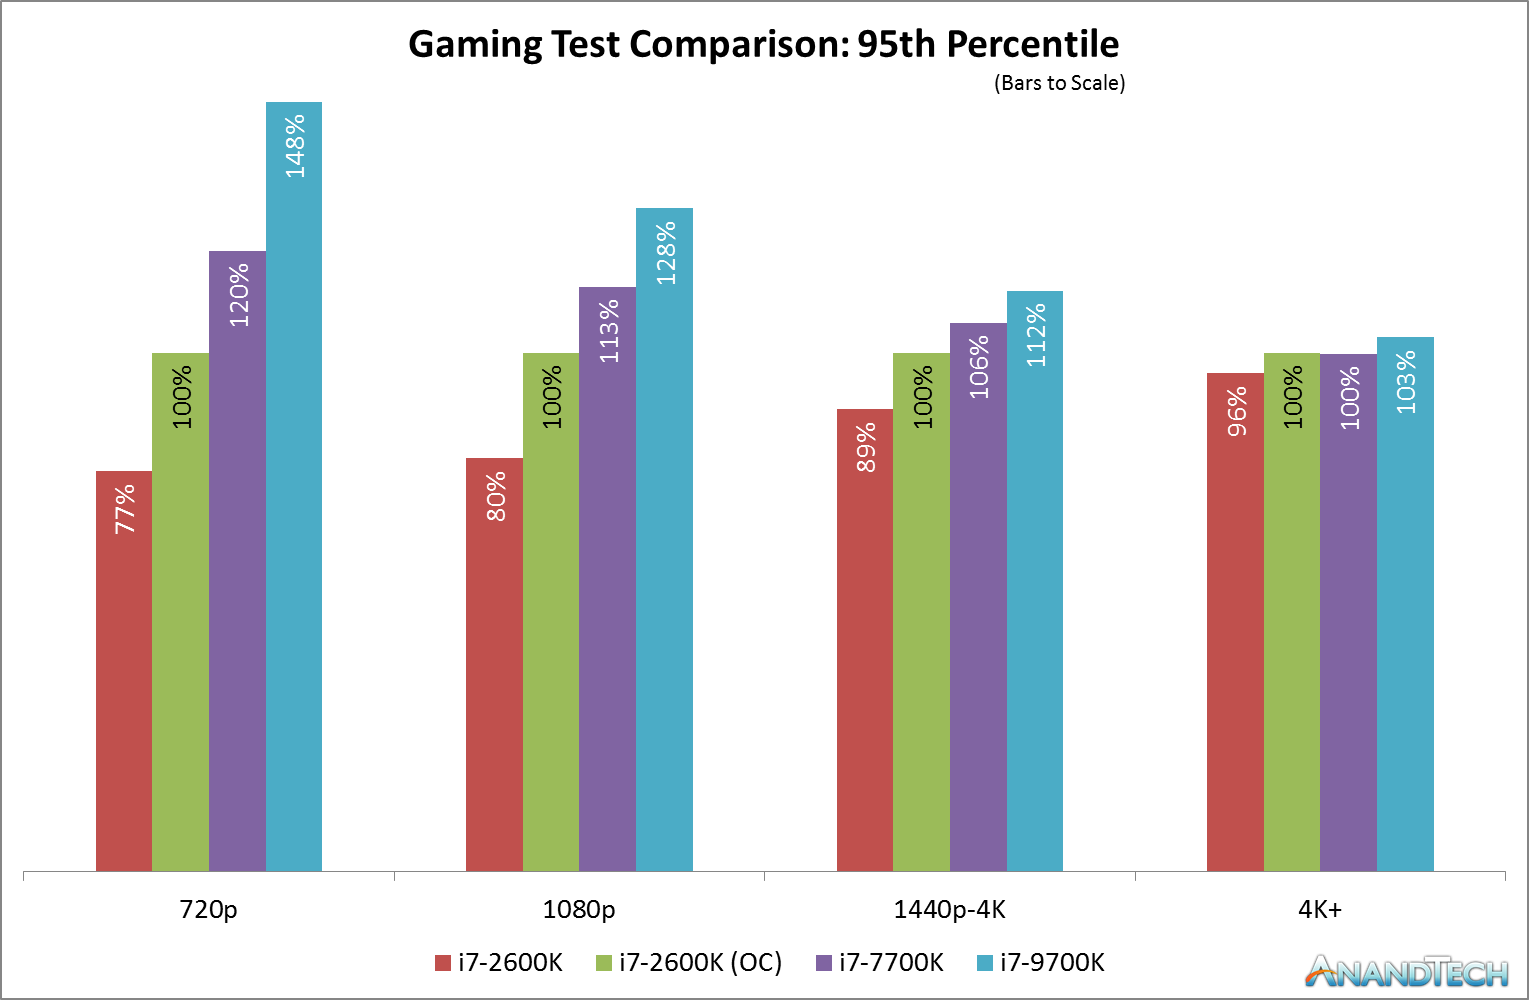
Here the results look a little worse for the Core i7-2600K and a bit better for the Core i7-9700K, but on the whole the broad picture is the same for percentile results as it is for average frame results. In the individual results, we see some odd outliers, such as Ashes of the Singularity which was 15% down on percentiles at 4K for a stock 2600K, but the 9700K was only 6% higher than an overclocked 2600K, but like the average frame rates, it is really title dependent.


213 Comments
View All Comments
SirBlot - Monday, July 25, 2022 - link
60fps min cpu game and cpu render benchmark. Could probably ray tracing up a bit in the actual game for most of it.denise23 - Sunday, October 24, 2021 - link
Nice one https://www.thesims3.com/mypage/macca_star86/myblo...denise23 - Sunday, October 24, 2021 - link
https://www.thesims3.com/mypage/macca_star86/myblo...