The AMD Ryzen 5 2500X and Ryzen 3 2300X CPU Review
by Ian Cutress on February 11, 2019 11:45 AM ESTCPU Performance: Rendering Tests
Rendering is often a key target for processor workloads, lending itself to a professional environment. It comes in different formats as well, from 3D rendering through rasterization, such as games, or by ray tracing, and invokes the ability of the software to manage meshes, textures, collisions, aliasing, physics (in animations), and discarding unnecessary work. Most renderers offer CPU code paths, while a few use GPUs and select environments use FPGAs or dedicated ASICs. For big studios however, CPUs are still the hardware of choice.
All of our benchmark results can also be found in our benchmark engine, Bench.
Corona 1.3: Performance Render
An advanced performance based renderer for software such as 3ds Max and Cinema 4D, the Corona benchmark renders a generated scene as a standard under its 1.3 software version. Normally the GUI implementation of the benchmark shows the scene being built, and allows the user to upload the result as a ‘time to complete’.
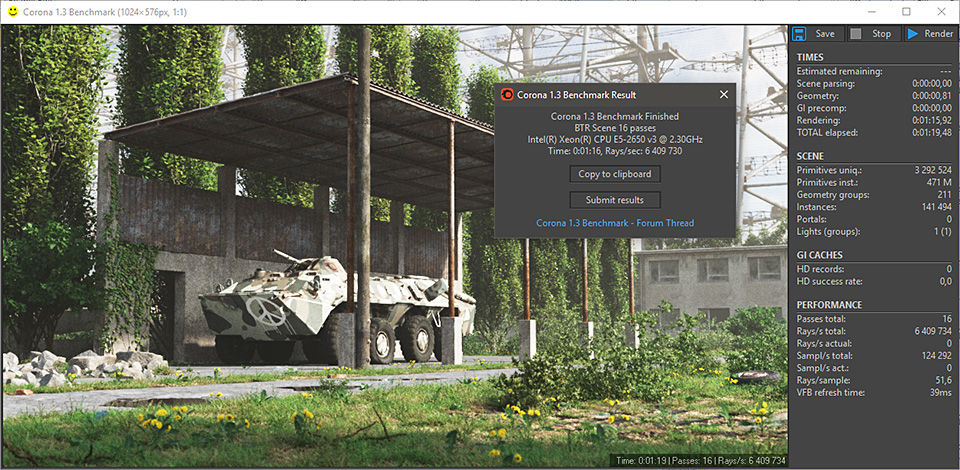
We got in contact with the developer who gave us a command line version of the benchmark that does a direct output of results. Rather than reporting time, we report the average number of rays per second across six runs, as the performance scaling of a result per unit time is typically visually easier to understand.
The Corona benchmark website can be found at https://corona-renderer.com/benchmark
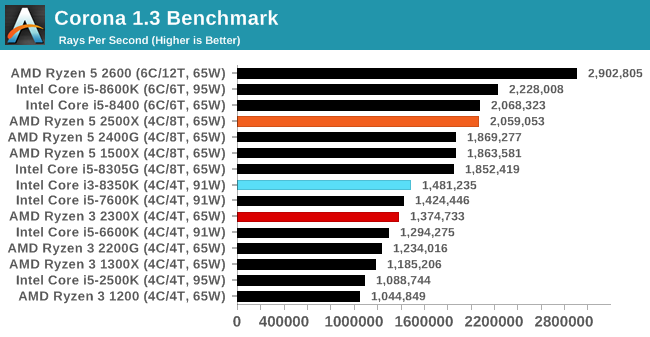
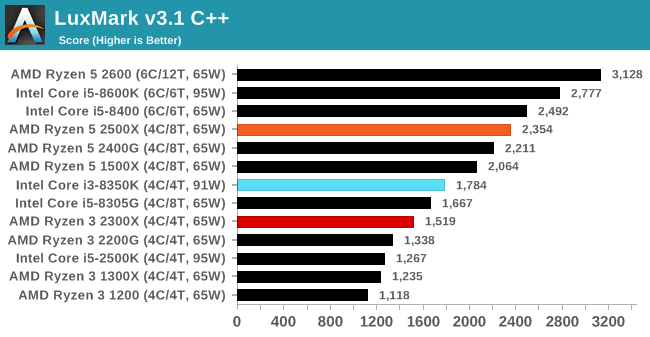
A raw multithreaded test, the eight thread CPUs here score above the quad cores without SMT. The 2500X with four cores and eight threads is on par with a six-core Intel CPU here.
Blender 2.79b: 3D Creation Suite
A high profile rendering tool, Blender is open-source allowing for massive amounts of configurability, and is used by a number of high-profile animation studios worldwide. The organization recently released a Blender benchmark package, a couple of weeks after we had narrowed our Blender test for our new suite, however their test can take over an hour. For our results, we run one of the sub-tests in that suite through the command line - a standard ‘bmw27’ scene in CPU only mode, and measure the time to complete the render.
Blender can be downloaded at https://www.blender.org/download/
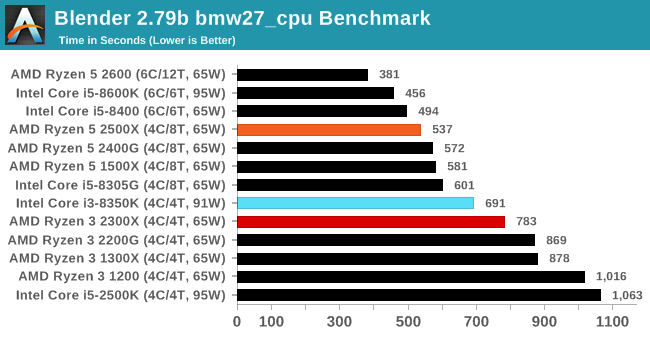
Bender is a variable threaded test, tackling lots of parts of the system. The move from a 4C/4T AMD chip to the 4C/8T AMD chip gets a good speedup, with the jump up in threads really helping. Our results are very clearly delineated on core count then thread count.
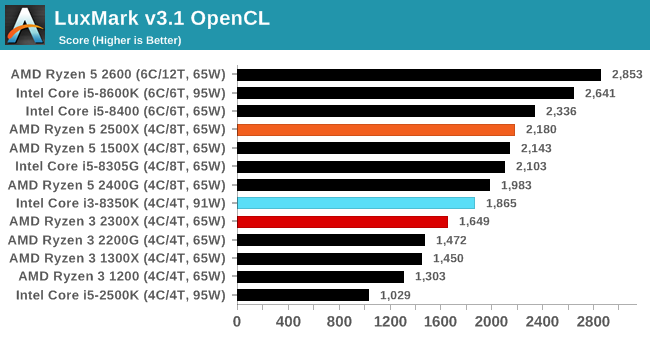
LuxMark v3.1: LuxRender via Different Code Paths
As stated at the top, there are many different ways to process rendering data: CPU, GPU, Accelerator, and others. On top of that, there are many frameworks and APIs in which to program, depending on how the software will be used. LuxMark, a benchmark developed using the LuxRender engine, offers several different scenes and APIs.
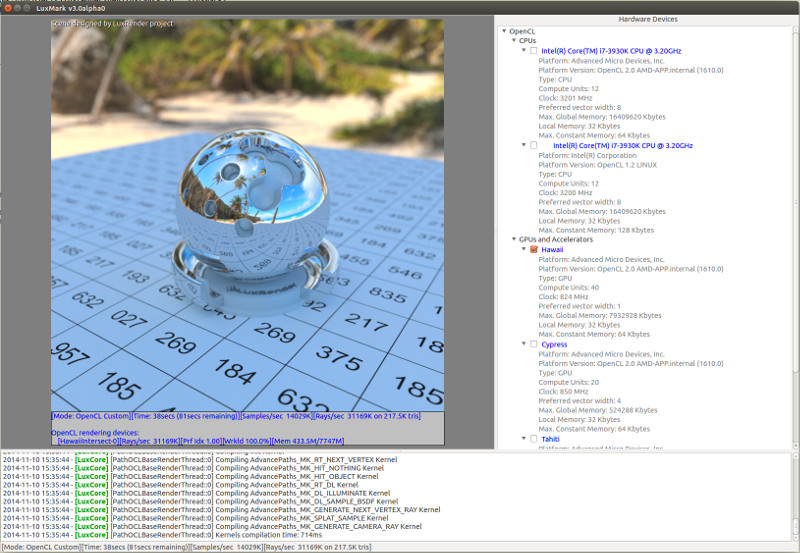
Taken from the Linux Version of LuxMark
In our test, we run the simple ‘Ball’ scene on both the C++ and OpenCL code paths, but in CPU mode. This scene starts with a rough render and slowly improves the quality over two minutes, giving a final result in what is essentially an average ‘kilorays per second’.
POV-Ray 3.7.1: Ray Tracing
The Persistence of Vision ray tracing engine is another well-known benchmarking tool, which was in a state of relative hibernation until AMD released its Zen processors, to which suddenly both Intel and AMD were submitting code to the main branch of the open source project. For our test, we use the built-in benchmark for all-cores, called from the command line.
POV-Ray can be downloaded from http://www.povray.org/
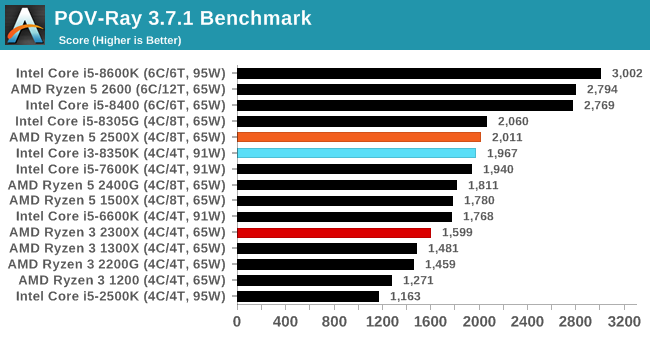
For POV-Ray, the better AVX2 performance of the Core i3 shows as it almost matches the 2500X.


65 Comments
View All Comments
shticktical - Thursday, February 14, 2019 - link
Ian, why don't you include idle power consumption? And not just in this article, in all CPU reviews? System's usually spent 95% time idling. That would be very interesting to know and compare. Thank you!Ian Cutress - Friday, February 15, 2019 - link
Idle power consumption varies very wildly when you're talking about zero CPU load, and can be influenced more by the motherboard/system than the CPU itself. You can check the data in Bench regardless:https://www.anandtech.com/bench/CPU-2019/2183
RSAUser - Sunday, February 17, 2019 - link
Still disappointed that Anandtech cannot use a simple bar chart plugin like canvasjs in 2019.Would love the ability to add information on hover like the current market price, or MSRP, or make it so it fetches the price from the amazon or newegg api.
This is especially relevant in these charts where you're adding intel processors that are completely out of the price league of the CPU being reviewed and you're not adding the current price to the chart.
Using a JS library to render the HTML would make those charts mobile responsive.
fadsarmy - Monday, June 10, 2019 - link
How does a 65W cpu (Ryzen 5 2600) draw 77.97W?