The AMD Ryzen 5 2500X and Ryzen 3 2300X CPU Review
by Ian Cutress on February 11, 2019 11:45 AM ESTGaming: Grand Theft Auto V
The highly anticipated iteration of the Grand Theft Auto franchise hit the shelves on April 14th 2015, with both AMD and NVIDIA in tow to help optimize the title. GTA doesn’t provide graphical presets, but opens up the options to users and extends the boundaries by pushing even the hardest systems to the limit using Rockstar’s Advanced Game Engine under DirectX 11. Whether the user is flying high in the mountains with long draw distances or dealing with assorted trash in the city, when cranked up to maximum it creates stunning visuals but hard work for both the CPU and the GPU.

For our test we have scripted a version of the in-game benchmark. The in-game benchmark consists of five scenarios: four short panning shots with varying lighting and weather effects, and a fifth action sequence that lasts around 90 seconds. We use only the final part of the benchmark, which combines a flight scene in a jet followed by an inner city drive-by through several intersections followed by ramming a tanker that explodes, causing other cars to explode as well. This is a mix of distance rendering followed by a detailed near-rendering action sequence, and the title thankfully spits out frame time data.
There are no presets for the graphics options on GTA, allowing the user to adjust options such as population density and distance scaling on sliders, but others such as texture/shadow/shader/water quality from Low to Very High. Other options include MSAA, soft shadows, post effects, shadow resolution and extended draw distance options. There is a handy option at the top which shows how much video memory the options are expected to consume, with obvious repercussions if a user requests more video memory than is present on the card (although there’s no obvious indication if you have a low end GPU with lots of GPU memory, like an R7 240 4GB).
| AnandTech CPU Gaming 2019 Game List | ||||||||
| Game | Genre | Release Date | API | IGP | Low | Med | High | |
| Grand Theft Auto V | Open World | Apr 2015 |
DX11 | 720p Low |
1080p High |
1440p Very High |
4K Ultra |
|
All of our benchmark results can also be found in our benchmark engine, Bench.
| AnandTech | IGP | Low | Medium | High |
| Average FPS |  |
 |
 |
 |
| 95th Percentile | 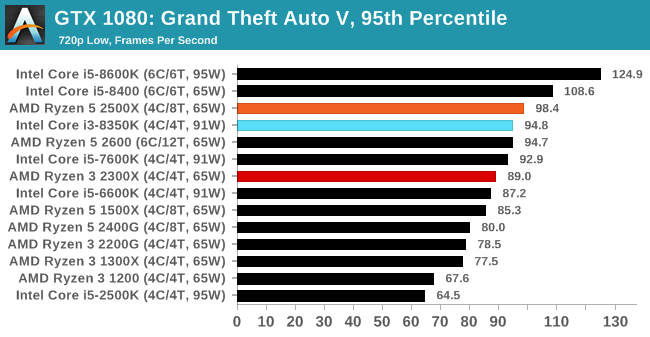 |
 |
 |
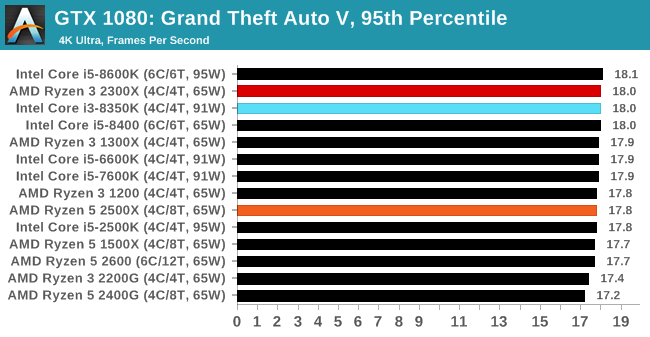 |
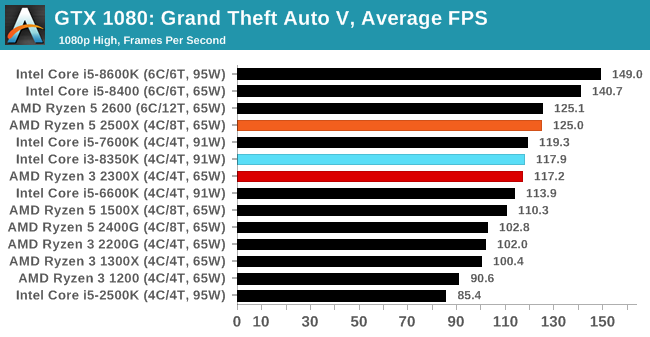
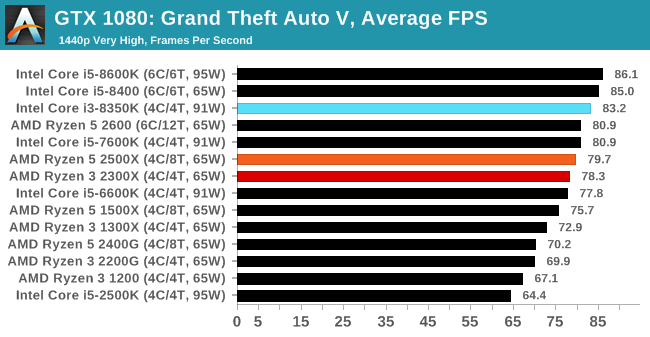
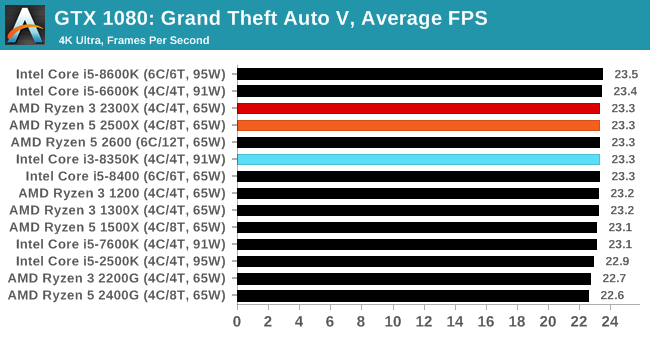
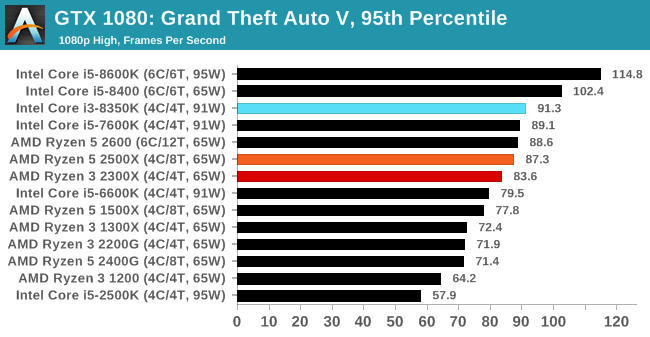
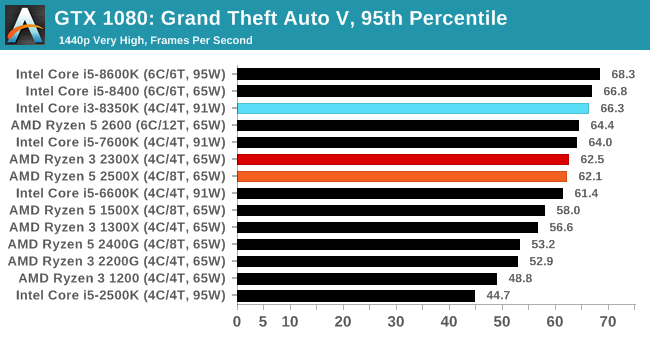
At 720p and 1080p, the Ryzen 5 2500X has the lead, while at 1440p the 8350K goes ahead. At 4K, all chips are equal.


65 Comments
View All Comments
shticktical - Thursday, February 14, 2019 - link
Ian, why don't you include idle power consumption? And not just in this article, in all CPU reviews? System's usually spent 95% time idling. That would be very interesting to know and compare. Thank you!Ian Cutress - Friday, February 15, 2019 - link
Idle power consumption varies very wildly when you're talking about zero CPU load, and can be influenced more by the motherboard/system than the CPU itself. You can check the data in Bench regardless:https://www.anandtech.com/bench/CPU-2019/2183
RSAUser - Sunday, February 17, 2019 - link
Still disappointed that Anandtech cannot use a simple bar chart plugin like canvasjs in 2019.Would love the ability to add information on hover like the current market price, or MSRP, or make it so it fetches the price from the amazon or newegg api.
This is especially relevant in these charts where you're adding intel processors that are completely out of the price league of the CPU being reviewed and you're not adding the current price to the chart.
Using a JS library to render the HTML would make those charts mobile responsive.
fadsarmy - Monday, June 10, 2019 - link
How does a 65W cpu (Ryzen 5 2600) draw 77.97W?