The AMD Ryzen 5 2500X and Ryzen 3 2300X CPU Review
by Ian Cutress on February 11, 2019 11:45 AM ESTPower Consumption and TDP
The way AMD and Intel use the term Thermal Design Power (TDP) is different. Technically it is a measure of cooling ability needed for a given processor, which is how AMD use it, or the more common way is a measure of power consumption, how Intel does it. The question becomes whether it means sustained power, or turbo power - most people assume it's the latter, but Intel use it for the former (sustained) power. We describe this in detail in our article here:
https://www.anandtech.com/show/13544/why-intel-processors-draw-more-power-than-expected-tdp-turbo
There is also the added factor of the luck of the draw - two processors that have the same name can potentially vary wildly in power consumption. Both AMD and Intel apply 'binning' rules, such that CPUs that hit a minimum grade are stamped as that processor model. This means that a processor can either only just pass the grade, or be a super perfect chip, but still be sold as the same. There is also the possibility that the company could downgrade a higher model and rebadge it to the lower model in order to adjust inventory. This is something to keep in mind when looking at power numbers.
Power Consumption
Power consumption was tested on the system while in a single MSI GTX 1080 GPU configuration with a wall meter connected to a power supply with ~75% efficiency > 50W, and 90%+ efficiency at 250W, suitable for both idle and multi-GPU loading. Our method of power reading actually bypasses the power management of the UEFI and the board to supply components with power under load, instead using the readings that the system is directly be told from the CPU for managing fan speeds, temperatures, current protection, etc. This way of reading the power has positives and negatives, but provides a sustainable CPU-only comparison value.
In our test, we use affinity masking to test from 0 to double the threads of the CPU while running the POV-Ray benchmark, and reporting the peak power from around ~20 seconds into the test when all threads are loaded. The 'Full Load' value takes the peak value out of all the affinity mark sub-tests. POV-Ray uses up to AVX2 instructions, which can draw more power than non-AVX code.
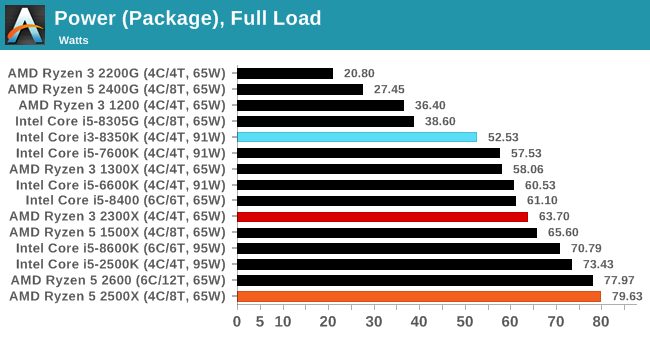
As expected, the 2500X consumes more power than the 2300X, but both are beaten by almost 10W by the Core i3-8350K, and the Core i5-8600K sits in between the two AMD chips. Perhaps suprisingly, our Ryzen 5 2500X sample consumes more power at load than our Ryzen 5 2600 chip, which is rated at the same TDP. It would appear that the 65W TDP of our Ryzen 5 2500X is set too low, or we just have a bad chip that is applying a lot of voltage. The winners in power here are the Ryzen APUs.


65 Comments
View All Comments
Le Québécois - Monday, February 11, 2019 - link
Ian, any reason why more often than not, you seem to "skip" 1440 in your benchmarks? It's only present for a few games.Considering the GTX 1080, your best card, is always the bottleneck at 4K, as your numbers show, wouldn't it make more sense to focus more on 1440 instead?
Especially considering it's the "best" resolution on the market if you are looking for a high pixel density yet still want to run your games at a playable levels of fps.
Ian Cutress - Monday, February 11, 2019 - link
Some benchmarks are run at 1440p. Some go up to 8K. It's a mix. There's what, 10 games there? Not all of them have to conform to the same testing settings.Le Québécois - Tuesday, February 12, 2019 - link
Sorry for the confusion. I can clearly see we've got very different settings in that mix. I guess a more direct question would be: why do it this way and not with a more standardized series of test?A followup question would also be, why 8K? You are already GPU limited at 4K so your 8K result are not going to give any relevant information about those CPUs.
Sorry, I don't mean to criticized, I simply wish to understand your thought process.
MrSpadge - Monday, February 11, 2019 - link
What exactly do you want to see there that you can't see at 1080p? Differences between CPUs are going to be muddied due to approaching the GPU limit, and that's it.Le Québécois - Tuesday, February 12, 2019 - link
Well, at 1080, you can definitely see the difference between them, and exactly like you said, at 4K, it's all the same because of the GPU limitations. 1440 seems more relevant than 4K considering this. This is after all, a CPU review and most of the 4K results could be summed up by "they all perform within a few %".neblogai - Monday, February 11, 2019 - link
End of page 19: R5 2600 is really 65W TDP, not 95W.Ian Cutress - Monday, February 11, 2019 - link
Doh, a typo in all my graphs too. Should be updated.imaheadcase - Monday, February 11, 2019 - link
Im on phone on AT and truly see how terrible ads are now. AT straight up letting scam ads now being served because desperate for revenue. 😂PeachNCream - Monday, February 11, 2019 - link
Is there a point in even mentioning that give how little control they now have over advertising? Just fire up the ad blocker or visit another site and let the new owners figure it out the hard way.StevoLincolnite - Tuesday, February 12, 2019 - link
Anandtech had Maleware/Viruses infect it's userbase years ago via crappy adverts.That was the moment I got Ad-Block. And that is the moment where I will never turn it off again.