The Western Digital WD Black SN750 SSD Review: Why Fix What Isn't Broken?
by Billy Tallis on January 18, 2019 8:01 AM ESTSequential Read Performance
Our first test of sequential read performance uses short bursts of 128MB, issued as 128kB operations with no queuing. The test averages performance across eight bursts for a total of 1GB of data transferred from a drive containing 16GB of data. Between each burst the drive is given enough idle time to keep the overall duty cycle at 20%.
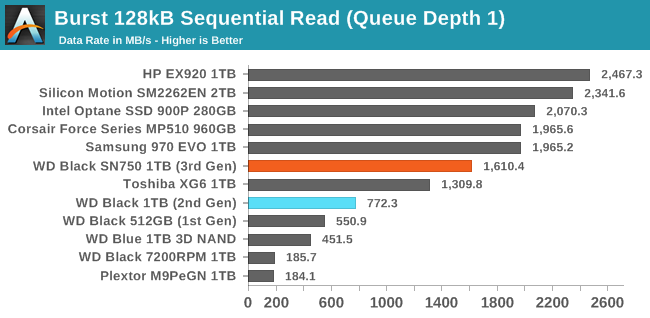
The queue depth 1 burst sequential read performance of the WD Black SN750 is faster than its predecessor, but there's still a lot of room for improvement relative to the fastest TLC SSDs and even the Corsair MP510 that relies on the same BiCS3 NAND as the SN750.
Our test of sustained sequential reads uses queue depths from 1 to 32, with the performance and power scores computed as the average of QD1, QD2 and QD4. Each queue depth is tested for up to one minute or 32GB transferred, from a drive containing 64GB of data. This test is run twice: once with the drive prepared by sequentially writing the test data, and again after the random write test has mixed things up, causing fragmentation inside the SSD that isn't visible to the OS. These two scores represent the two extremes of how the drive would perform under real-world usage, where wear leveling and modifications to some existing data will create some internal fragmentation that degrades performance, but usually not to the extent shown here.
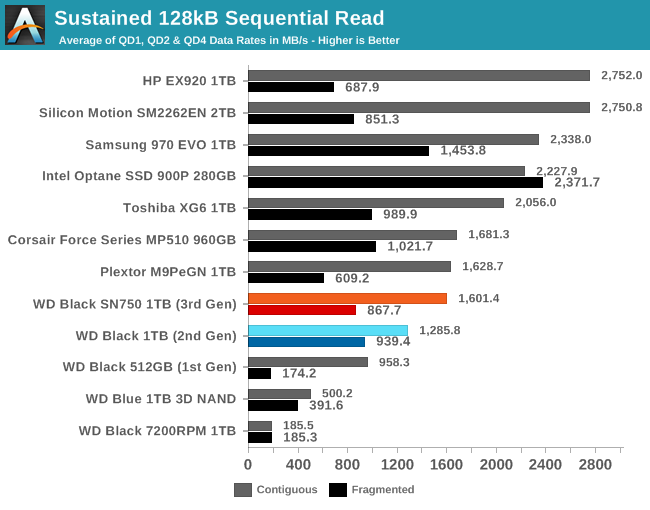
The performance of the WD Black SN750 on the longer sequential read test is a bit better than the previous model and more in line with other drives that use the same NAND, but still much slower than the top NVMe drives on this test. The performance when reading data that was not written to the drive sequentially has regressed slightly but is still decent for this class of drive.
 |
|||||||||
| Power Efficiency in MB/s/W | Average Power in W | ||||||||
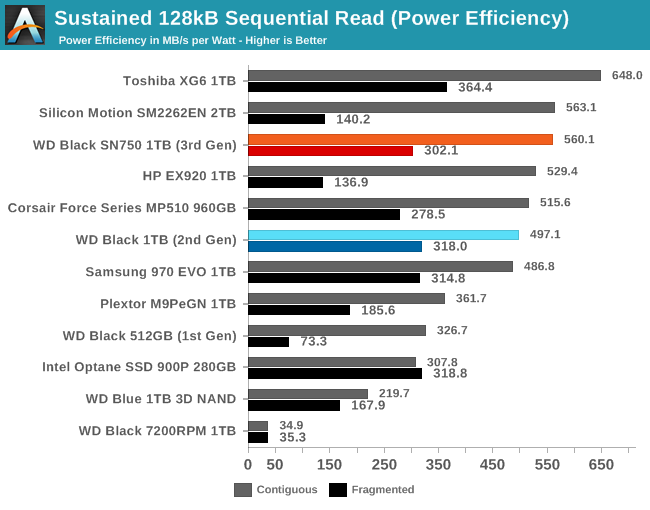
Despite relatively low performance, the SN750 still manages to be tied for second place in the power efficiency ranking, scoring about 13% lower than the Toshiba XG6.
 |
|||||||||
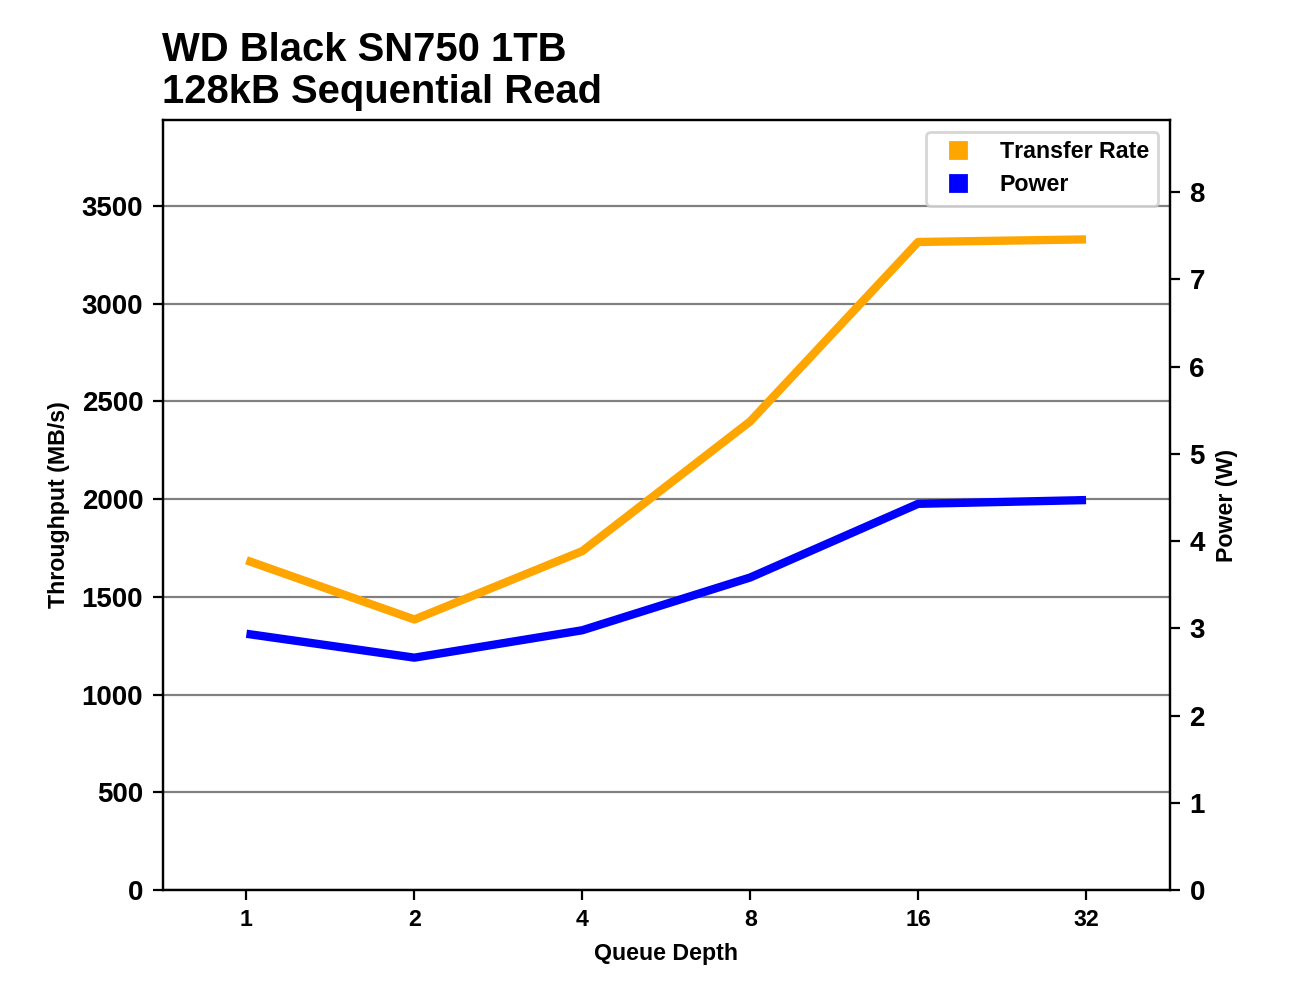
The WD Black SN750 suffers during the early stages of the sequential read test and doesn't hit its full read speed until the queue depth reaches about 16. The performance profile is very similar to last year's model save for a significant improvement at QD1. Several other drives also require fairly high queue depths to reach full speed, but most of the relevant competition has better low-QD performance than the WD Black.
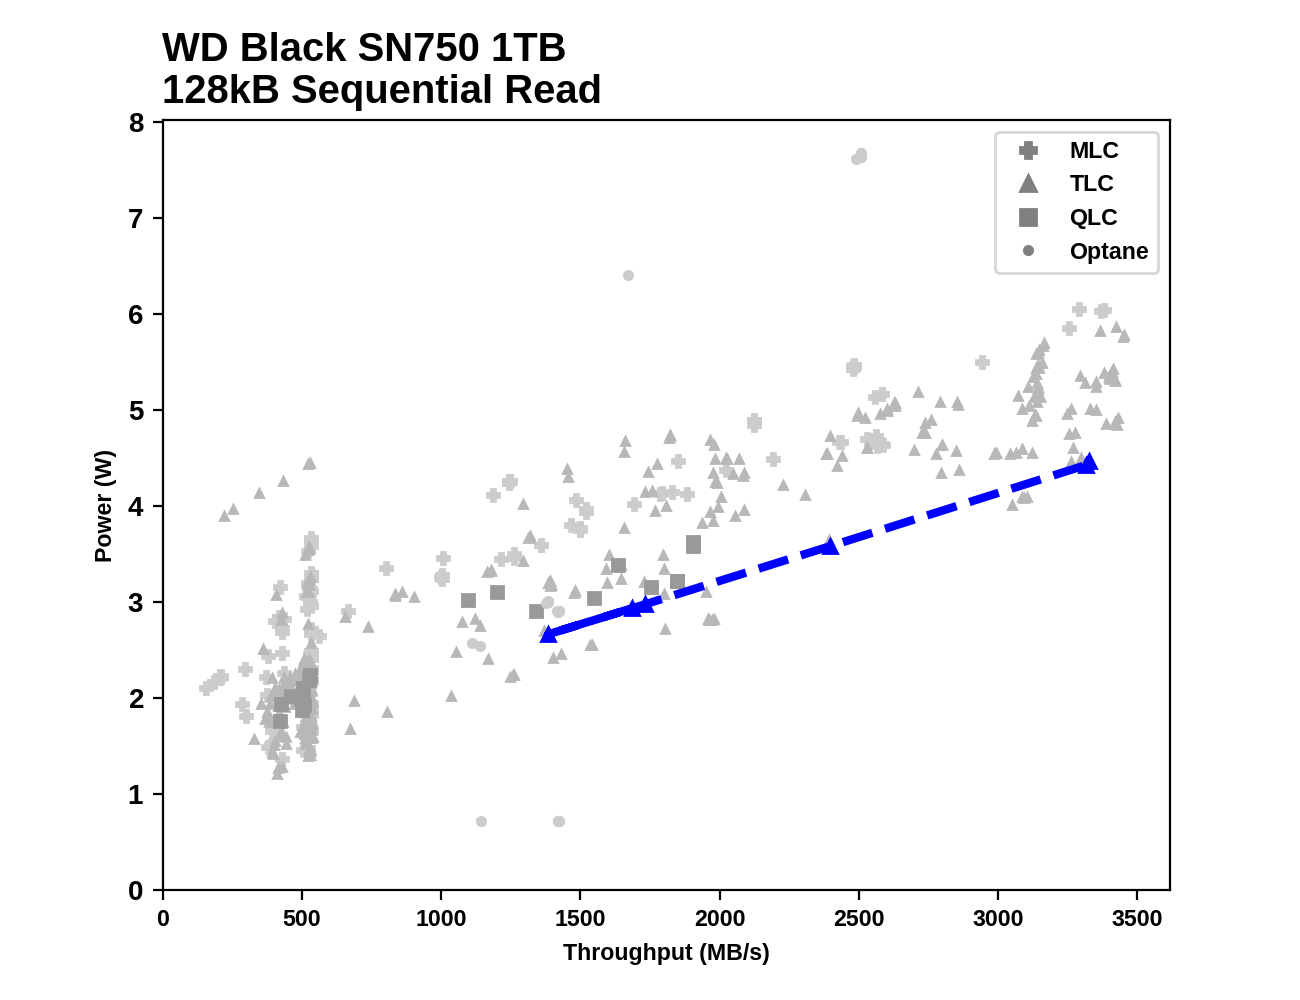
Even though the WD Black starts off slow, it still is fairly power efficient throughout the sequential read test and there are only few drives that offer better performance per Watt at any speed.
Sequential Write Performance
Our test of sequential write burst performance is structured identically to the sequential read burst performance test save for the direction of the data transfer. Each burst writes 128MB as 128kB operations issued at QD1, for a total of 1GB of data written to a drive containing 16GB of data.
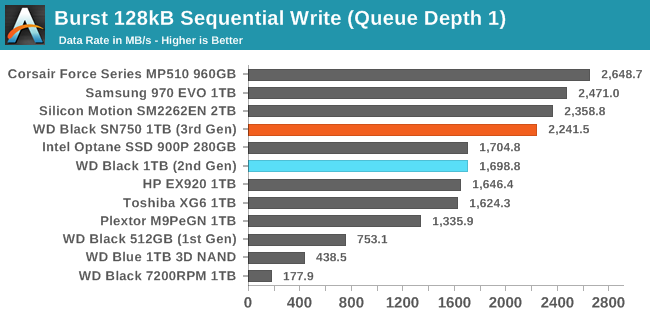
As with sequential reads, the QD1 burst sequential write performance of the WD Black SN750 is significantly improved over the previous model, and this time it gets relatively close to the top tier of drives.
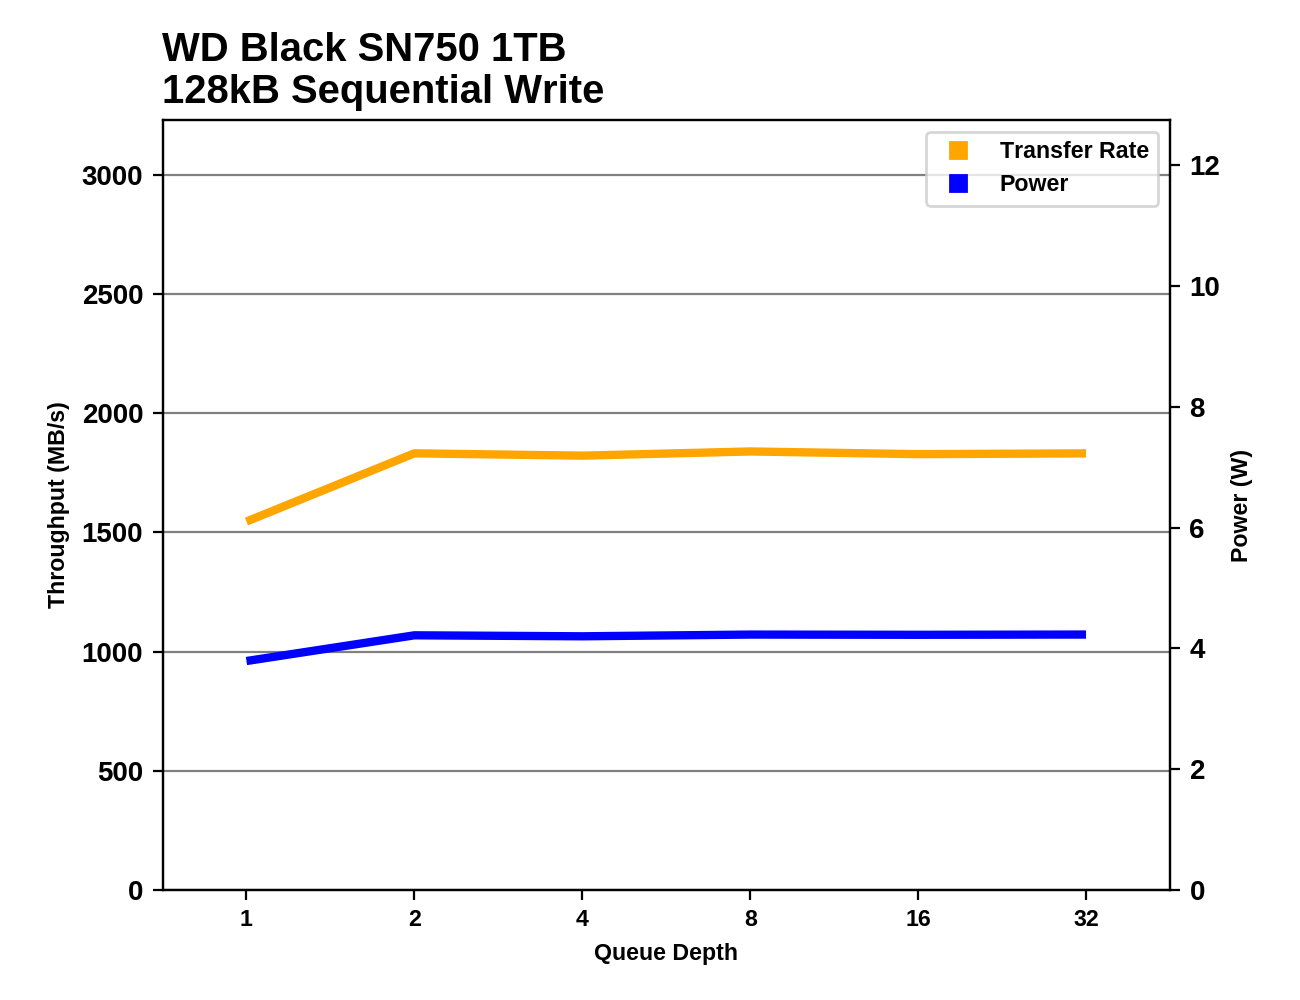
Our test of sustained sequential writes is structured identically to our sustained sequential read test, save for the direction of the data transfers. Queue depths range from 1 to 32 and each queue depth is tested for up to one minute or 32GB, followed by up to one minute of idle time for the drive to cool off and perform garbage collection. The test is confined to a 64GB span of the drive.
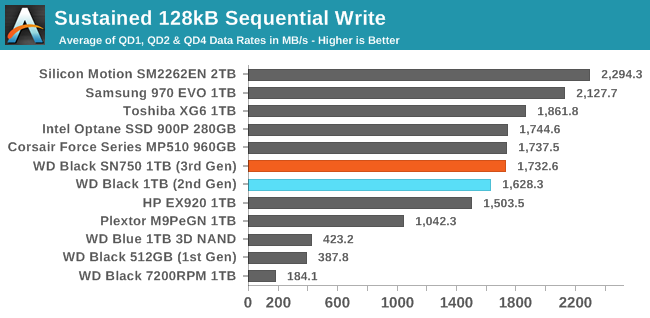
The SN750 also improves slightly on the longer sequential write test that adds in some higher queue depths, bringing it up to the level of the Corsair MP510 but still a bit behind the Toshiba XG6 and well behind the fastest TLC-based competition.
 |
|||||||||
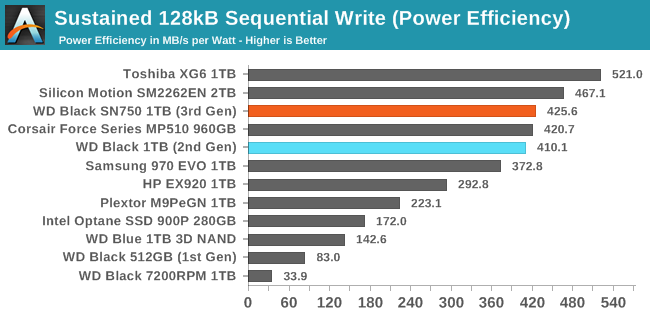
| Power Efficiency in MB/s/W | Average Power in W | ||||||||
The SN750 can't claim another efficiency win due to its performance that is merely average for this product segment, but the efficiency score is still pretty good.
 |
|||||||||
The SN750's sequential write performance increases slightly from QD1 to QD2 and remains steady for the rest of the test. The top-performing SM2262EN sample doesn't hit full speed until QD4, at which point it is faster than the SN750 by almost 1GB/s.
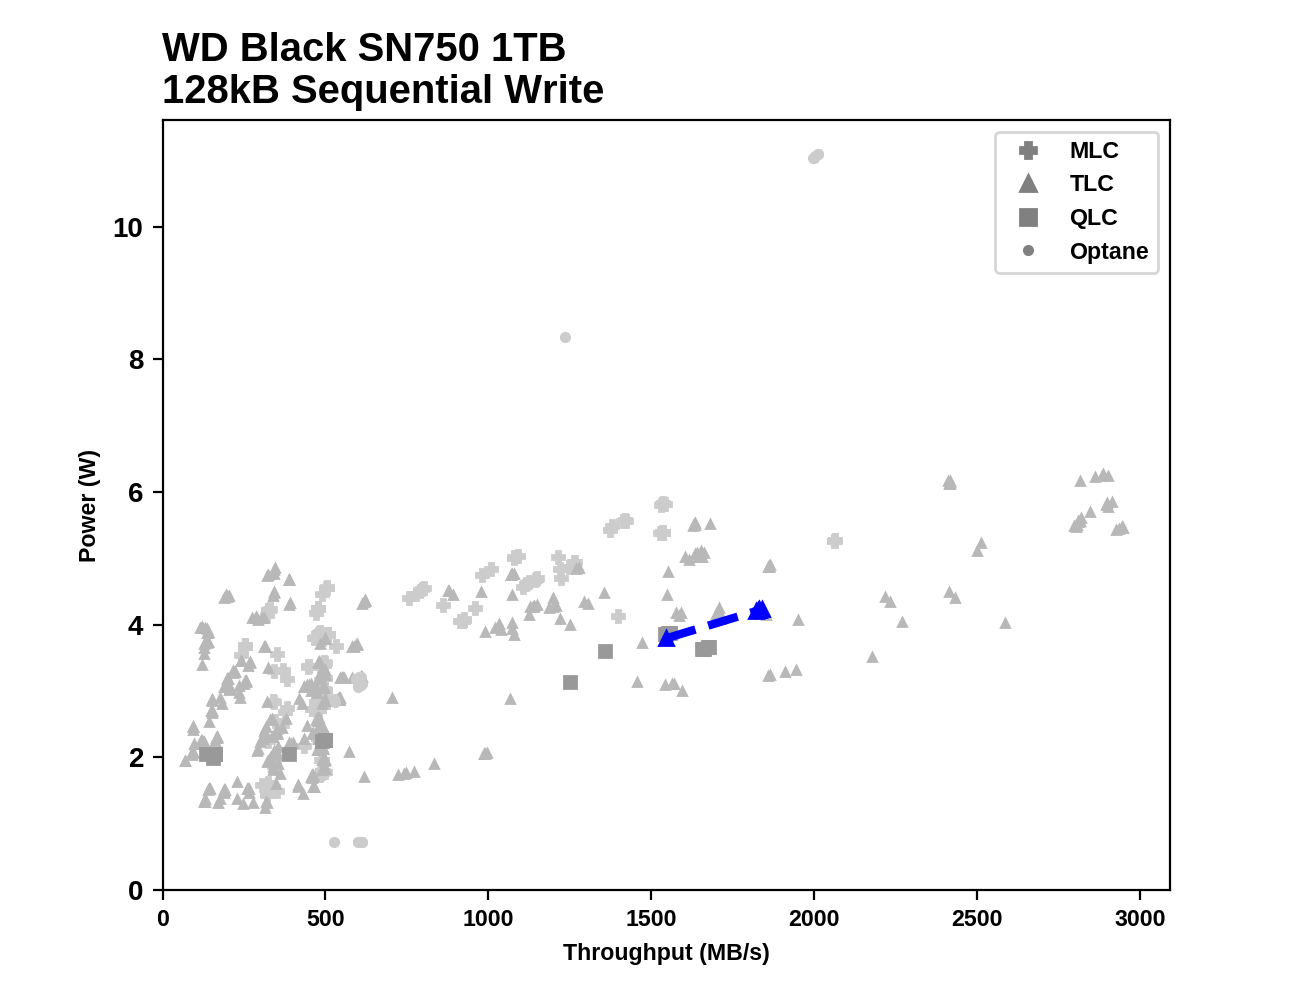
Among all the drives that have run through this test, the performance and power consumption of the SN750 both appear fairly middle of the road by NVMe standards; there are some drives that save almost 1W at the same speed, and a few that are far faster at similar power levels.


54 Comments
View All Comments
namechamps - Friday, January 18, 2019 - link
Strangely enough I don't think anandtech has ever reviewed the 970 Pro which is likely why it isn't in the comparison. They have done the 960 pro and the 970 evo but not the 970 pro.Ryan Smith - Friday, January 18, 2019 - link
"Whatever happend to the Samsung PRO in those comparisons?"Unfortunately Samsung never sampled the 970 PRO, so we don't have it on hand. And all indications are that they're just about done with it, having never released a 2TB version (like they did the 960 PRO).
I'm really not sure if we're going to see any new consumer MLC drives in 2019. The market has bifurcated into TLC and then more boutique solutions like Z-NAND and 3D XPoint.
althaz - Friday, January 18, 2019 - link
The 512Gb drive is a ~$150 part, just buy it and test it? To many this remains the most prestigious tech site around for at least some things. SSDs have been one of those things. Not having the latest of Samsung's pro drive in your results kinda makes this whole thing not worth it, IMO.If you need an excuse do a "MLC Redux" review where you look at what was probably the faster ever MLC drive and talk about how SSD tech has changed.
eldakka - Friday, January 18, 2019 - link
" just buy it and test it?"I'm sure anandtech would be delighted to test it if you sample one to them, or donate $150 to them to purchase one with.
GreenReaper - Saturday, January 19, 2019 - link
This is the level of a business expense though. Even if you did one a day for every day of the year it would be $53,400. OK, you could get a full-time journalist for that in some places, but that assumes they are kept and not sold on or used for anything else.Solandri - Monday, January 21, 2019 - link
More troubling is that unwillingness to buy a product for review smacks of demanding bribes. "Give us a free sample or we won't review your product." Which implies that companies which shower the reviewer with gifts will get more favorable reviews.Ideally, a review site should *never* accept free samples, and do all their product reviews with samples bought from the store. That's the only way to completely eliminate any undue influence the product manufacturer may have on the product review.
Dark_wizzie - Friday, January 18, 2019 - link
I don't think they actually reviewed the 970 Pro?StevoLincolnite - Saturday, January 19, 2019 - link
Yeah. Comparisons have been a bit crap on Anandtech lately.The RTX 2080 review is lacking a good lineup of GPU's to compare with... Despite promises of "Adding more later". (Never happened sadly.)
joesiv - Friday, January 18, 2019 - link
I would love to see at least some endurance testing in anandtechs reviews. I think it's something that's missing pretty much all SSD testing I see. Yes, speed is great, but endurance is something perspective owners will care more about in the long term.NAND technology is changing over time, is it changing for the better? More layers, but often at the expense of P/E Cycles.
SSD Firmwares as well have gotten both a lot more reliable, but also a lot more complicated, with different companies doing different things to maximize performance and also endurance.
Without testing these things, we don't know if there are duds in terms of firmwares/drives that don't strike a good balance between performance/reliability.
Bare minimimum I would love to see ananadtech do the following:
- Talk to manufacturers about the actual specifications of the NAND, what is the P/E Cycle rating for the NAND. Then list it in the specs for the drives so we can do our own research/homework if we want to. This spec is very often missed in the most marketing material.
- Do a quick capture of the SMART data at the very start of the testing
- Do a capture of the SMART data at the very end of your testing.
- Check out the Block Erase Count specifically. The Average Block Erase count would give a good approximation of how much life you've used just within your benchmark suite. It's much more grainular than Percent Life Used. This SMART attribute can vary between different manufacturer/firmware/controllers, so you might need to contact the manufacturer for this info.
In the end, you'll have something like: Rated P/E count / Average Block Erase, and since your test suite is likely pretty similar between SSD's, it would be a useful metric.
Bonus points, you could also look at NAND writes (not to be confused with Host Writes), during your testing, as it's related to life expectancy and can be corrolated with Total Byte Written.
I wouldn't be surprised to see that some drives write a lot more to NAND than you are expecting, and thus have higher Average Block Erases during your testing.
At my company when I did this test, while we were evaluating a drive for our products, Tier 1 memory manufacturers and their drives, failed bitterly at this endurance test where most did fine. I attribute this to the firmware. Working with the firmware developement team, we determined that the fix would not be feasible in that generation of product, so we had to skip that product.
Specs aren't everything, we need to test it, endurance is an important aspect, and I'd love to see it represented in your reviews.
romrunning - Friday, January 18, 2019 - link
Whom do you consider to be "Tier 1 memory manufacturers" - Samsung or Intel? I can't imagine their products failing endurance tests. Or are you talking about those you would consider to be lower than Samsung - like AData, Team Group, etc. - as a Tier 2 or Tier 3?