Comparing Two 1TB NVMe Drives with Same NAND, Same Controller: XPG SX8200 Pro vs HP EX950
by Billy Tallis on February 6, 2019 11:30 AM ESTWhole-Drive Fill: Testing SLC Cache Size
Most modern drives, in order to accelerate writing speed, designate a part of the drive as an 'SLC cache'. This is part of the storage that acts in 'single bit-per-cell' mode, which allows for faster reads and writes. The reason why it isn't used across the whole drive is that it doesn't allow as much data to be stored in the same area (TLC is three bits per cell, so 3x the density). As the user puts a sustained file write on the drive, this SLC cache will fill up at full speed. If the write size is bigger than the cache and goes without a break, it can spill into normal TLC territory (which is slower). When there is a pause in operation, the drive will compact the data in the SLC cache and move it to TLC blocks, freeing up cache space for future writes. Some drives adjust the size of this SLC cache dynamically based on the amount of free space left, while others have it as a fixed capacity.
We test this function as part of our review, to see how different drives react to a sustained write across the drive without a pause.
Testing Our Drives
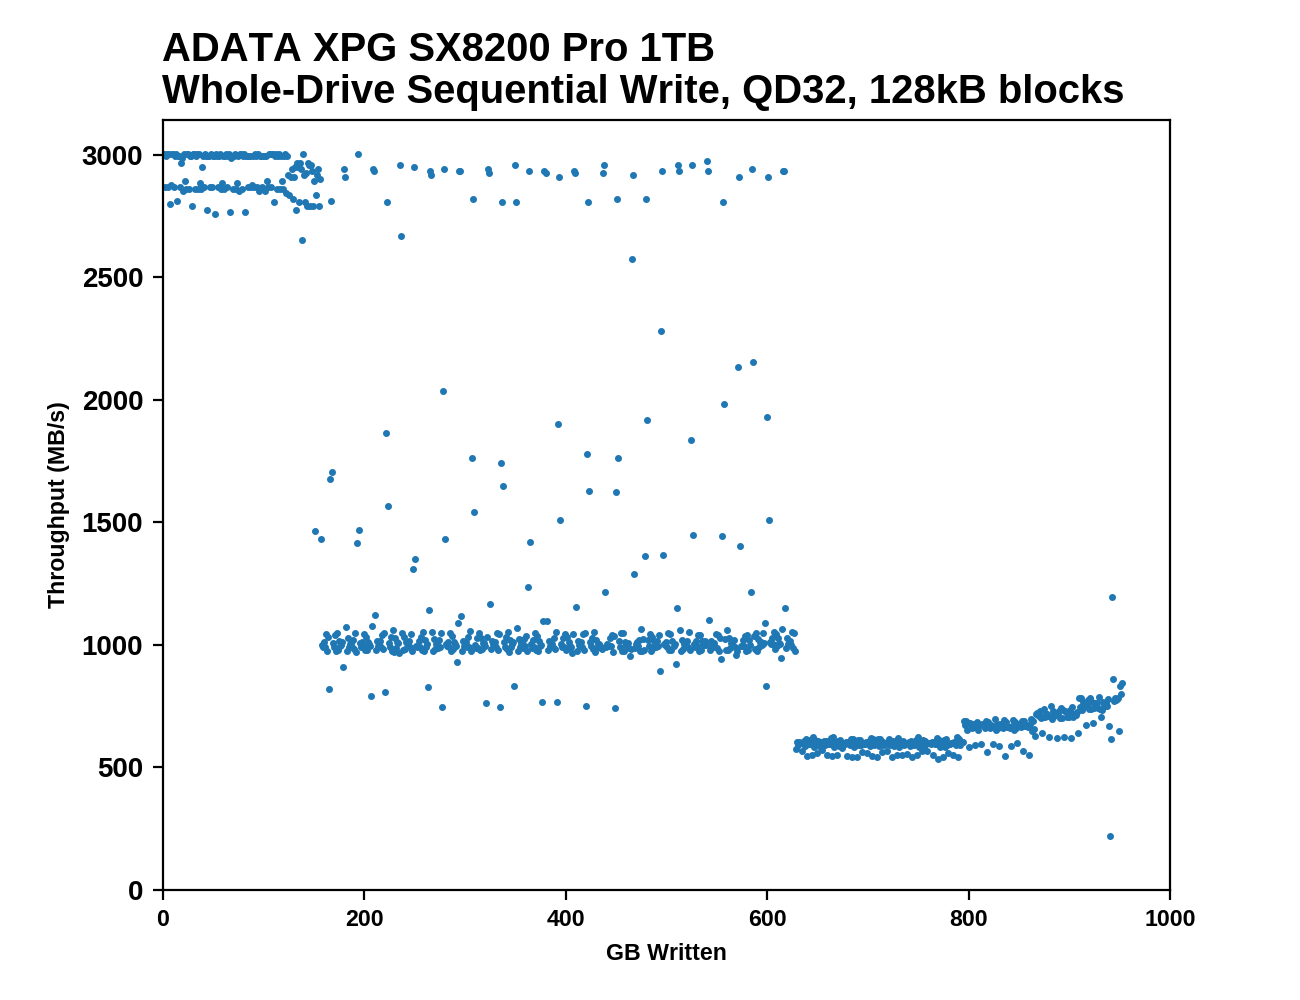
This test starts with a freshly-erased drive and fills it with 128kB sequential writes at queue depth 32, recording the write speed for each 1GB segment. This test is not representative of any ordinary client/consumer usage pattern, but it does allow us to observe transitions in the drive's behavior as it fills up. This can allow us to estimate the size of any SLC write cache, and get a sense for how much performance remains on the rare occasions where real-world usage keeps writing data after filling the cache.
 |
|||||||||
The process of filling up a SM2262EN drive with sequential writes can be divided into three distinct phases. First is writing to the SLC cache at around 3 GB/s. The SM2262EN drives have the largest write caches we've seen in a TLC drive: where the 1TB HP EX920's speed first drops after about 136 GB, the 1TB SX8200 Pro lasts for about 150 GB and the 1TB HP EX950 goes slightly further with its first significant speed drop occurring after 156 GB. At this point, just shy of half of the drive's NAND cells are being treated as SLC.
Once that fills up, we see a middle phase where the writes mostly bypass the SLC cache and go straight to TLC, at around 1 GB/s for the 1TB models and 1.5 GB/s for the 2TB. During this middle phase there is some background work to flush the SLC cache which occasionally gets in the way of writing new data, but also means there are frequent momentary bursts back up to SLC write speed.
The final phase occurs when the TLC portion of the drive fills up and the drive has to start shrinking the SLC cache. Each new chunk of data the host sends requires the controller to free up some space by folding data in the SLC cache into TLC blocks, and these competing processes impose a significant performance hit now that the folding cannot be treated as low-priority. However, as the drive approaches 100% full, the SLC cache shrinks and performance creeps back up toward what we saw during the middle phase.
 |
|||||||||
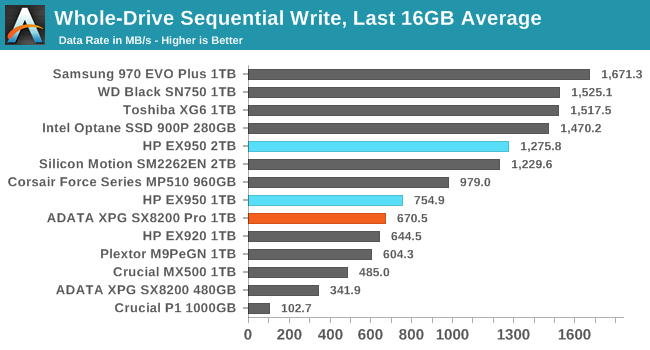
| Average Throughput for last 16 GB | Overall Average Throughput | ||||||||
The SM2262EN drives improve over their predecessors in post-SLC write speeds, but still lag far behind most other high-end TLC drives. The performance stays above SATA speeds for the entire drive fill process, but Samsung, Toshiba and Western Digital all have TLC drives that can maintain 1.5GB/s. The 2TB EX950 averages about that speed during the middle phase of writing directly to TLC, but its overall average is only about 1.3GB/s, and the 1TB models average under 1GB/s.
BAPCo SYSmark 2018
BAPCo's SYSmark 2018 is an application-based benchmark that uses real-world applications to replay usage patterns of business users, with subscores for productivity, creativity and responsiveness. Scores represnt overall system performance and are calibrated against a reference system that is defined to score 1000 in each of the scenarios. A score of, say, 2000, would imply that the system under test is twice as fast as the reference system.
SYSmark scores are based on total application response time as seen by the user, including not only storage latency but time spent by the processor. This means there's a limit to how much a storage improvement could possibly increase scores, because the SSD is only in use for a small fraction of the total test duration. This is a significant difference from our ATSB tests where only the storage portion of the workload is replicated and disk idle times are cut short to a maximum of 25ms.
| AnandTech SYSmark SSD Testbed | |
| CPU | Intel Core i5-7400 |
| Motherboard | ASUS PRIME Z270-A |
| Chipset | Intel Z270 |
| Memory | 2x 8GB Corsair Vengeance DDR4-2400 CL17 |
| Case | In Win C583 |
| Power Supply | Cooler Master G550M |
| OS | Windows 10 64-bit, version 1803 |
Our SSD testing with SYSmark uses a different test system than the rest of our SSD tests. This machine is set up to measure total system power consumption rather than just the drive's power.
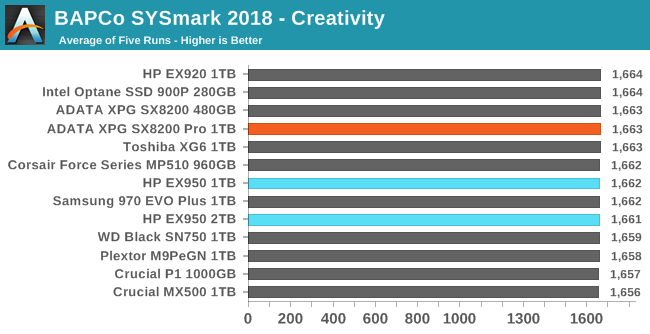
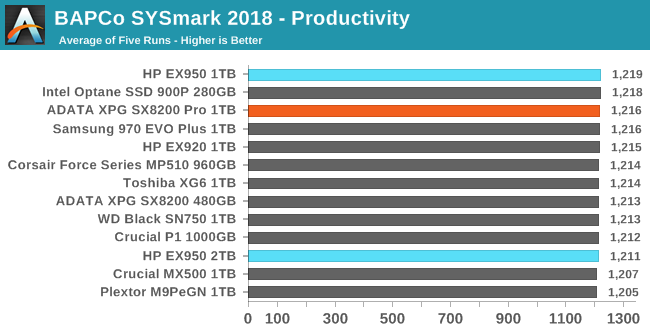
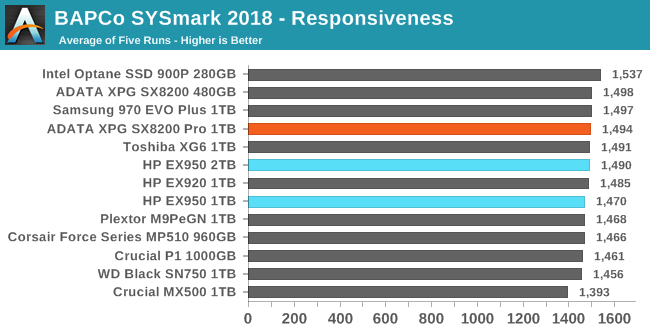
Storage improvements make little to no difference in SYSmark performance on our quad-core test system with integrated graphics. Only the responsiveness test shows a spread of scores that's wider than the normal variation between runs, and the gap between a SATA SSD and an Intel Optane SSD is still only 10%, with high-end TLC NVMe drives falling in the middle.
Energy Usage
The SYSmark energy usage scores measure total system power consumption, excluding the display. Our SYSmark test system idles at around 26 W and peaks at over 60 W measured at the wall during the benchmark run. SATA SSDs seldom exceed 5 W and idle at a fraction of a watt, and the SSDs spend most of the test idle. This means the energy usage scores will inevitably be very close. A typical notebook system will tend to be better optimized for power efficiency than this desktop system, so the SSD would account for a much larger portion of the total and the score difference between SSDs would be more noticeable.
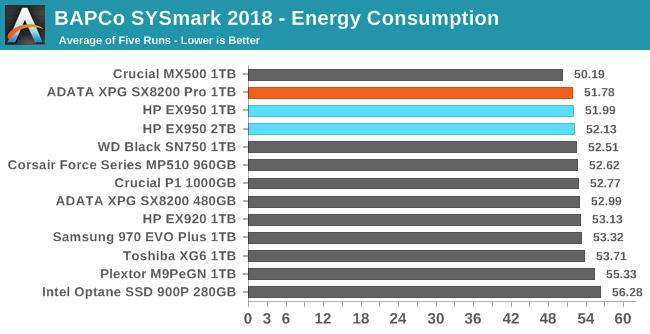
The energy consumption scores show more meaningful differences between drives than the performance scores, though it's still not enough to matter to desktop use. The NVMe drives are all still clearly more power-hungry than decent SATA drives, but the SM2262EN drives close the gap slightly.


42 Comments
View All Comments
mapesdhs - Thursday, February 7, 2019 - link
I can't help wondering how some of the old favourites would behave in these comparisons, the 950 EVO/Pro, 960s, etc. Have things really moved on that much?Billy Tallis - Thursday, February 7, 2019 - link
We have at least partial test results in Bench for most of the old drives that aren't worth including in every review: https://www.anandtech.com/bench/product/2219?vs=23...eddieobscurant - Thursday, February 7, 2019 - link
It's not about crystal disk mark score. It's about almost no one of the everyday user, playing games, surfing the web and using microsoft office, will come near your "light" test, let alone "heavy" or "torture".Most of them need high random reads for their computer to feel snappy and responsive, and a big enough a slc cache to accommodate a full bluray of writes.
Billy Tallis - Thursday, February 7, 2019 - link
"Most of them need high random reads for their computer to feel snappy and responsive,"They already have that. Further increases to random read performance won't make the system feel any more responsive during light workloads, as demonstrated by SYSmark. High-end NVMe SSDs are already way past the point of diminishing returns for peak random read speeds, especially for lighter workloads where a few GB of DRAM used by the OS for caching is enough to almost completely decouple storage performance from application responsiveness.
eddieobscurant - Friday, February 8, 2019 - link
So, you're saying that optane doesn't feel more responsive to you, or that the high random reads of optane isn't responsible for feeling more responsive than a high end nvme ssd ?Dark_wizzie - Wednesday, February 6, 2019 - link
Why does perf drop on 2tb model?Dark_wizzie - Thursday, February 7, 2019 - link
For low qd random reads, sorry.Dark_wizzie - Thursday, February 7, 2019 - link
And... serves me right for commenting before finishing the last page of the article. >.>oh well.
GreenReaper - Thursday, February 7, 2019 - link
Grabbed an MX500 500GB at Christmas. It's half the price of those tested here, and uses up a spare SATA. Hardly the fastest SSD in the world, but for most purposes it's hard to tell the difference.mapesdhs - Thursday, February 7, 2019 - link
They do seem to be well priced, though I bagged several barely used 850 Pro 512GB units for about the same cost, people seem to be selling them for silly money these days, grud knows why. The 840 Pro is also still very good, one of the most reliable SATA SSDs ever made.