The Intel Xeon W-3175X Review: 28 Unlocked Cores, $2999
by Ian Cutress on January 30, 2019 9:00 AM ESTCPU Performance: Rendering Tests
Rendering is often a key target for processor workloads, lending itself to a professional environment. It comes in different formats as well, from 3D rendering through rasterization, such as games, or by ray tracing, and invokes the ability of the software to manage meshes, textures, collisions, aliasing, physics (in animations), and discarding unnecessary work. Most renderers offer CPU code paths, while a few use GPUs and select environments use FPGAs or dedicated ASICs. For big studios however, CPUs are still the hardware of choice.
All of our benchmark results can also be found in our benchmark engine, Bench.
For our graphs, some of them have two values: a regular value in orange, and one in red called 'Intel Spec'. ASUS offers the option to 'open up' the power and current limits of the chip, so the CPU is still running at the same frequency but is not throttled. Despite Intel saying that they recommend 'Intel Spec', the system they sent to us to test was actually set up with the power limits opened up, and the results they provided for us to compare to internally also correlated with that setting. As a result, we're providing both sets results for our CPU tests.
Corona 1.3: Performance Render
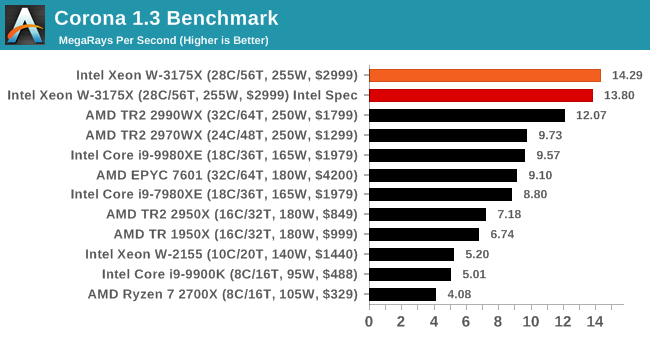
An advanced performance based renderer for software such as 3ds Max and Cinema 4D, the Corona benchmark renders a generated scene as a standard under its 1.3 software version. Normally the GUI implementation of the benchmark shows the scene being built, and allows the user to upload the result as a ‘time to complete’.
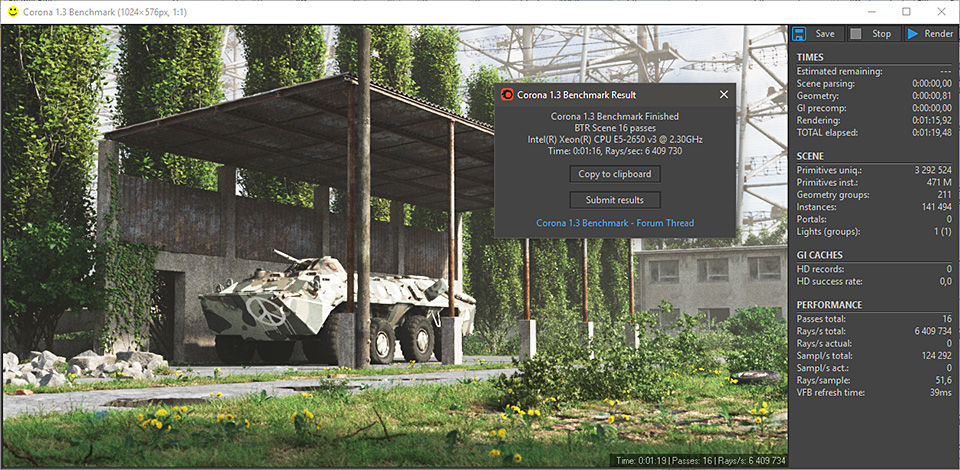
We got in contact with the developer who gave us a command line version of the benchmark that does a direct output of results. Rather than reporting time, we report the average number of rays per second across six runs, as the performance scaling of a result per unit time is typically visually easier to understand.
The Corona benchmark website can be found at https://corona-renderer.com/benchmark
.
Blender 2.79b: 3D Creation Suite
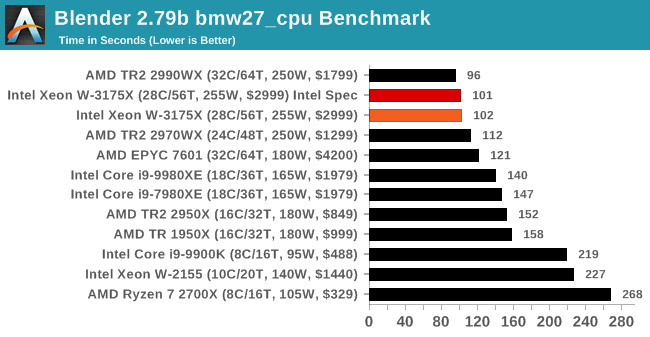
A high profile rendering tool, Blender is open-source allowing for massive amounts of configurability, and is used by a number of high-profile animation studios worldwide. The organization recently released a Blender benchmark package, a couple of weeks after we had narrowed our Blender test for our new suite, however their test can take over an hour. For our results, we run one of the sub-tests in that suite through the command line - a standard ‘bmw27’ scene in CPU only mode, and measure the time to complete the render.
Blender can be downloaded at https://www.blender.org/download/
.
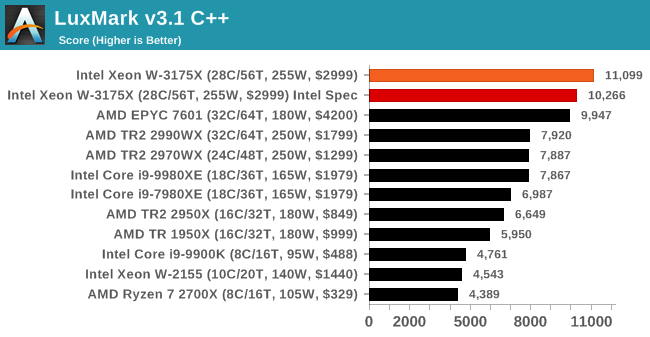
LuxMark v3.1: LuxRender via Different Code Paths
As stated at the top, there are many different ways to process rendering data: CPU, GPU, Accelerator, and others. On top of that, there are many frameworks and APIs in which to program, depending on how the software will be used. LuxMark, a benchmark developed using the LuxRender engine, offers several different scenes and APIs.
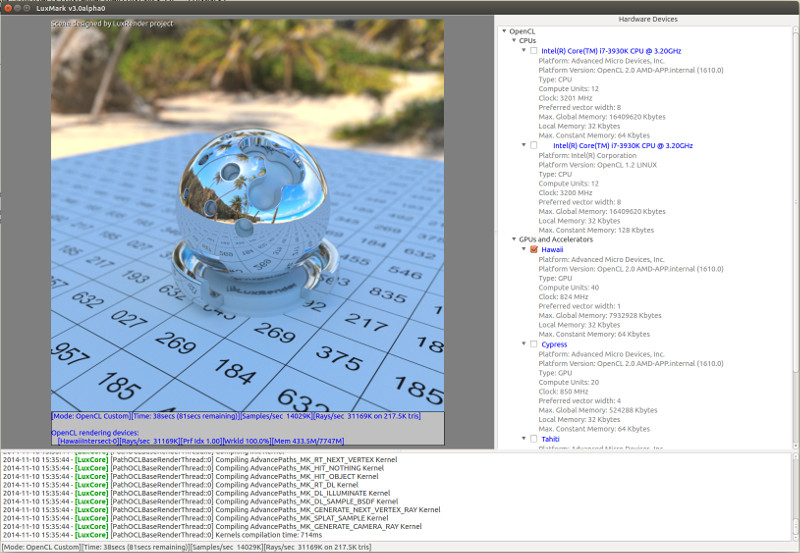
Taken from the Linux Version of LuxMark
In our test, we run the simple ‘Ball’ scene on both the C++ and OpenCL code paths, but in CPU mode. This scene starts with a rough render and slowly improves the quality over two minutes, giving a final result in what is essentially an average ‘kilorays per second’.
.
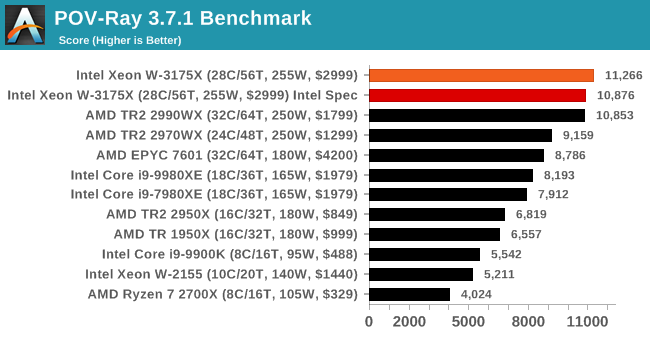
POV-Ray 3.7.1: Ray Tracing
The Persistence of Vision ray tracing engine is another well-known benchmarking tool, which was in a state of relative hibernation until AMD released its Zen processors, to which suddenly both Intel and AMD were submitting code to the main branch of the open source project. For our test, we use the built-in benchmark for all-cores, called from the command line.
POV-Ray can be downloaded from http://www.povray.org/
.


136 Comments
View All Comments
Yorgos - Wednesday, January 30, 2019 - link
it's not only program dependent, it's also scheduler dependent.It is found that the windows scheduler doesn't treat TR very well and throttles it down.(ref. L1T)
MattZN - Wednesday, January 30, 2019 - link
Yup, in a nutshell. When Microsoft finally fixes that scheduler issue all of these sites will have to rerun their benchmarks. While it won't run away on performance, the results will start to look more like they should given the HW capabilities. Not a problem for me with Linux but its kinda amusing that Windows users are so beholden to bugs like these and even the professional reviewers get lost when there isn't a convenient UI button that explains what is going on.-Matt
mapesdhs - Saturday, February 2, 2019 - link
Is that the same issue as the one referring to running on core zero? I watched a video about it recently but I can't recall if it was L1T or elsewhere.jospoortvliet - Sunday, February 3, 2019 - link
it is that issue yes. blocking use of core is a work-around that kind'a works.jospoortvliet - Sunday, February 3, 2019 - link
(in some workloads, not all)Coolmike980 - Monday, February 4, 2019 - link
So here's my thing: Why can't we have good benchmarks? Nothing here on Linux, and nothing in a VM. I'd be willing to be good money I could take a 2990, run Linux, run 5 VM's of 6 cores each, run these benchmarks (the non-gpu dependent ones), and collectively beat the pants off of this CPU under any condition you want to run it. Also, this Civ 6 thing - the only benchmark that would be of any value would be the CPU one, and they've been claiming to want to make this work for 2 years now. Either get it working, or drop it altogether. Rant over. Thanks.FlanK3r - Wednesday, January 30, 2019 - link
where is CinebenchR15 results? In testing methology is it, but in results I can not find it :)MattsMechanicalSSI - Wednesday, January 30, 2019 - link
der8auer did a delid video, and a number of CB runs. https://www.youtube.com/watch?v=aD9B-uu8At8 Also, Steve at GN has had a good look at it. https://www.youtube.com/watch?v=N29jTOjBZrwMattZN - Wednesday, January 30, 2019 - link
@MattsMechanicalSSI Yup... both are very telling.I give the 3175X a pass on DDR connectivity (from the DerBauer video) since he's constantly having to socket and unsocket the chip, but I agree with him that there should be a carrier for a chip that large. Depending on the user to guess the proper pressure is a bad idea.
But, particularly the GN review around 16:00 or so where we see the 3175X pulling 672W at the wall (OC) for a tiny improvement in time over the 2990WX. Both AMD and Intel goose these CPUs, even at stock, but the Intel numbers are horrendous. They aren't even trying to keep wattages under control.
The game tests are more likely an issue with the windows scheduler (ala Wendel's work). And the fact that nobody in their right mind runs games on these CPUs.
The Xeon is certainly a faster CPU, but the price and the wattage cost kinda make it a non-starter. There's really no point to it, not even for professional work. Steve (GN) kinda thinks that there might be a use-case with Premier but... I don't really. At least not for the ~5 months or so before we get the next node on AMD (and ~11 months for Intel).
-Matt
mapesdhs - Saturday, February 2, 2019 - link
Cinebench is badly broken at this level of cores, it's not scaling properly anymore. See:https://www.servethehome.com/cinebench-r15-is-now-...