The Intel Xeon W-3175X Review: 28 Unlocked Cores, $2999
by Ian Cutress on January 30, 2019 9:00 AM ESTCPU Performance: Rendering Tests
Rendering is often a key target for processor workloads, lending itself to a professional environment. It comes in different formats as well, from 3D rendering through rasterization, such as games, or by ray tracing, and invokes the ability of the software to manage meshes, textures, collisions, aliasing, physics (in animations), and discarding unnecessary work. Most renderers offer CPU code paths, while a few use GPUs and select environments use FPGAs or dedicated ASICs. For big studios however, CPUs are still the hardware of choice.
All of our benchmark results can also be found in our benchmark engine, Bench.
For our graphs, some of them have two values: a regular value in orange, and one in red called 'Intel Spec'. ASUS offers the option to 'open up' the power and current limits of the chip, so the CPU is still running at the same frequency but is not throttled. Despite Intel saying that they recommend 'Intel Spec', the system they sent to us to test was actually set up with the power limits opened up, and the results they provided for us to compare to internally also correlated with that setting. As a result, we're providing both sets results for our CPU tests.
Corona 1.3: Performance Render
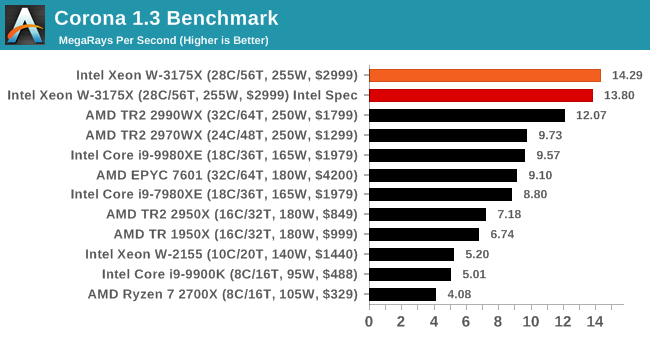
An advanced performance based renderer for software such as 3ds Max and Cinema 4D, the Corona benchmark renders a generated scene as a standard under its 1.3 software version. Normally the GUI implementation of the benchmark shows the scene being built, and allows the user to upload the result as a ‘time to complete’.
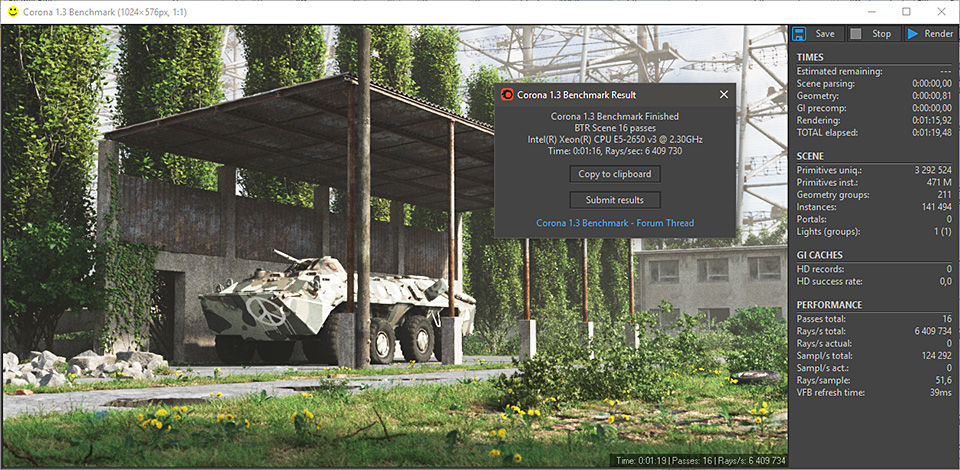
We got in contact with the developer who gave us a command line version of the benchmark that does a direct output of results. Rather than reporting time, we report the average number of rays per second across six runs, as the performance scaling of a result per unit time is typically visually easier to understand.
The Corona benchmark website can be found at https://corona-renderer.com/benchmark
.
Blender 2.79b: 3D Creation Suite
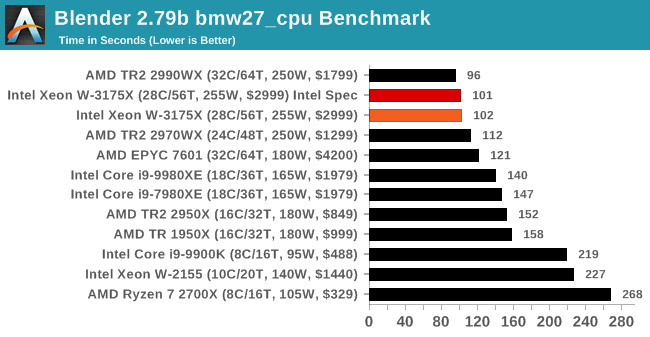
A high profile rendering tool, Blender is open-source allowing for massive amounts of configurability, and is used by a number of high-profile animation studios worldwide. The organization recently released a Blender benchmark package, a couple of weeks after we had narrowed our Blender test for our new suite, however their test can take over an hour. For our results, we run one of the sub-tests in that suite through the command line - a standard ‘bmw27’ scene in CPU only mode, and measure the time to complete the render.
Blender can be downloaded at https://www.blender.org/download/
.
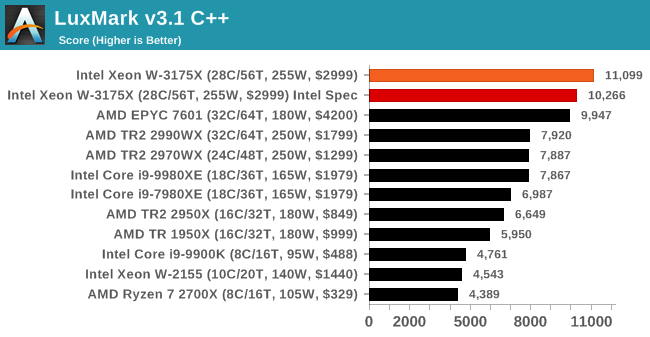
LuxMark v3.1: LuxRender via Different Code Paths
As stated at the top, there are many different ways to process rendering data: CPU, GPU, Accelerator, and others. On top of that, there are many frameworks and APIs in which to program, depending on how the software will be used. LuxMark, a benchmark developed using the LuxRender engine, offers several different scenes and APIs.
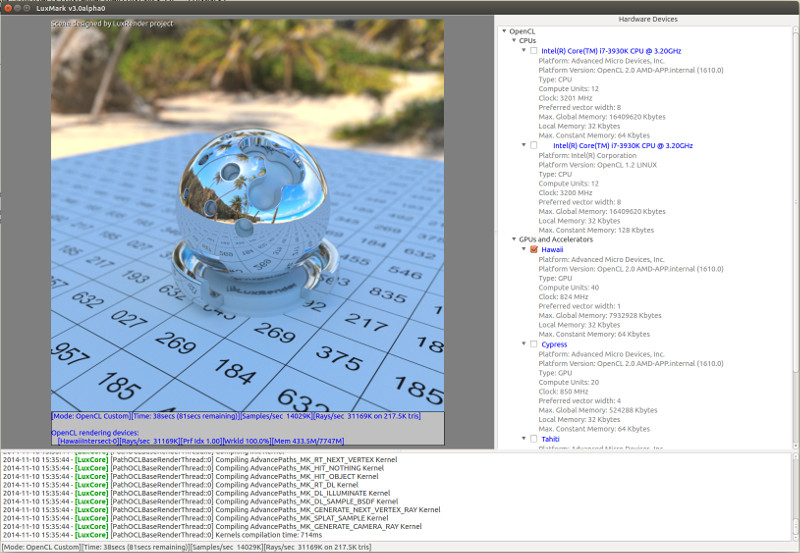
Taken from the Linux Version of LuxMark
In our test, we run the simple ‘Ball’ scene on both the C++ and OpenCL code paths, but in CPU mode. This scene starts with a rough render and slowly improves the quality over two minutes, giving a final result in what is essentially an average ‘kilorays per second’.
.
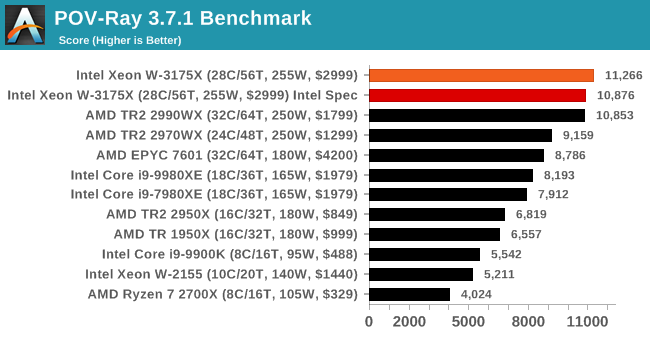
POV-Ray 3.7.1: Ray Tracing
The Persistence of Vision ray tracing engine is another well-known benchmarking tool, which was in a state of relative hibernation until AMD released its Zen processors, to which suddenly both Intel and AMD were submitting code to the main branch of the open source project. For our test, we use the built-in benchmark for all-cores, called from the command line.
POV-Ray can be downloaded from http://www.povray.org/
.


136 Comments
View All Comments
tamalero - Wednesday, January 30, 2019 - link
Aaah yes.. the presenter "forgot" to say it was heavily overclocked..arh2o - Wednesday, January 30, 2019 - link
Hey Ian, nice review. But you guys really need to stop testing games with an ancient GTX 1080 from 1H 2016...it's almost 3 years old now. You're clearly GPU bottle-necked on a bunch of these games you've benchmarked. At least use a RTX 2080, but if you're really insistent on keeping the GTX 1080, bench at 720p with it instead of your IGP. For example:Final Fantasy XV: All your CPUs have FPS between 1-4 frames of difference. Easy to spot GPU bottleneck here.
Shadow of War Low: Ditto, all CPUs bench within the 96-100 FPS range. Also, what's the point of even including the medium and high numbers? It's decimal point differences on the FPS, not even a whole number difference. Clearly GPU bottle-necked here even at 1080p unfortunately.
eddman - Wednesday, January 30, 2019 - link
Xeons don't even have an IGP. That IGP in the tables is simply the name they chose for that settings, which includes 720 resolution, since it represents a probable use case for an IGP.Anyway, you are right about the card. They should've used a faster one, although IMO game benchmarks are pointless for such CPUs.
BushLin - Wednesday, January 30, 2019 - link
I'm glad they're using the same card for years so it can be directly compared to previous benchmarks and we can see how performance scales with cores vs clock speed.Mitch89 - Friday, February 1, 2019 - link
That’s a poor rationale, you wouldn’t pair a top-end CPU with an outdated GPU if you were building a system that needs both CPU and GPU performance.SH3200 - Wednesday, January 30, 2019 - link
For all the jokes its getting doesn't the 7290F actually run at a higher TDP using the same socket? Intel couldn't have just have taken the coolers from the Xeon DAP WSes and used those instead?evernessince - Wednesday, January 30, 2019 - link
How is 3K priced right? You can purchased a 2990WX for half that price and 98% of the performance. $1,500 is a lot of extra money in your wallet.GreenReaper - Thursday, January 31, 2019 - link
Maybe they thought since it was called the 2990WX it cost $2990...tygrus - Wednesday, January 30, 2019 - link
1) A few cases showed the 18core Intel CPU beat their 28core. I assume the benchmark and/or OS is contributing to a reduced performance for the 28 core Intel and the 32 core AMD (TR 2950 beats TR 2990 a few times).2) Do you really want to use 60% more power for <25% increase of performance?
3) This chip is a bit like the 1.13GHz race in terms of such a small release & high cost it should be ignored by most of us as a marketing stunt.
GreenReaper - Thursday, January 31, 2019 - link
Fewer cores may be able to boost faster and have less contention for shared resources such as memory bandwidth. This CPU tends to only win by any significant margin when it whenuse all of its cores. Heck, you have the 2700X up there in many cases.