Gemini Lake SFF PC Showdown: Intel's June Canyon (NUC7PJYH) and ECS's LIVA Z2 Reviewed
by Ganesh T S on December 20, 2018 8:00 AM ESTUL Benchmarks - PCMark and 3DMark
This section deals with a selection of the UL Futuremark benchmarks - PCMark 10, PCMark 8, and 3DMark. While the first two evaluate the system as a whole, 3DMark focuses on the graphics capabilities.
PCMark 10
UL's PCMark 10 evaluates computing systems for various usage scenarios (generic / essential tasks such as web browsing and starting up applications, productivity tasks such as editing spreadsheets and documents, gaming, and digital content creation). We benchmarked select PCs with the PCMark 10 Extended profile and recorded the scores for various scenarios. These scores are heavily influenced by the CPU and GPU in the system, though the RAM and storage device also play a part. The power plan was set to Balanced for all the PCs while processing the PCMark 10 benchmark.
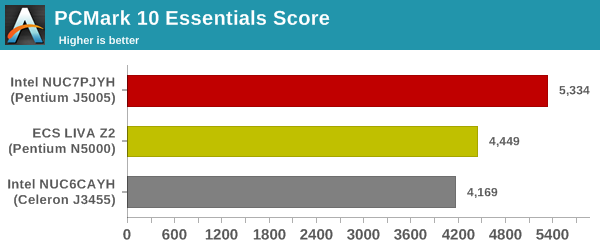
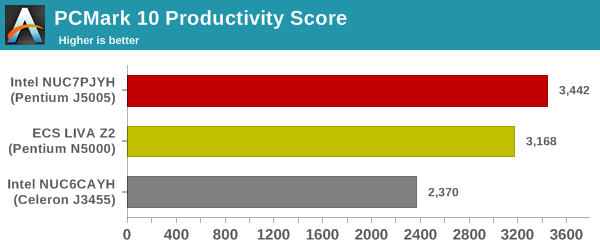
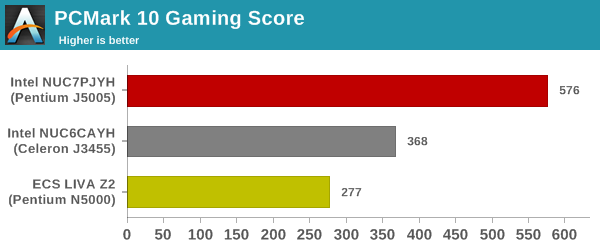
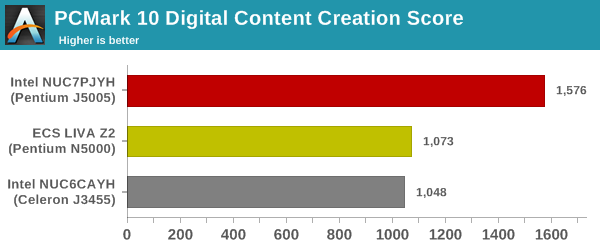
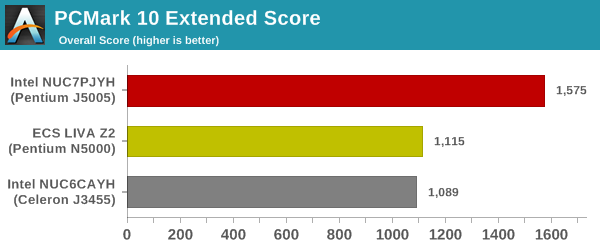
Other than the gaming scenario, the passively-cooled ECS LIVA Z2 turns out to be better than the Arches Canyon NUC. The June Canyon NUC comes out on by a huge margin.
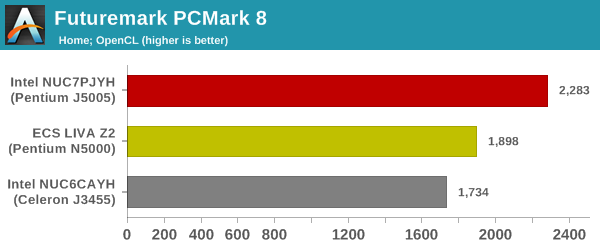
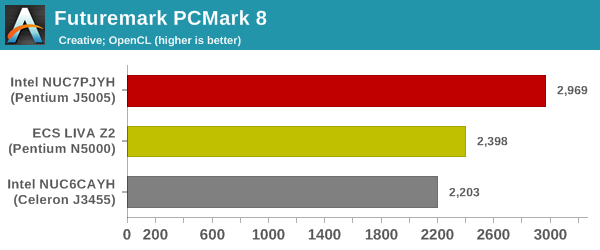
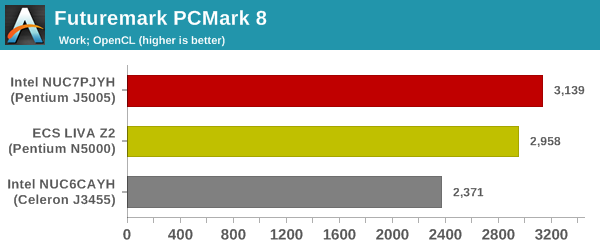
PCMark 8
We continue to present PCMark 8 benchmark results (as those have more comparison points) while our PCMark 10 scores database for systems grows in size. PCMark 8 provides various usage scenarios (home, creative and work) and offers ways to benchmark both baseline (CPU-only) as well as OpenCL accelerated (CPU + GPU) performance. We benchmarked select PCs for the OpenCL accelerated performance in all three usage scenarios. These scores are heavily influenced by the CPU in the system. Despite its passive cooling, the ECS LIVA Z2 is a step ahead of the Arches Canyon NUC in all the workloads.
3DMark
UL's 3DMark comes with a diverse set of graphics workloads that target different Direct3D feature levels. Correspondingly, the rendering resolutions are also different. We use 3DMark 2.4.4264 to get an idea of the graphics capabilities of the system. In this section, we take a look at the performance of the Gemini Lake UCFF PCs across the different 3DMark workloads.
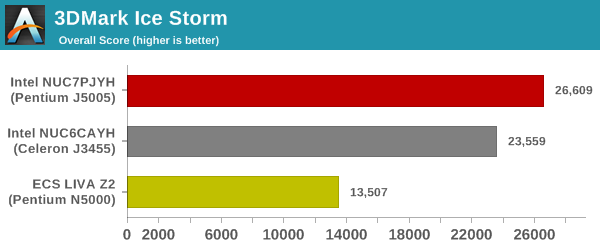
3DMark Ice Storm
This workload has three levels of varying complexity - the vanilla Ice Storm, Ice Storm Unlimited, and Ice Storm Extreme. It is a cross-platform benchmark (which means that the scores can be compared across different tablets and smartphones as well). All three use DirectX 11 (feature level 9) / OpenGL ES 2.0. While the Extreme renders at 1920 x 1080, the other two render at 1280 x 720. The graphs below present the various Ice Storm worloads' numbers for different systems that we have evaluated.
| UL 3DMark - Ice Storm Workloads | |||
3DMark Cloud Gate
The Cloud Gate workload is meant for notebooks and typical home PCs, and uses DirectX 11 (feature level 10) to render frames at 1280 x 720. The graph below presents the overall score for the workload across all the systems that are being compared.

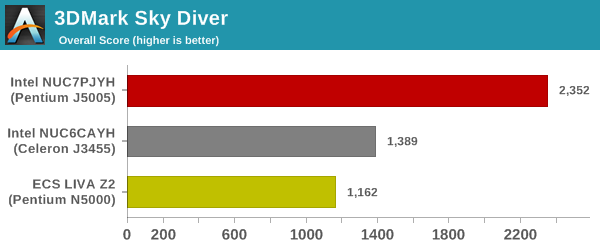
3DMark Sky Diver
The Sky Diver workload is meant for gaming notebooks and mid-range PCs, and uses DirectX 11 (feature level 11) to render frames at 1920 x 1080. The graph below presents the overall score for the workload across all the systems that are being compared.
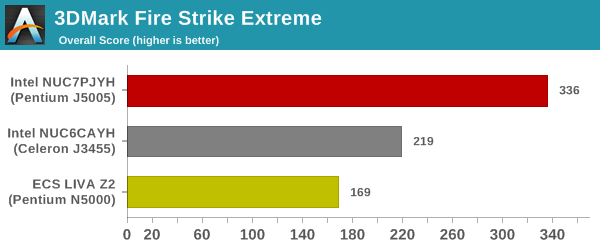
3DMark Fire Strike Extreme
The Fire Strike benchmark has three workloads. The base version is meant for high-performance gaming PCs. Similar to Sky Diver, it uses DirectX 11 (feature level 11) to render frames at 1920 x 1080. The Ultra version targets 4K gaming system, and renders at 3840 x 2160. However, we only deal with the Extreme version in our benchmarking - It renders at 2560 x 1440, and targets multi-GPU systems and overclocked PCs. The graph below presents the overall score for the Fire Strike Extreme benchmark across all the systems that are being compared.
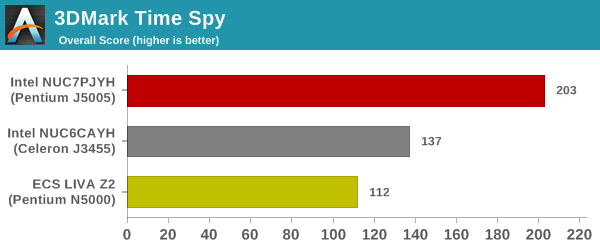
3DMark Time Spy
The Time Spy workload has two levels with different complexities. Both use DirectX 12 (feature level 11). However, the plain version targets high-performance gaming PCs with a 2560 x 1440 render resolution, while the Extreme version renders at 3840 x 2160 resolution. The graphs below present both numbers for all the systems that are being compared in this review.
| UL 3DMark - Time Spy Workloads | |||
3DMark Night Raid
The Night Raid workload is a DirectX 12 benchmark test. It is less demanding than Time Spy, and is optimized for integrated graphics. The graph below presents the overall score in this workload for different system configurations.
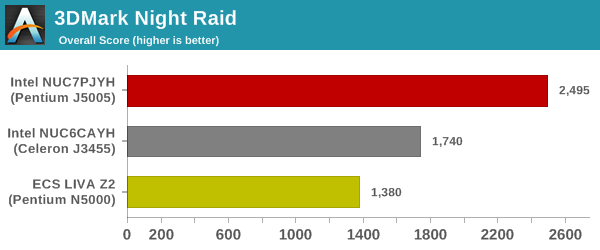
In terms of GPU performance, being actively cooled helps the Arches Canyon NUC come in second place for almost all relevant cases


59 Comments
View All Comments
Death666Angel - Thursday, December 20, 2018 - link
One of the few times Intel ark is wrong in my experience. A lot of the Atom SKUs have wrong max memory sizes.mczak - Thursday, December 20, 2018 - link
It is not really wrong per se. This is intel's official stance, those chips only support 8GB in total, apparently they want to sell you Core-based chips if you need more.But luckily intel didn't go that far and actually really limited them to 8GB, so yes from a technical perspective the ark pages are wrong.
Noone (at least for home use) should ever care about the official max memory limit (well as long as they know it's only a marketing limitation...).
Jorgp2 - Thursday, December 20, 2018 - link
Gemini Lake was also originally listed as supporting HDR10, but was later correctedRyan Smith - Thursday, December 20, 2018 - link
"The configuration comparison table on the first page is broken."Fixed! Thanks for the heads up.
fackamato - Thursday, December 20, 2018 - link
Any chance you can include non-NUC systems on the charts? The graphs are great to see which of the 3 NUCs are faster... but that does not give me a sense of how much slower (if any) these are to a mATX PC, or a 45w CPU, or an AMD APU etc.ganeshts - Thursday, December 20, 2018 - link
These are results based on our new Fall 2018+ benchmark suite - We actually re-benched a whole lot of systems (starting with the Coffee Lake SODIMM memory scaling piece). I have some other results from systems targeting a different market segment, and I will add them in for the next Gemini Lake review (probably mid Q1 2019)mode_13h - Friday, December 21, 2018 - link
Please do.Thanks.
Mikewind Dale - Thursday, December 20, 2018 - link
In the meantime, the Cinebench R15 scores are useful for comparisons. That benchmark is widely available for a variety of CPUs.Just for comparison, I have a Core i7-7500U dual core laptop that gets 145/345 in Cinebench R15.
And online, I see the Core i7-8550U gets a median of 164/558.
drzzz - Thursday, December 20, 2018 - link
Thanks for fixing the table on page 1. Now my question is why is a the Liva with one 4GB stick (single channel memory mode) even being compared to the 32GB NUC? That is really a big configuration difference. Or is the table wrong it was 2 4GB sticks?ganeshts - Thursday, December 20, 2018 - link
We reviewed the configuration that was sampled to us by ECS. I complained to them about the single-channel configuration holding back performance a bit, but they didn't care :)As I mentioned in another comment, the 32GB was just to show everyone that the NUC could support it even though it is unofficial.
To be honest, the *amount* of RAM has very little impact on most of the benchmark numbers. Yes, I do agree single vs. dual slot fill up makes a bit of a difference.