Gemini Lake SFF PC Showdown: Intel's June Canyon (NUC7PJYH) and ECS's LIVA Z2 Reviewed
by Ganesh T S on December 20, 2018 8:00 AM ESTBAPCo SYSmark 2018
The Gemini Lake UCFF PCs were evaluated using our Fall 2018 test suite for small-form factor PCs. In the first section, we will be looking at SYSmark 2018.
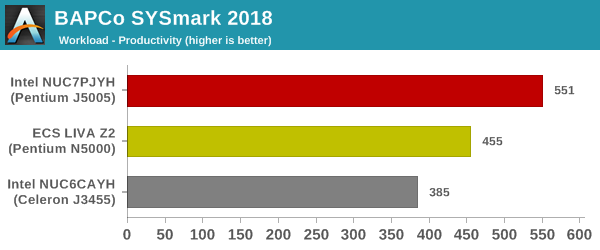
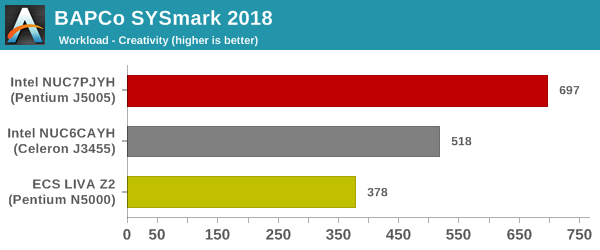
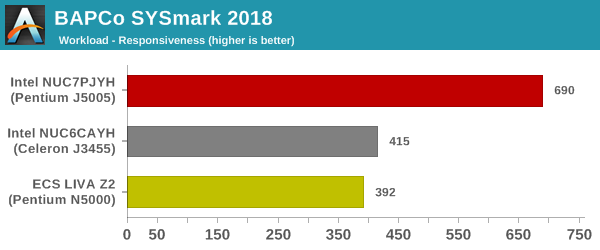
BAPCo's SYSmark 2018 is an application-based benchmark that uses real-world applications to replay usage patterns of business users in the areas of productivity, creativity, and responsiveness. The 'Productivity Scenario' covers office-centric activities including word processing, spreadsheet usage, financial analysis, software development, application installation, file compression, and e-mail management. The 'Creativity Scenario' represents media-centric activities such as digital photo processing, AI and ML for face recognition in photos and videos for the purpose of content creation, etc. The 'Responsiveness Scenario' evaluates the ability of the system to react in a quick manner to user inputs in areas such as application and file launches, web browsing, and multi-tasking.
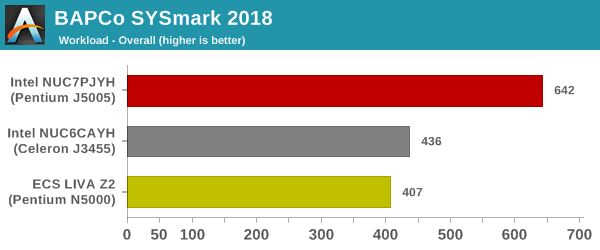
Scores are meant to be compared against a reference desktop (the SYSmark 2018 calibration system, a Dell Optiplex 5050 tower with a Core i3-7100 and 4GB of DDR4-2133 memory to go with a 128GB M.2 SATA III SSD). The calibration system scores 1000 in each of the scenarios. A score of, say, 2000, would imply that the system under test is twice as fast as the reference system.
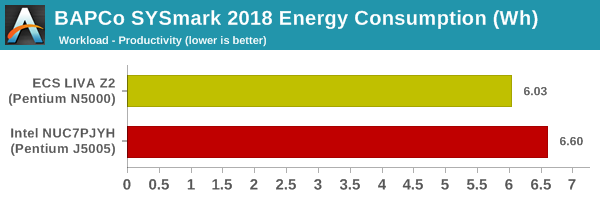
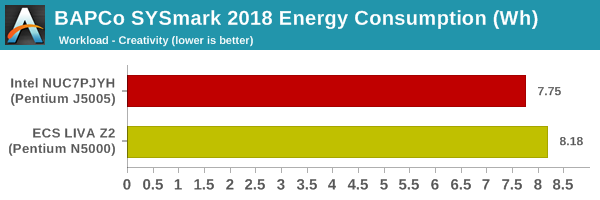
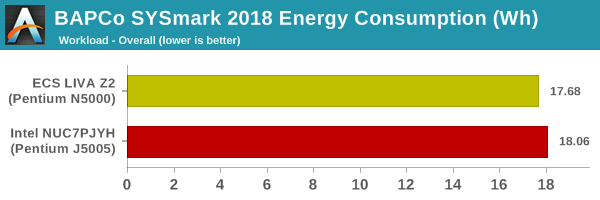
SYSmark 2018 also adds energy measurement to the mix. A high score in the SYSmark benchmarks might be nice to have, but, potential customers also need to determine the balance between power consumption and the efficiency of the system. For example, in the average office scenario, it might not be worth purchasing a noisy and power-hungry PC just because it ends up with a 2000 score in the SYSmark 2014 SE benchmarks. In order to provide a balanced perspective, SYSmark 2018 also allows vendors and decision makers to track the energy consumption during each workload. In the graphs below, we find the total energy consumed by the PC under test for a single iteration of each SYSmark 2018 workload. For reference, the calibration system consumes 5.36 Wh for productivity, 7.71 Wh for creativity, 5.61 Wh for responsiveness, and 18.68 Wh overall.

Despite being passively cooled, the ECS LIVA Z2 manages to put up a credible fight against the actively-cooled Arches Canyon NUC. Other than that, the scores are along expected lines, with the June Canyon NUC coming out on top (due to its use of the most powerful Gemini Lake SoC available).


59 Comments
View All Comments
Death666Angel - Thursday, December 20, 2018 - link
One of the few times Intel ark is wrong in my experience. A lot of the Atom SKUs have wrong max memory sizes.mczak - Thursday, December 20, 2018 - link
It is not really wrong per se. This is intel's official stance, those chips only support 8GB in total, apparently they want to sell you Core-based chips if you need more.But luckily intel didn't go that far and actually really limited them to 8GB, so yes from a technical perspective the ark pages are wrong.
Noone (at least for home use) should ever care about the official max memory limit (well as long as they know it's only a marketing limitation...).
Jorgp2 - Thursday, December 20, 2018 - link
Gemini Lake was also originally listed as supporting HDR10, but was later correctedRyan Smith - Thursday, December 20, 2018 - link
"The configuration comparison table on the first page is broken."Fixed! Thanks for the heads up.
fackamato - Thursday, December 20, 2018 - link
Any chance you can include non-NUC systems on the charts? The graphs are great to see which of the 3 NUCs are faster... but that does not give me a sense of how much slower (if any) these are to a mATX PC, or a 45w CPU, or an AMD APU etc.ganeshts - Thursday, December 20, 2018 - link
These are results based on our new Fall 2018+ benchmark suite - We actually re-benched a whole lot of systems (starting with the Coffee Lake SODIMM memory scaling piece). I have some other results from systems targeting a different market segment, and I will add them in for the next Gemini Lake review (probably mid Q1 2019)mode_13h - Friday, December 21, 2018 - link
Please do.Thanks.
Mikewind Dale - Thursday, December 20, 2018 - link
In the meantime, the Cinebench R15 scores are useful for comparisons. That benchmark is widely available for a variety of CPUs.Just for comparison, I have a Core i7-7500U dual core laptop that gets 145/345 in Cinebench R15.
And online, I see the Core i7-8550U gets a median of 164/558.
drzzz - Thursday, December 20, 2018 - link
Thanks for fixing the table on page 1. Now my question is why is a the Liva with one 4GB stick (single channel memory mode) even being compared to the 32GB NUC? That is really a big configuration difference. Or is the table wrong it was 2 4GB sticks?ganeshts - Thursday, December 20, 2018 - link
We reviewed the configuration that was sampled to us by ECS. I complained to them about the single-channel configuration holding back performance a bit, but they didn't care :)As I mentioned in another comment, the 32GB was just to show everyone that the NUC could support it even though it is unofficial.
To be honest, the *amount* of RAM has very little impact on most of the benchmark numbers. Yes, I do agree single vs. dual slot fill up makes a bit of a difference.