The AMD Threadripper 2 CPU Review: The 24-Core 2970WX and 12-Core 2920X Tested
by Ian Cutress on October 29, 2018 9:00 AM ESTHEDT Performance: System Tests
Our System Test section focuses significantly on real-world testing, user experience, with a slight nod to throughput. In this section we cover application loading time, image processing, simple scientific physics, emulation, neural simulation, optimized compute, and 3D model development, with a combination of readily available and custom software. For some of these tests, the bigger suites such as PCMark do cover them (we publish those values in our office section), although multiple perspectives is always beneficial. In all our tests we will explain in-depth what is being tested, and how we are testing.
All of our benchmark results can also be found in our benchmark engine, Bench.
Application Load: GIMP 2.10.4
One of the most important aspects about user experience and workflow is how fast does a system respond. A good test of this is to see how long it takes for an application to load. Most applications these days, when on an SSD, load fairly instantly, however some office tools require asset pre-loading before being available. Most operating systems employ caching as well, so when certain software is loaded repeatedly (web browser, office tools), then can be initialized much quicker.
In our last suite, we tested how long it took to load a large PDF in Adobe Acrobat. Unfortunately this test was a nightmare to program for, and didn’t transfer over to Win10 RS3 easily. In the meantime we discovered an application that can automate this test, and we put it up against GIMP, a popular free open-source online photo editing tool, and the major alternative to Adobe Photoshop. We set it to load a large 50MB design template, and perform the load 10 times with 10 seconds in-between each. Due to caching, the first 3-5 results are often slower than the rest, and time to cache can be inconsistent, we take the average of the last five results to show CPU processing on cached loading.
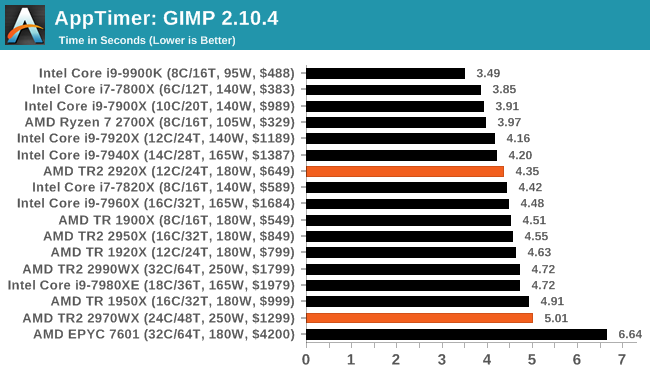
Loading applications largely goes by single threaded frequency and system memory, hence why the 9900K wins and the EPYC comes bottom. The 2920X gets a jump on the 2950X here by 0.2 seconds.
FCAT: Image Processing
The FCAT software was developed to help detect microstuttering, dropped frames, and run frames in graphics benchmarks when two accelerators were paired together to render a scene. Due to game engines and graphics drivers, not all GPU combinations performed ideally, which led to this software fixing colors to each rendered frame and dynamic raw recording of the data using a video capture device.
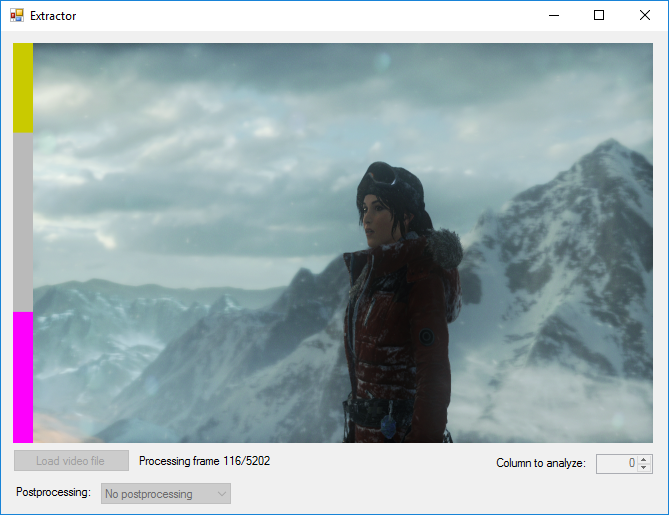
The FCAT software takes that recorded video, which in our case is 90 seconds of a 1440p run of Rise of the Tomb Raider, and processes that color data into frame time data so the system can plot an ‘observed’ frame rate, and correlate that to the power consumption of the accelerators. This test, by virtue of how quickly it was put together, is single threaded. We run the process and report the time to completion.
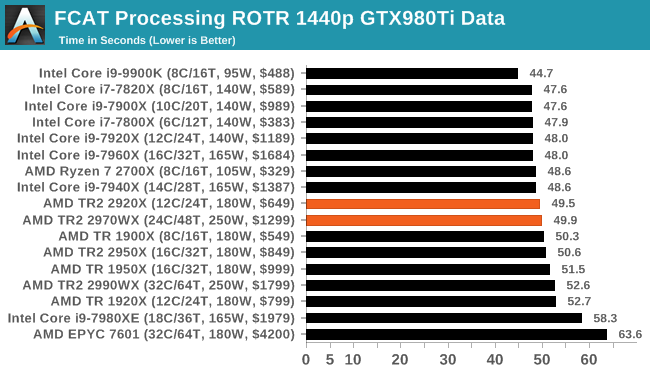
Most HEDT processors can do our single-threaded FCAT test at the same time, although the 7980XE takes a hit. The 9900K goes ahead due to 5.0 GHz. Our new AMD processors are midfield.
3D Particle Movement v2.1: Brownian Motion
Our 3DPM test is a custom built benchmark designed to simulate six different particle movement algorithms of points in a 3D space. The algorithms were developed as part of my PhD., and while ultimately perform best on a GPU, provide a good idea on how instruction streams are interpreted by different microarchitectures.
A key part of the algorithms is the random number generation – we use relatively fast generation which ends up implementing dependency chains in the code. The upgrade over the naïve first version of this code solved for false sharing in the caches, a major bottleneck. We are also looking at AVX2 and AVX512 versions of this benchmark for future reviews.
For this test, we run a stock particle set over the six algorithms for 20 seconds apiece, with 10 second pauses, and report the total rate of particle movement, in millions of operations (movements) per second. We have a non-AVX version and an AVX version, with the latter implementing AVX512 and AVX2 where possible.
3DPM v2.1 can be downloaded from our server: 3DPMv2.1.rar (13.0 MB)
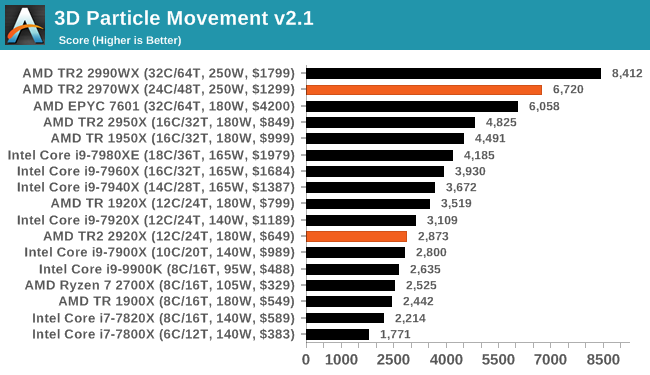
With a standard non-AVX version, having all the cores helps, and we see even the 16-core TR 1950X beating the 7980XE. Both of the new chips fall just behind their bigger brothers.
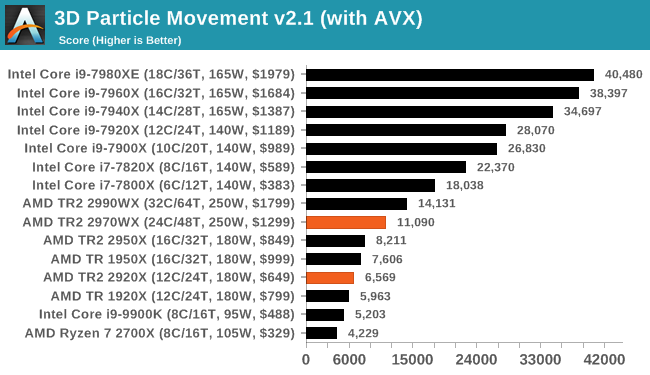
If we add in AVX2/AVX512, the AMD chips double in performance, but there's nothing stopping the AVX-512 enabled Skylake-X chips.
Dolphin 5.0: Console Emulation
One of the popular requested tests in our suite is to do with console emulation. Being able to pick up a game from an older system and run it as expected depends on the overhead of the emulator: it takes a significantly more powerful x86 system to be able to accurately emulate an older non-x86 console, especially if code for that console was made to abuse certain physical bugs in the hardware.
For our test, we use the popular Dolphin emulation software, and run a compute project through it to determine how close to a standard console system our processors can emulate. In this test, a Nintendo Wii would take around 1050 seconds.
The latest version of Dolphin can be downloaded from https://dolphin-emu.org/
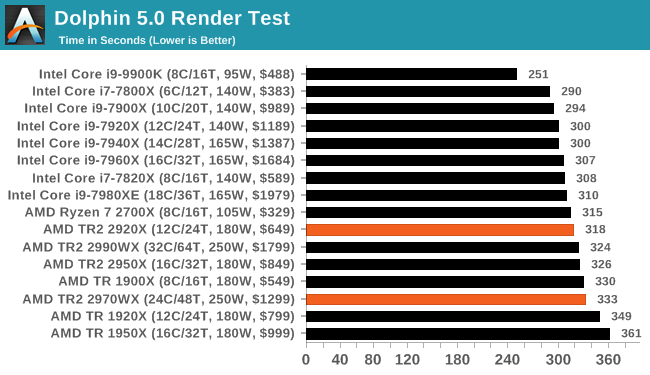
Dolphin is another single threaded benchmark, which likes IPC, hence why the 9900K wins easily and the new chips are around where we expect.
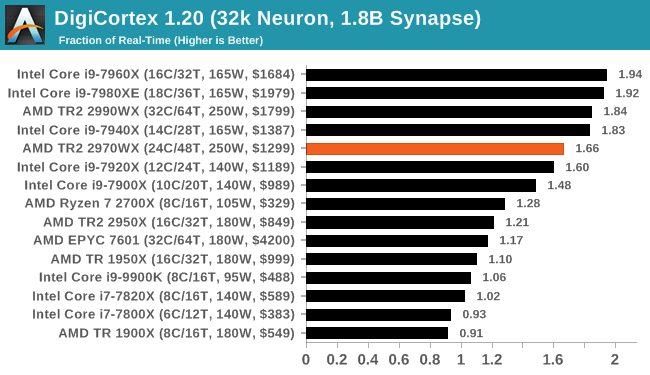
DigiCortex 1.20: Sea Slug Brain Simulation
This benchmark was originally designed for simulation and visualization of neuron and synapse activity, as is commonly found in the brain. The software comes with a variety of benchmark modes, and we take the small benchmark which runs a 32k neuron / 1.8B synapse simulation, equivalent to a Sea Slug.

Example of a 2.1B neuron simulation
We report the results as the ability to simulate the data as a fraction of real-time, so anything above a ‘one’ is suitable for real-time work. Out of the two modes, a ‘non-firing’ mode which is DRAM heavy and a ‘firing’ mode which has CPU work, we choose the latter. Despite this, the benchmark is still affected by DRAM speed a fair amount.
DigiCortex can be downloaded from http://www.digicortex.net/
y-Cruncher v0.7.6: Microarchitecture Optimized Compute
I’ve known about y-Cruncher for a while, as a tool to help compute various mathematical constants, but it wasn’t until I began talking with its developer, Alex Yee, a researcher from NWU and now software optimization developer, that I realized that he has optimized the software like crazy to get the best performance. Naturally, any simulation that can take 20+ days can benefit from a 1% performance increase! Alex started y-cruncher as a high-school project, but it is now at a state where Alex is keeping it up to date to take advantage of the latest instruction sets before they are even made available in hardware.
For our test we run y-cruncher v0.7.6 through all the different optimized variants of the binary, single threaded and multi-threaded, including the AVX-512 optimized binaries. The test is to calculate 250m digits of Pi, and we use the single threaded and multi-threaded versions of this test.
Users can download y-cruncher from Alex’s website: http://www.numberworld.org/y-cruncher/
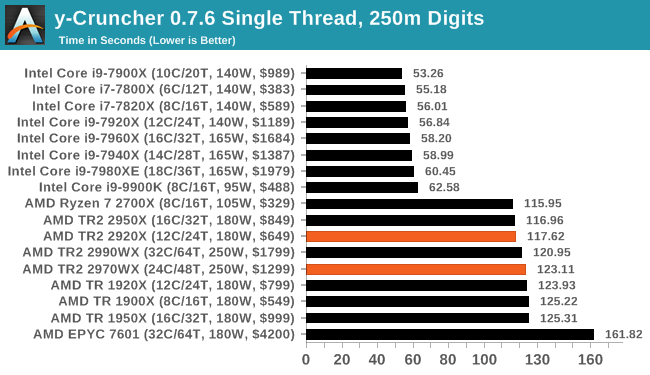
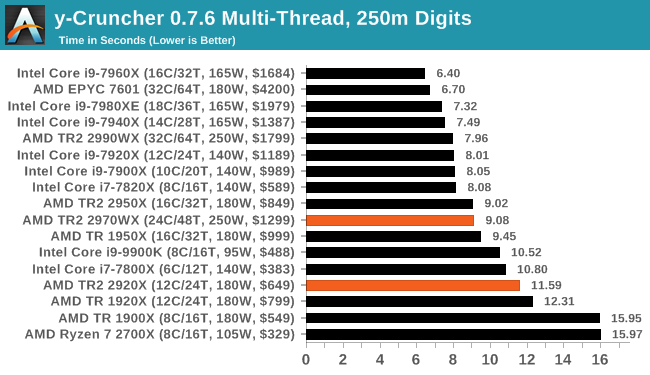
y-cruncher uses tuned binaries for AVX512 and AVX2, so in the single thread comparison all of the Skylake-X chips hit the top spots. In the multi-threaded scenario however, the increased memory requirements means that the EPYC gets in on the mix, but the reduced memory bandwidth of the new AMD parts puts them futher behind.
Agisoft Photoscan 1.3.3: 2D Image to 3D Model Conversion
One of the ISVs that we have worked with for a number of years is Agisoft, who develop software called PhotoScan that transforms a number of 2D images into a 3D model. This is an important tool in model development and archiving, and relies on a number of single threaded and multi-threaded algorithms to go from one side of the computation to the other.
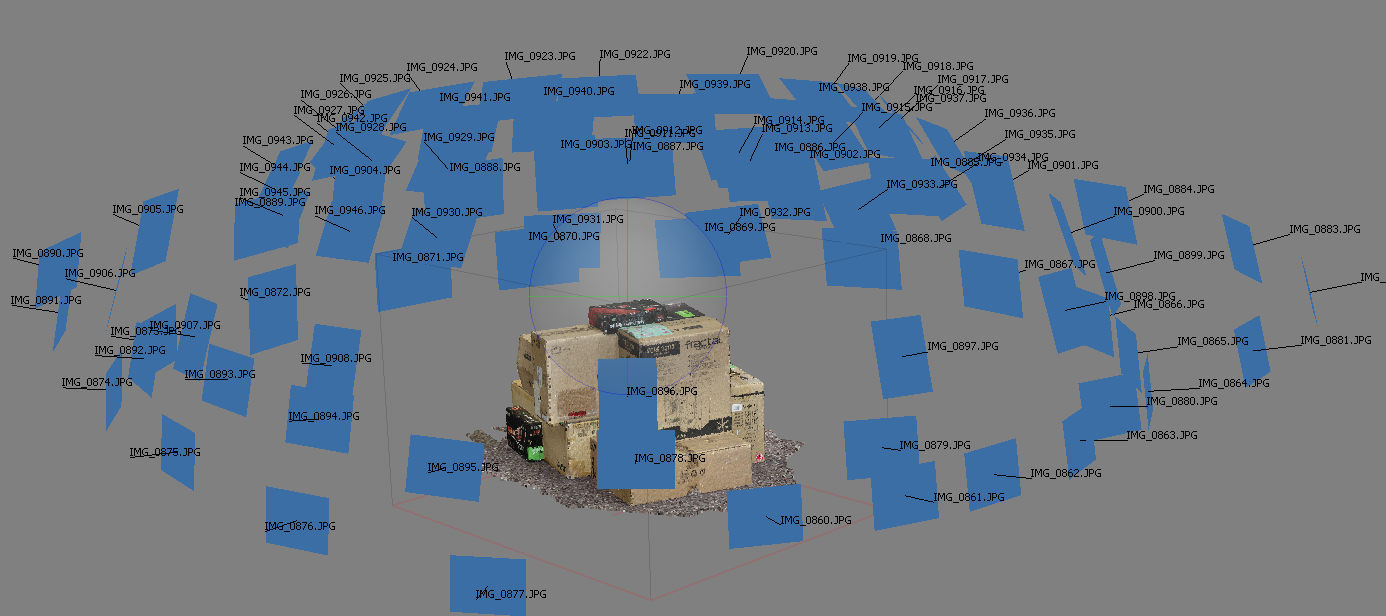
In our test, we take v1.3.3 of the software with a good sized data set of 84 x 18 megapixel photos and push it through a reasonably fast variant of the algorithms, but is still more stringent than our 2017 test. We report the total time to complete the process.
Agisoft’s Photoscan website can be found here: http://www.agisoft.com/
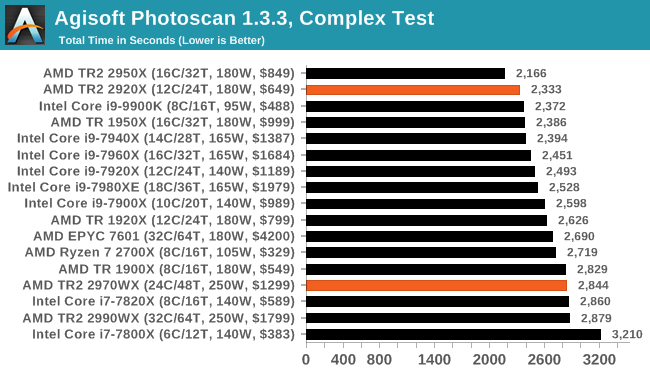
Photoscan doesn't seem to scale that well beyond 16 cores, and the 2920X takes the second spot here. The 2970WX is barely faster than the 2990WX, due to the variable threaded nature of the benchmark.


69 Comments
View All Comments
euler007 - Tuesday, October 30, 2018 - link
For gaming a 8600k will beat the 2700x and is priced 16% less than a 2700x (just checked newegg prices).Stuka87 - Monday, October 29, 2018 - link
Hey guys, just a quick correction, World of Tanks has been using the Encore engine for six months now. So its not an unreleased engine. But it is a great engine, incredible performance for the graphics that it offers.Great article otherwise.
br83taylor - Monday, October 29, 2018 - link
Can you clarify if your benchmarks are with PBO enabled or disabled?hoohoo - Monday, October 29, 2018 - link
Civ 6 - the slowest paced strategy game ever, now rendered at high frame rates!hansmuff - Monday, October 29, 2018 - link
Just my personal wish list:Can you make 1080p the new 720p, drop 720p altogether, but add in1440p? I feel that's a pretty common resolution these days, and affordable high-frequency screens with FreeSync and G-SYNC are available. I think it would mean more to people than the mostly artificial 720p.
nevcairiel - Monday, October 29, 2018 - link
720p may not have many real-world usecases anymore, however it does clearly show CPU performance scaling in games while removing most GPU bottlenecks entirely. Its definitely an interesting metric on that alone.mapesdhs - Monday, October 29, 2018 - link
People argue this one a lot; some will say 720p is so unrealistic that what's the point? It shows differences at a resolution that virtually nobody uses, so who cares? Anyone buying this class of hw is far more likely to be gaming at least at 1080p and more likely 1440p or higher. Others say by using a low resolution it allows the test to be used as a psuedo CPU test, but it's hard to escape the criticism that such testing is still not real-world in any useful sense. Interesting from a technical perspective perhaps, but not *useful* when it comes to making a purchasing decision.GreenReaper - Wednesday, October 31, 2018 - link
It helps if you plan to keep the CPU around for when you buy your next video card, which might *then* be CPU-limited when running 1440p. You're basically finding what happens when the CPU is the bottleneck, which it might be in the future. For example, people who upgraded i7-3770K systems with modern video cards. AMD chips of that era (e.g. FX-8370) haven't held up so well.At the same time, if you plan to hand down the system to someone else and get a new one in three year's time, or repurpose it as a home server, the future potential may not matter to you at all.
SLVR - Monday, October 29, 2018 - link
Why no 9900K power consumption figures?mapesdhs - Monday, October 29, 2018 - link
The IR radiation off the chip melted the power meter. ;)