The Crucial P1 1TB SSD Review: The Other Consumer QLC SSD
by Billy Tallis on November 8, 2018 9:00 AM ESTSequential Read Performance
Our first test of sequential read performance uses short bursts of 128MB, issued as 128kB operations with no queuing. The test averages performance across eight bursts for a total of 1GB of data transferred from a drive containing 16GB of data. Between each burst the drive is given enough idle time to keep the overall duty cycle at 20%.
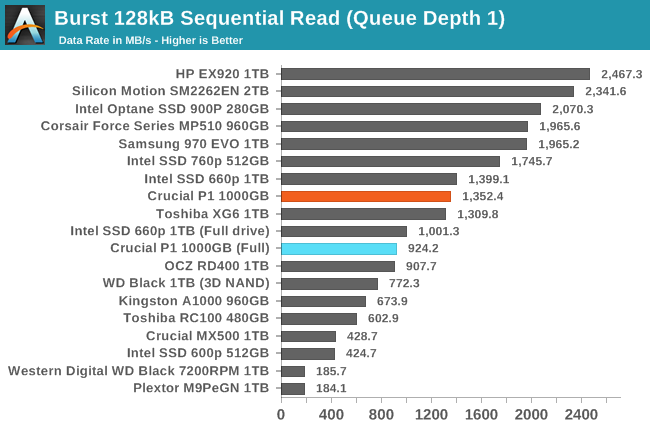
The burst sequential read performance of the Crucial P1 is decent for an entry-level NVMe SSD. Even when the test is run on a full drive, the P1 is about twice as fast as a SATA SSD. The Intel 660p is slightly faster on this test, with more of an advantage in the full-drive/small SLC cache conditions.
Our test of sustained sequential reads uses queue depths from 1 to 32, with the performance and power scores computed as the average of QD1, QD2 and QD4. Each queue depth is tested for up to one minute or 32GB transferred, from a drive containing 64GB of data. This test is run twice: once with the drive prepared by sequentially writing the test data, and again after the random write test has mixed things up, causing fragmentation inside the SSD that isn't visible to the OS. These two scores represent the two extremes of how the drive would perform under real-world usage, where wear leveling and modifications to some existing data will create some internal fragmentation that degrades performance, but usually not to the extent shown here.
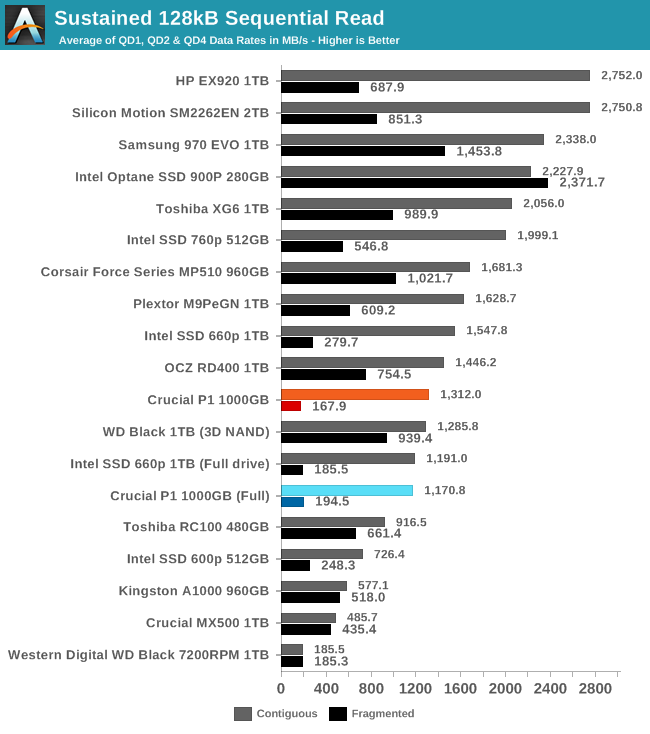
On the longer sequential read test, the Crucial P1 sustains sequential reads at over 1GB/s even when full, so long as the data is contiguous on the flash itself due to having been written sequentially. When reading data that has been modified heavily by random writes, the drive has to do random reads behind the scenes and its performance is no longer competitive with other current NVMe SSDs or even mainstream SATA SSDs, though it does at least maintain roughly the same level of performance that can be expected from a hard drive (which doesn't need wear leveling and thus is not subject to internal fragmentation). As with the burst sequential read test, the Intel 660p is slightly faster.
 |
|||||||||
| Power Efficiency in MB/s/W | Average Power in W | ||||||||
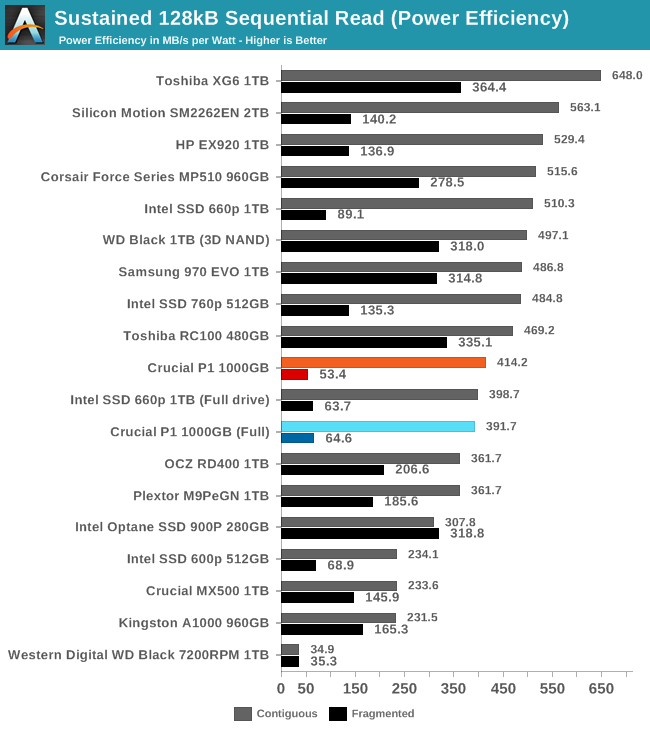
The power efficiency of the Crucial P1 when reading contiguous data is reasonable for a NVMe drive but nothing special. When reading data with internal fragmentation, the power consumption is the same but the reduced performance drags the efficiency way down, to only 50% better than a 3.5" hard drive.
 |
|||||||||
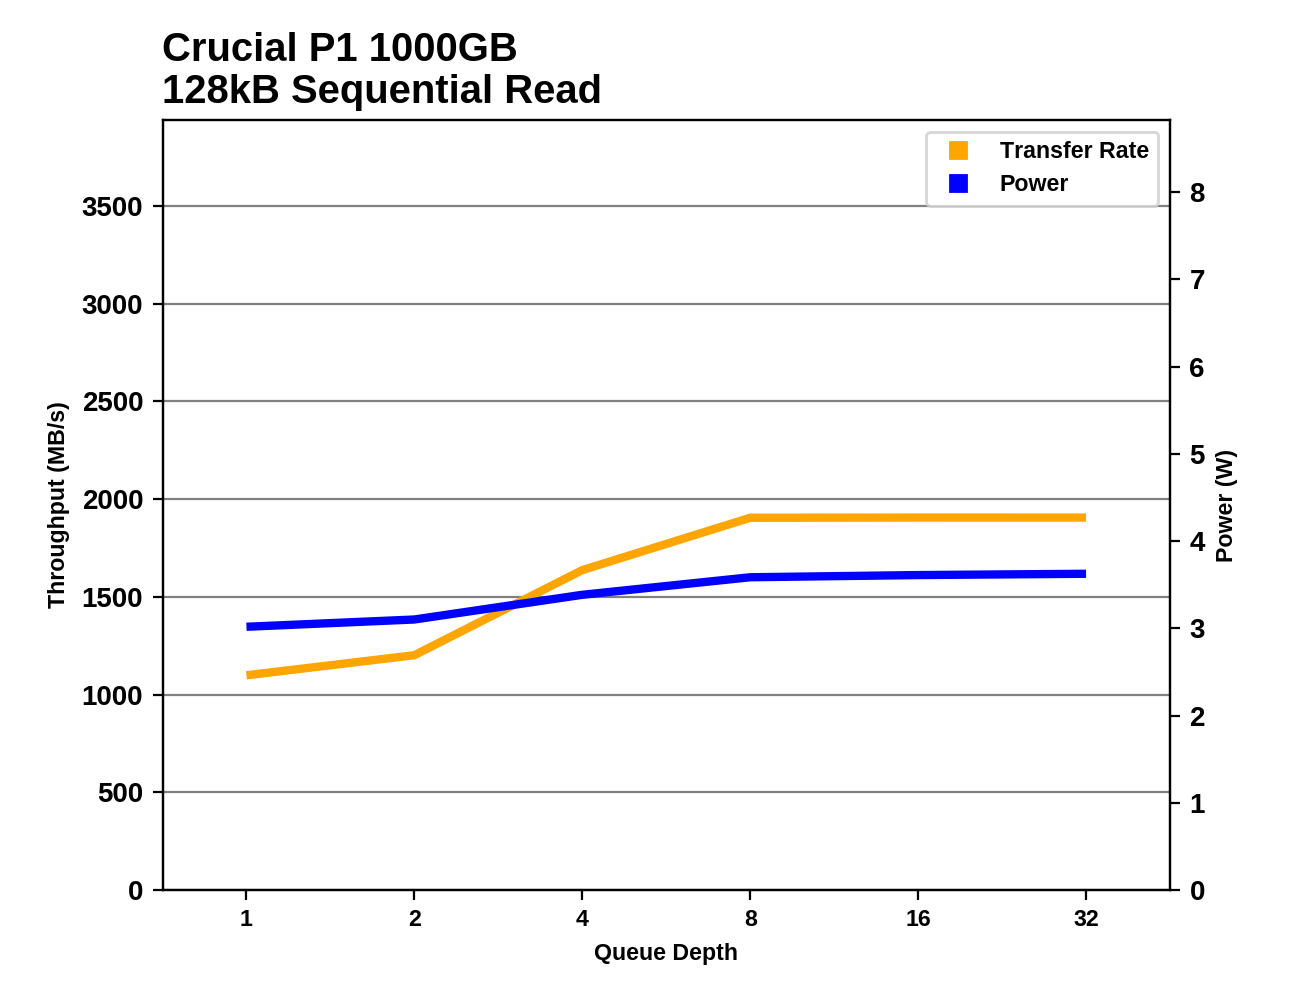
The Crucial P1 reaches full sequential read speed of just under 2GB/s at QD8 or higher. While the Intel 660p has the advantage at low queue depths, the P1 ends up slightly faster at higher queue depths.
Looking at which part of the performance and power landscape the Crucial P1 occupies compared to all the other drives that have been subjected to our 2018 SSD tests, the P1 is very middle-of-the-road among NVMe drives for both performance and power consumption. There are drives with similar read performance profiles that require nearly 1W less, and high-performance drives that can deliver more than 1GB/s faster speeds than the P1 without using much more power than the P1 at its peak.
Sequential Write Performance
Our test of sequential write burst performance is structured identically to the sequential read burst performance test save for the direction of the data transfer. Each burst writes 128MB as 128kB operations issued at QD1, for a total of 1GB of data written to a drive containing 16GB of data.
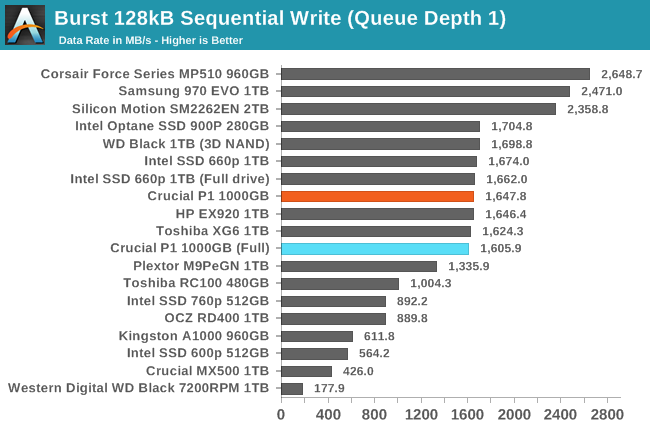
On the burst sequential write test, the Crucial P1 is on par with many high-end NVMe SSDs, thanks to the high write performance of its SLC cache. This test is short enough that the P1 doesn't overflow the SLC cache even when it is at its minimum size due to the drive being full.
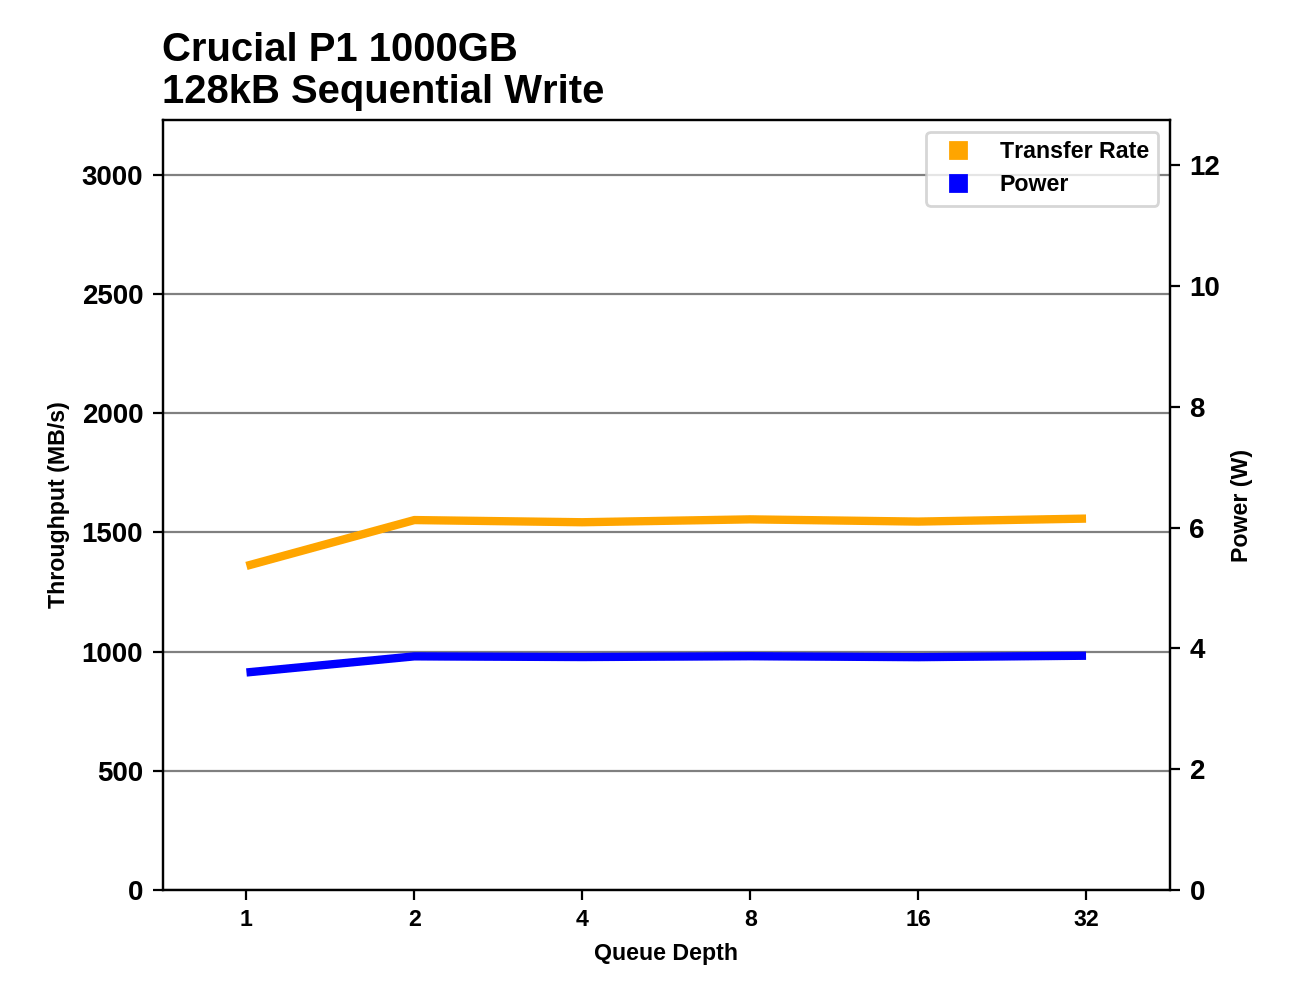
Our test of sustained sequential writes is structured identically to our sustained sequential read test, save for the direction of the data transfers. Queue depths range from 1 to 32 and each queue depth is tested for up to one minute or 32GB, followed by up to one minute of idle time for the drive to cool off and perform garbage collection. The test is confined to a 64GB span of the drive.
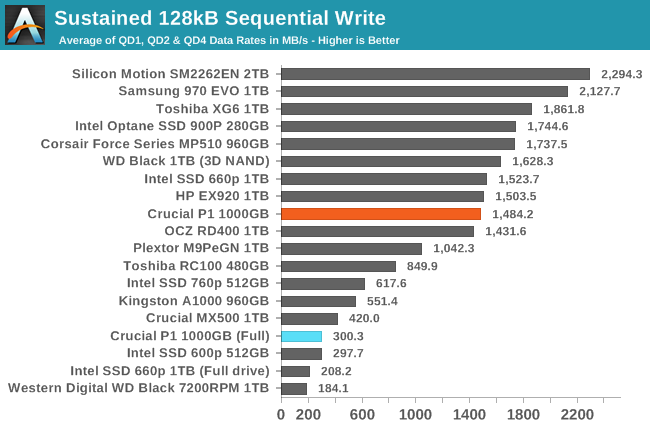
On the longer sequential write test, the Crucial P1 continues to perform well when the drive is mostly empty and the SLC cache is at its largest. When the drive is full, this test writes enough to overflow the cache and performance drops below that of mainstream SATA SSDs.
 |
|||||||||
| Power Efficiency in MB/s/W | Average Power in W | ||||||||
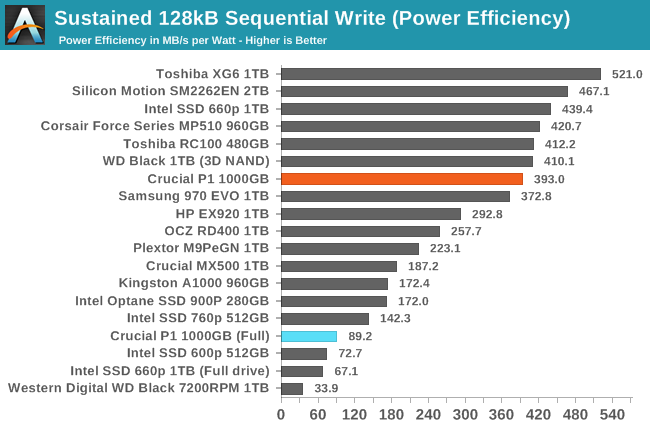
Power consumption by the Crucial P1 during the sustained sequential write test is lower than average for NVMe SSDs, so the efficiency is good when the test hits only the SLC cache. When the drive is full and the SLC cache overflows, the P1's efficiency is significantly worse than almost all of the competition, though the performance per Watt is still several times what a hard drive can manage.
 |
|||||||||
The Crucial P1 hits its full write speed at a queue depth of 2 or higher, when writing to the SLC cache. When the drive is full, the SLC cache overflows before the QD1 test phase is over, and performance bounces around a bit but stays generally quite low with each phase of the test. The Intel 660p is slightly faster when writing to its SLC cache, and performs more consistently when the cache is constantly overflowing.
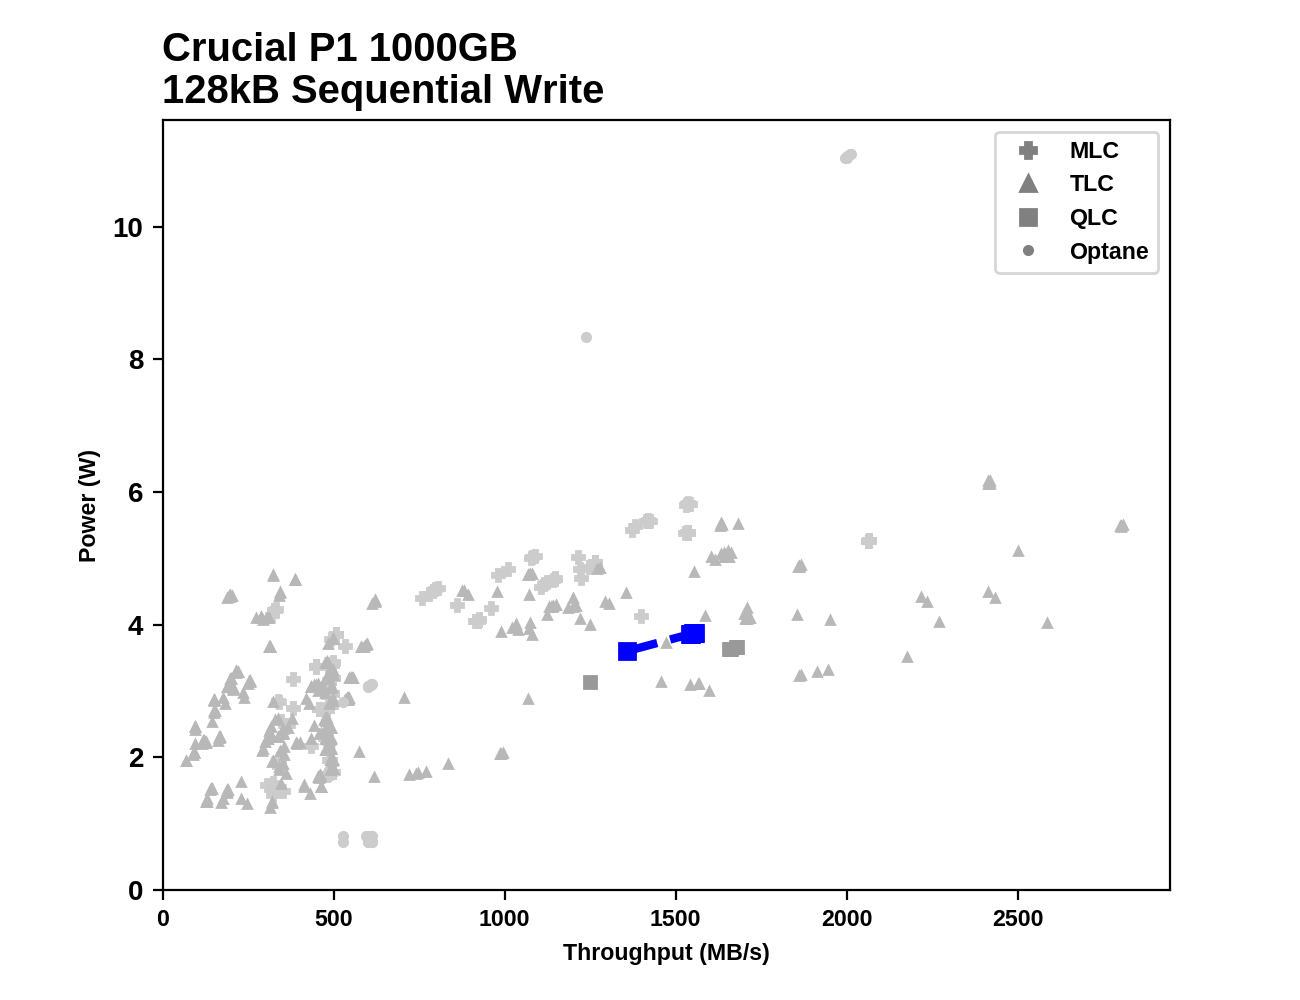
Compared against all the other drives that have completed our 2018 SSD test suite, the sequential write performance and power consumption of the Crucial P1 are better than most other low-end NVMe drives (or drives that would be considered low-end if they were still on the market). But there are numerous high-end drives that vastly outperform the P1, and some of them use a bit less power in doing so.
Whole-Drive Fill
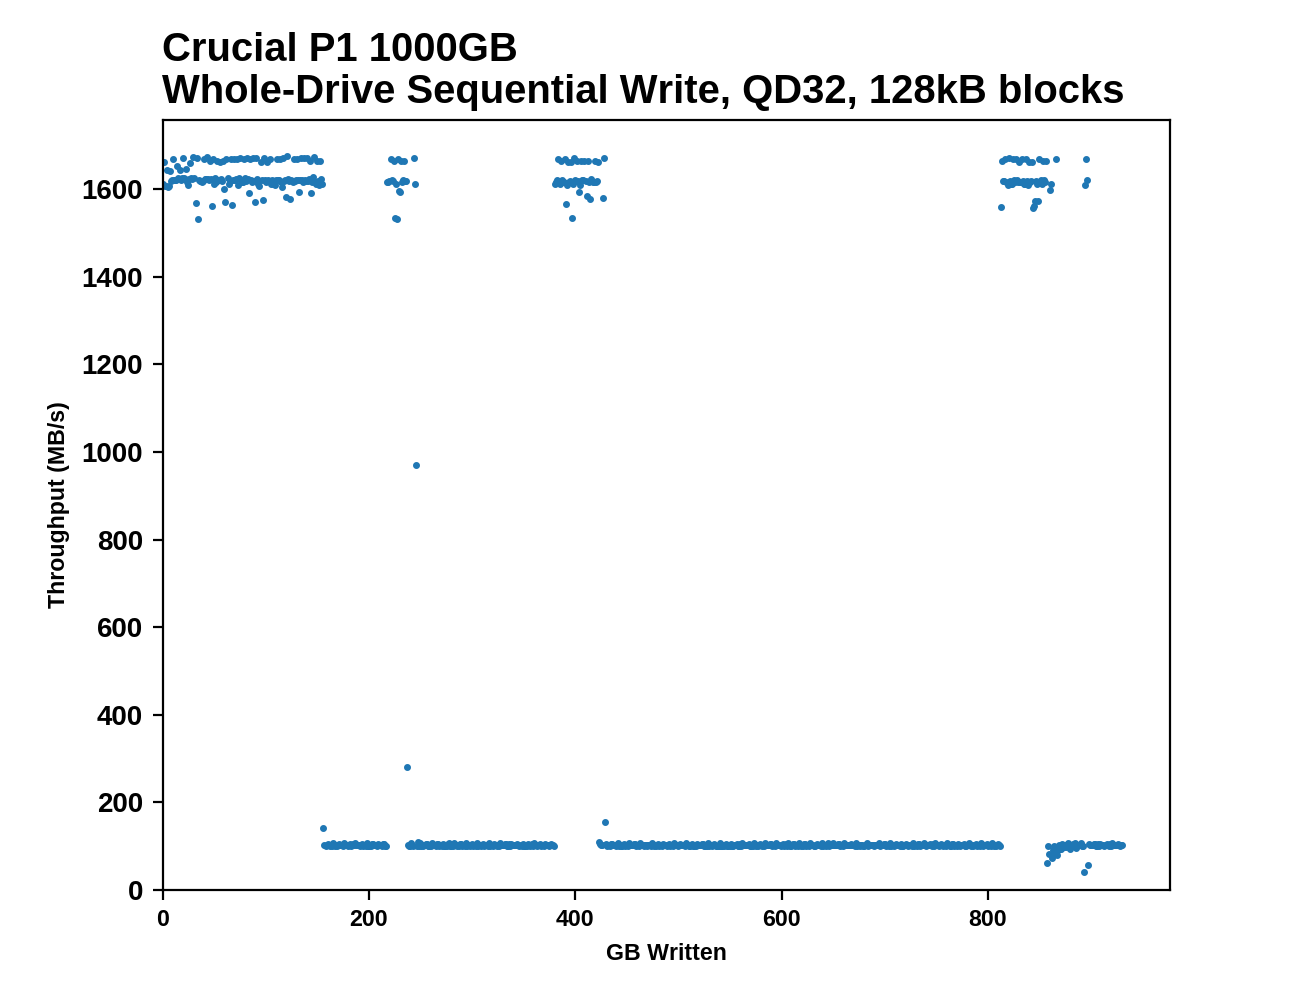
This test starts with a freshly-erased drive and fills it with 128kB sequential writes at queue depth 32, recording the write speed for each 1GB segment. This test is not representative of any ordinary client/consumer usage pattern, but it does allow us to observe transitions in the drive's behavior as it fills up. From this, we can estimate the size of any SLC write cache, and get a sense for how much performance remains on the rare occasions where real-world usage keeps writing data after filling the cache.
 |
|||||||||
The 1TB Crucial P1 manages about 155 GB of sequential writes before the SLC cache overflows and performance tanks. The drive does manage to free up some SLC cache on several occasions before the drive is completely full, so the write speed occasionally jumps back up. The Intel 660p only lasts for about 128 GB before its cache runs out, and while it does show some variability in write speed during the rest of the drive fill, it never gets all the way back up to the full SLC write speed.
 |
|||||||||
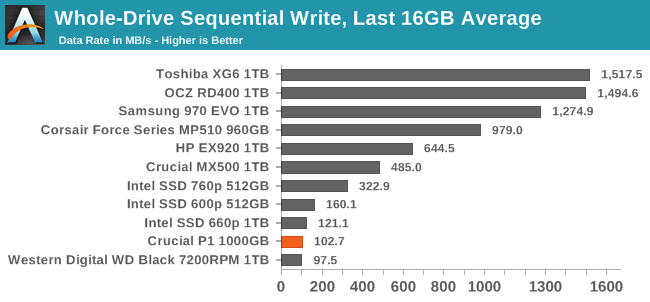
| Average Throughput for last 16 GB | Overall Average Throughput | ||||||||
For extremely large sequential write operations that overflow the SLC cache, the Crucial P1 and Intel 660p average out to about the same speed as a 7200RPM hard drive. The fast writes to the SLC cache don't last long enough to bring the average up very far above the steady-state write speeds of about 100MB/s. High-end NVMe SSDs with modern 3D TLC NAND and 8-channel controllers can sustain write speeds that are about an order of magnitude higher after the SLC caches run out.


66 Comments
View All Comments
DigitalFreak - Thursday, November 8, 2018 - link
At this rate, by the time they get to H(ex)LC you'll only be able to write 1GB per day to your drive or risk having it fail.PeachNCream - Thursday, November 8, 2018 - link
Please don't give them any ideas! The last thing we need is NAND that generously handles a few dozen P/E cycles before dying. We've already gone from millions of P/E cycles to a few hundred in the last 15 years and data retention has dropped from over a decade to under six months. Sure you can get a lot more capacity for the price, but NAND needs to be replaced with something more durable sooner rather than later. (And no, I'm not advocating for Optane either, just something that lasts longer and has room for density improvements - don't care what that something is.)MrCommunistGen - Thursday, November 8, 2018 - link
I was expecting the extra DRAM to provide a more meaningful advantage over the Intel 660p... I guess it makes sense that Intel left it off to save on BOM.Ratman6161 - Thursday, November 8, 2018 - link
This could be a very good standard desktop drive if 1) the price is right and 2) you can accept that the 1 TB drive is really only good for up to 900 GB. You would just partition the drive such that there is 100 GB free (or make sure you always just keep that much space free) so you always have the maximum SLC cach available. For the price to be right, it has to be lower. Taking the prices from the article, the 1 TB P1 is only $8 cheaper than a 970 EVO. Now if they could get the price down to the same territory as the current MX 500 they might have something.Billy Tallis - Thursday, November 8, 2018 - link
Leaving 10% of the drive unpartitioned won't be enough to get the maximum size SLC cache, because 1GB of SLC cache requires 4GB of QLC to be used as SLC. However, 10% manual overprovisioning would definitely reduce the already small chances of overflowing the SLC cache.mczak - Thursday, November 8, 2018 - link
On that note, wouldn't it actually make sense to use a MLC cache instead of a SLC cache for these SSDs using QLC flash (and by MLC of course I mean using 2 bits per cell)? I'd assume you should still be able to get very decent write speeds with that, and it would effectively only need half as much flash for the same cache size.Billy Tallis - Thursday, November 8, 2018 - link
Cache size isn't really a big enough problem for a 2bpc MLC write cache to be worthwhile. Using SLC for the write cache has several advantages: highest performance/lowest latency, single-pass reads and writes (important for Crucial's power loss immunity features), and your SLC cache can use flash blocks that are too worn out to still reliably store multiple bits per cell. A slower write cache with twice the capacity would only make sense if consumer workloads regularly overflowed the existing write cache. Almost all of the instances where our benchmarks overflow SLC caches are a consequence of our tests giving the drive less idle time than real-world usage, rather than being tests representing use cases where the cache would be expected to overflow even in the real world.idri - Thursday, November 8, 2018 - link
Why don't you guys include the Samsung 970 PRO 1TB in your charts for comparison? It's one of the most sought after SSDs on the market for HEDT systems and for sure it would be useful to have your tests results for this one too. Thanks.Billy Tallis - Thursday, November 8, 2018 - link
A.) Samsung didn't send me a 970 PRO. B.) The 970 PRO is pretty far outside the range of what could be considered competition for an entry-level NVMe SSD. It's a drive you buy for bragging rights, not for real-world performance benefits. The Optane SSD is in that same category, and I don't think the graphs for this kind of review need to be cluttered up with too many of those.PeachNCream - Thursday, November 8, 2018 - link
Not to be obtuse, but by price the 970 PRO is well within the range of competition for the P1 given that the 1TB 970 retails for $228 on Amazon right now and the MSRP for the 1TB P1 $220. Buyers looking for a product will most certainly consider the $8 difference and factor that into their decision to move up from an entry-level product to a "bragging rights" option given the insignificant difference in cost. Your first point is valid. I would have stopped there since its reasonable to say, "Physically impossible, don't have one there pal."