The Crucial P1 1TB SSD Review: The Other Consumer QLC SSD
by Billy Tallis on November 8, 2018 9:00 AM ESTMixed Random Performance
Our test of mixed random reads and writes covers mixes varying from pure reads to pure writes at 10% increments. Each mix is tested for up to 1 minute or 32GB of data transferred. The test is conducted with a queue depth of 4, and is limited to a 64GB span of the drive. In between each mix, the drive is given idle time of up to one minute so that the overall duty cycle is 50%.
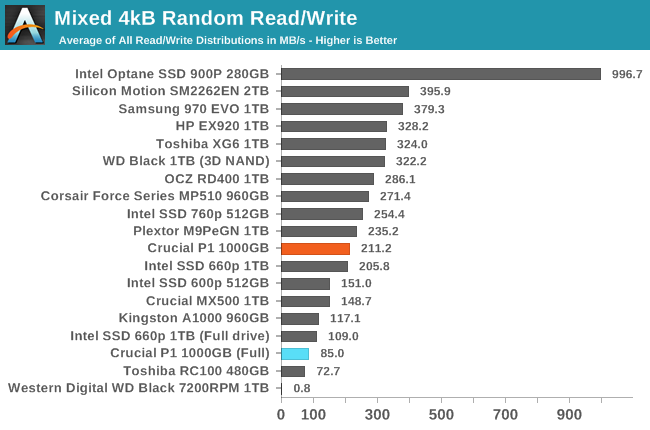
The Crucial P1 has reasonable entry-level NVMe performance on the mixed random I/O test. It's clearly faster than the MX500 SATA SSD and comes close to some high-end NVMe SSDs. But when the drive is full and the SLC cache is at its minimum size, the P1 slows down to 40% of its speed on a drive containing only the test data. When full, the P1 is about 22% slower than the Intel 660p, but their empty-drive performance is similar.
 |
|||||||||
| Power Efficiency in MB/s/W | Average Power in W | ||||||||
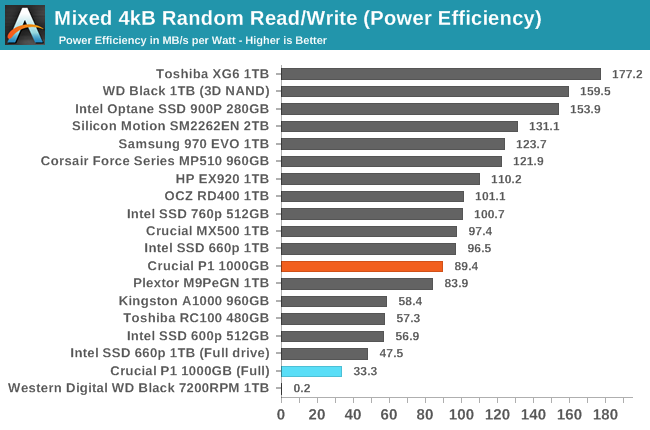
The Crucial P1 has worse power efficiency than the Intel 660p on this test, whether it is run on a full drive or not. The efficiency is still reasonable for the mostly-empty drive test run, but when full the P1's power consumption increases slightly and the efficiency is significantly worse than other low-end NVMe SSDs.
 |
|||||||||
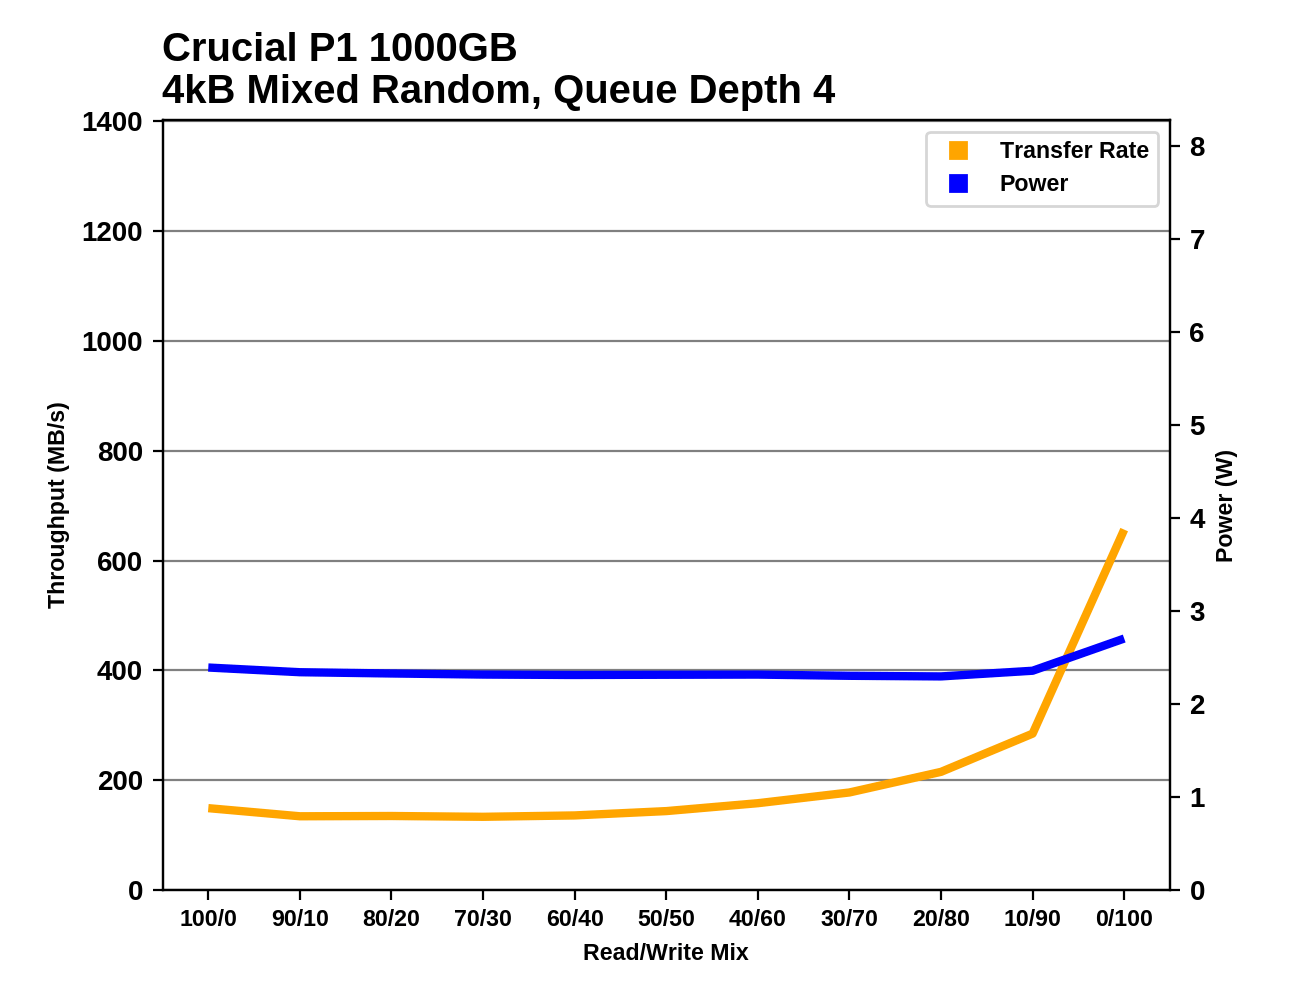
When the mixed random I/O test is run on a full Crucial P1, the benefits of the SLC cache almost completely disappear, leaving the drive with a mostly flat performance curve (with some inconsistency) rather than the significant performance upswing as the proportion of writes grows beyond 70%. The Intel 660p's performance is very similar save for slightly lower write performance to the SLC cache, and slightly improved full-drive performance.
Mixed Sequential Performance
Our test of mixed sequential reads and writes differs from the mixed random I/O test by performing 128kB sequential accesses rather than 4kB accesses at random locations, and the sequential test is conducted at queue depth 1. The range of mixes tested is the same, and the timing and limits on data transfers are also the same as above.
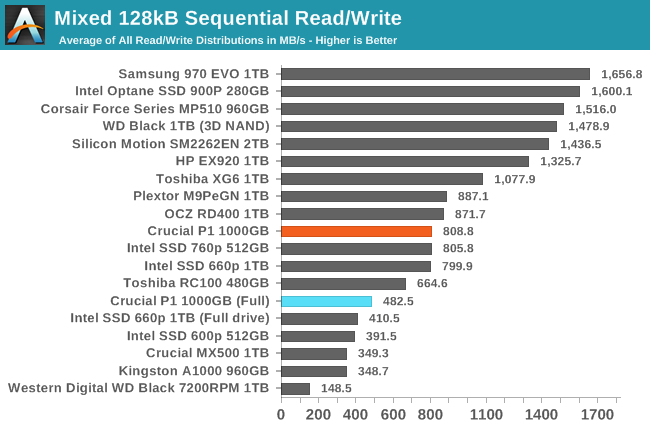
The performance of the Crucial P1 on the mixed sequential I/O test is better than most entry-level NVMe SSDs and comes close to some of the slower high-end drives. Even when the test is run on a full drive, the P1 remains faster than SATA SSDs, and its full-drive performance is slightly better than the Intel 660p.
 |
|||||||||
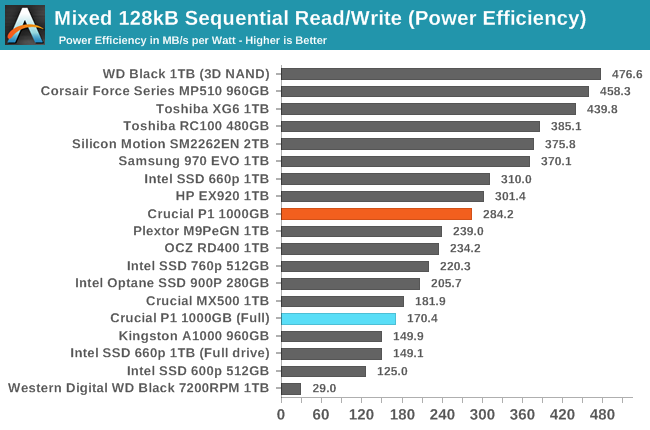
| Power Efficiency in MB/s/W | Average Power in W | ||||||||
The power efficiency of the Crucial P1 on this test is about average for an entry-level NVMe drive. When the test is run on a full drive, the reduced performance causes efficiency to take a big hit, but it ends up being only slightly less efficient than the Crucial MX500 SATA SSD.
 |
|||||||||
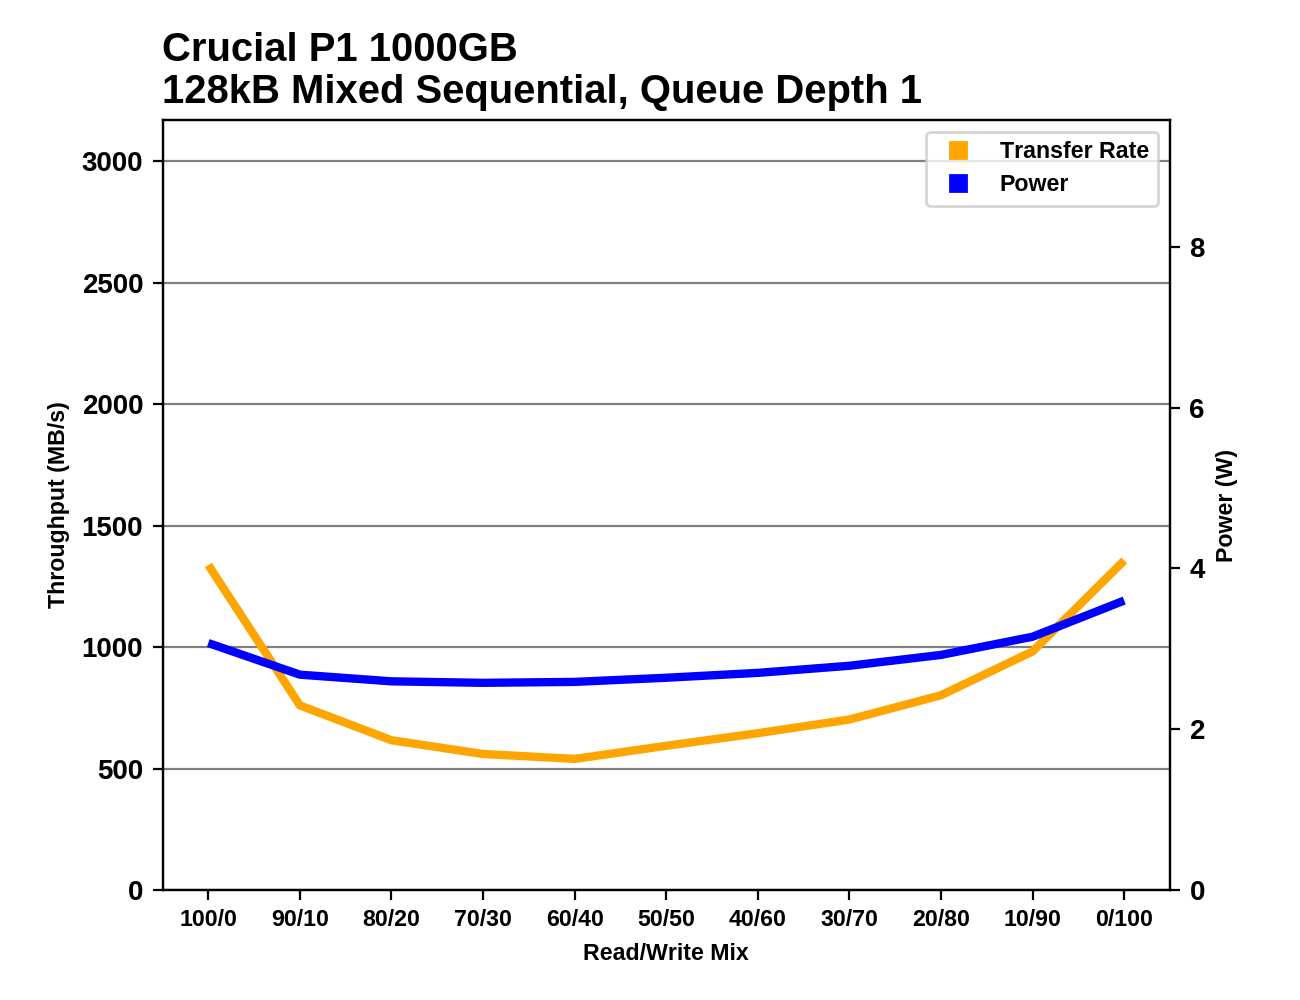
The Crucial P1 has decent performance at either end of the test, when the workload is either very read-heavy or very write-heavy. Compared to other entry-level NVMe drives, the P1 starts out with better read performance and recovers more of its performance toward the end of the test than many of its competitors. The minimum reached at around a 60/40 read/write split is faster than a SATA drive can manage but is unremarkable among NVMe drives. When the test is run on a full drive, performance during the more read-heavy half of the test is only slightly reduced, but things get worse throughout the write-heavy half of the test instead of improving as write caching comes more into play.


66 Comments
View All Comments
Mikewind Dale - Thursday, November 8, 2018 - link
Sic:"A reduction in quantity and an increase in price will increase net revenue only if demand is elastic."
That should be "inelastic."
limitedaccess - Thursday, November 8, 2018 - link
The transition to TLC drives was also shortly followed with the transition to 3D NAND using higher process (larger) from smaller planar litho process. While smaller litho allowed more density it also came with the trade off of worse endurance/higher decay. So the transition to 3D NAND effectively offset the issues of MLC->TLC which is where we are today. What's the equivalent for TLC->QLC?Low litho planar TLC drives were the ones that were poorly received and performed worse then they reviewed in reality due to decay. And decay is the real issue here with QLC since no reviewer tests for it (it isn't the same as poor write endurance). Is that file I don't regularly access going to maintain the same read speeds or have massively higher latency to access due to the need for ECC to kick in?
0ldman79 - Monday, November 12, 2018 - link
I may not be correct on the exact numbers, but I think the NAND lithography has stopped at 22nm as they were having issues retaining data on 14nm, just no real benefit going to a smaller lithography.They may tune that in a couple of years, but the only way I can see that working with my rudimentary understanding of the system is to keep everything the same size as the 22nm (gates, gaps, fences, chains, roads, whatever, it's too late/early for me to remember the correct terms), same gaps only on a smaller process. They'd have no reduction in cost as they'd be using the same amount of each wafer, might have a reduction in power consumption.
I'm eager to see how they address the problem but it really looks like QLC may be a dead end. Eventually we're going to hit walls where lithography can't improve and we're going to have to come at the problem (cpu speed, memory speeds, NAND speeds, etc) from an entirely different angle than what we've been doing. For what, 40 years, we've been doing major design changes every 5 years or so and just relying on lithography to improve clock speeds.
I think that is about to cease entirely. They can probably go farther than what we're seeing but not economically.
Lolimaster - Friday, November 9, 2018 - link
Youre not specting a drive limited to 500MB to be as fast as a PCI-E 4x SSD with full support for it...TLC vs MLC all goes to endurance and degraded performance when the drive is full or the cache is exhausted.
Lolimaster - Friday, November 9, 2018 - link
Random performance seems the land of Optane and similar. Even the 16GB optane M10 absoluletely murders even the top of the line NVME Samsung MLC SSD.PaoDeTech - Thursday, November 8, 2018 - link
Yes, price is still too high. But it will come down. I think that the conclusions fail to highlight the main strength of this SSD: top performance / power. For portable devices, this is the key metric to consider. In this regard is far ahead any SATA SSD and almost all PCIe out there.Lolimaster - Friday, November 9, 2018 - link
Exactly. QLC should stick to big multiterabyte drives for avrg user or HEDT.Like 4TB+.
0ldman79 - Monday, November 12, 2018 - link
I think that's where they need to place QLC.Massive "read mostly" storage. xx layer TLC for a performance drive, QLC for massive data storage, ie; all of my Steam games installed on a 10 cent per gig "read mostly" drive while the OS and my general use is on a 22 cent per gig TLC.
That's what they're trying to do with that SLC cache, but I think they need to push it a lot farther, throw a 500GB TLC cache on a 4 terabyte QLC drive. That might be able to have it fit into the mainstream NVME lineup.
Flunk - Thursday, November 8, 2018 - link
MSRP seems a little high, I recently picked up an HP EX920 1TB for $255 and that's a much faster drive. Perhaps the street price will be lower.B3an - Thursday, November 8, 2018 - link
That latency is APPALLING and the performance is below par. If this was dirt cheap it might be worth it to some people, but at that price it's a joke.