The Crucial P1 1TB SSD Review: The Other Consumer QLC SSD
by Billy Tallis on November 8, 2018 9:00 AM ESTSequential Read Performance
Our first test of sequential read performance uses short bursts of 128MB, issued as 128kB operations with no queuing. The test averages performance across eight bursts for a total of 1GB of data transferred from a drive containing 16GB of data. Between each burst the drive is given enough idle time to keep the overall duty cycle at 20%.
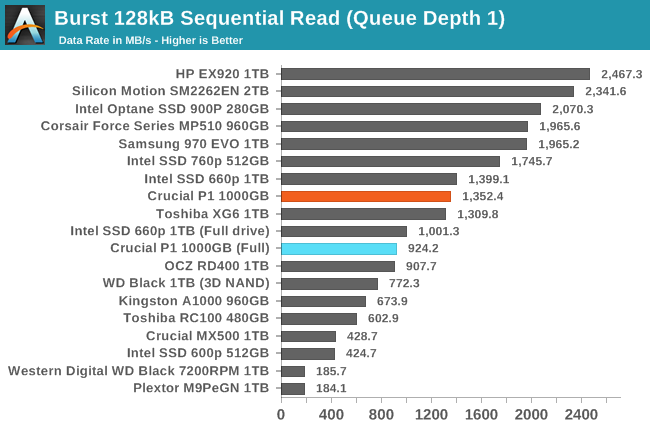
The burst sequential read performance of the Crucial P1 is decent for an entry-level NVMe SSD. Even when the test is run on a full drive, the P1 is about twice as fast as a SATA SSD. The Intel 660p is slightly faster on this test, with more of an advantage in the full-drive/small SLC cache conditions.
Our test of sustained sequential reads uses queue depths from 1 to 32, with the performance and power scores computed as the average of QD1, QD2 and QD4. Each queue depth is tested for up to one minute or 32GB transferred, from a drive containing 64GB of data. This test is run twice: once with the drive prepared by sequentially writing the test data, and again after the random write test has mixed things up, causing fragmentation inside the SSD that isn't visible to the OS. These two scores represent the two extremes of how the drive would perform under real-world usage, where wear leveling and modifications to some existing data will create some internal fragmentation that degrades performance, but usually not to the extent shown here.
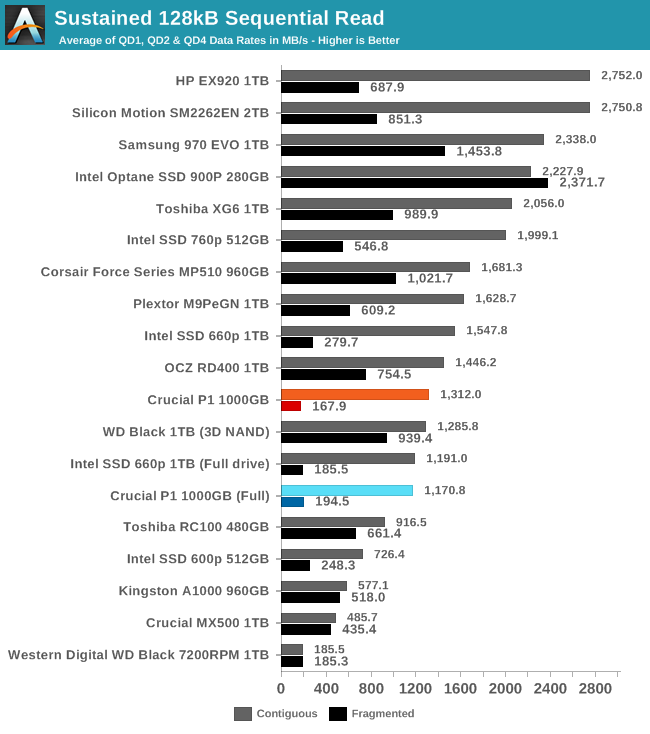
On the longer sequential read test, the Crucial P1 sustains sequential reads at over 1GB/s even when full, so long as the data is contiguous on the flash itself due to having been written sequentially. When reading data that has been modified heavily by random writes, the drive has to do random reads behind the scenes and its performance is no longer competitive with other current NVMe SSDs or even mainstream SATA SSDs, though it does at least maintain roughly the same level of performance that can be expected from a hard drive (which doesn't need wear leveling and thus is not subject to internal fragmentation). As with the burst sequential read test, the Intel 660p is slightly faster.
 |
|||||||||
| Power Efficiency in MB/s/W | Average Power in W | ||||||||
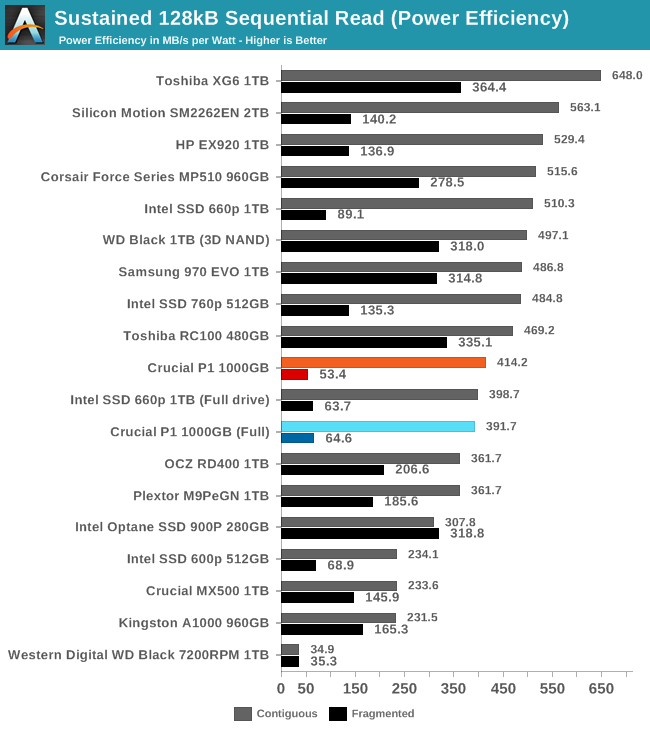
The power efficiency of the Crucial P1 when reading contiguous data is reasonable for a NVMe drive but nothing special. When reading data with internal fragmentation, the power consumption is the same but the reduced performance drags the efficiency way down, to only 50% better than a 3.5" hard drive.
 |
|||||||||
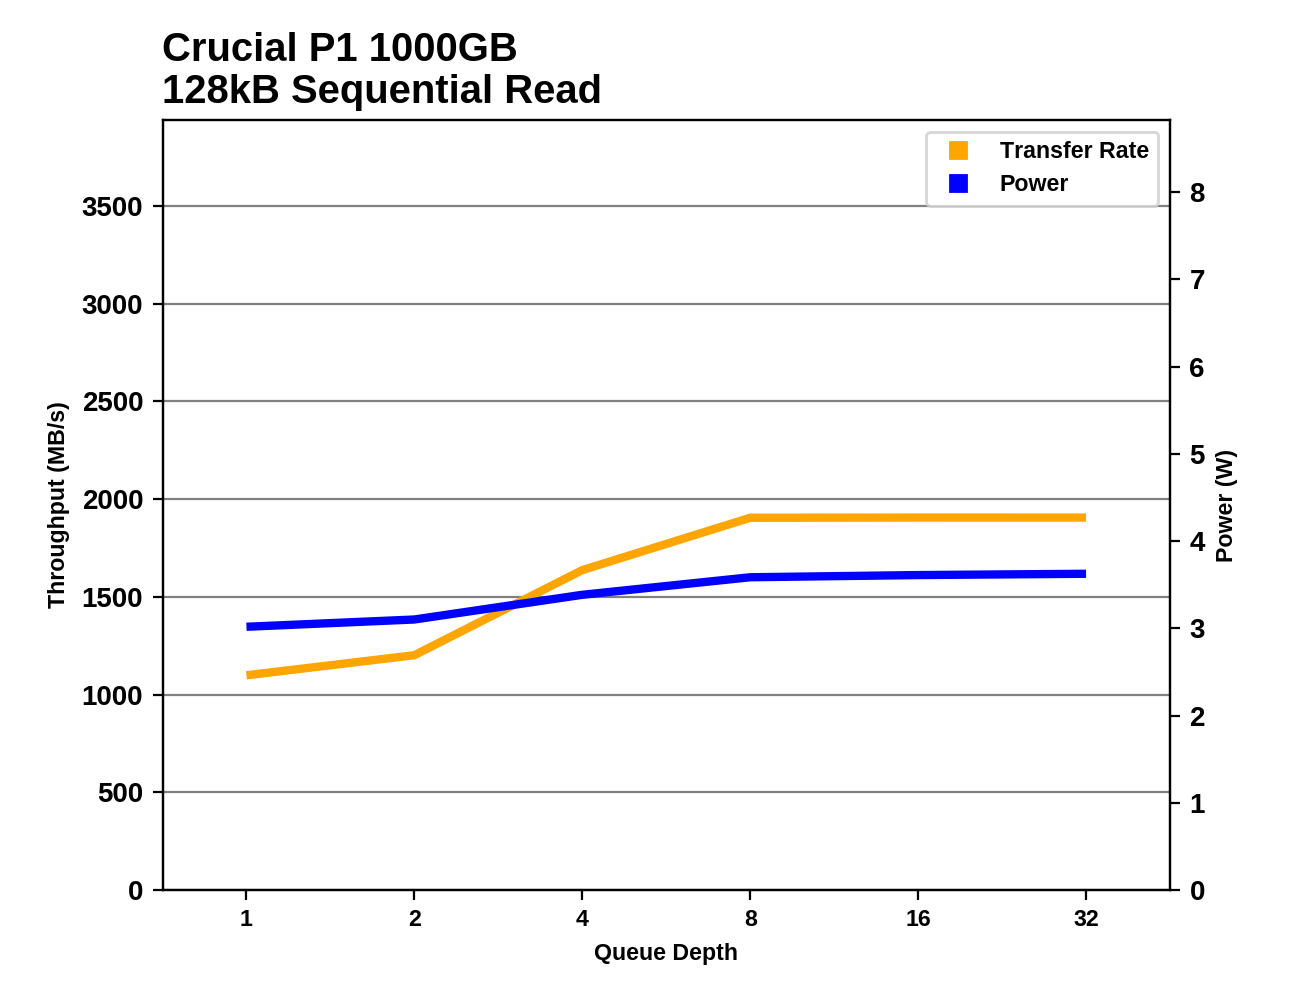
The Crucial P1 reaches full sequential read speed of just under 2GB/s at QD8 or higher. While the Intel 660p has the advantage at low queue depths, the P1 ends up slightly faster at higher queue depths.
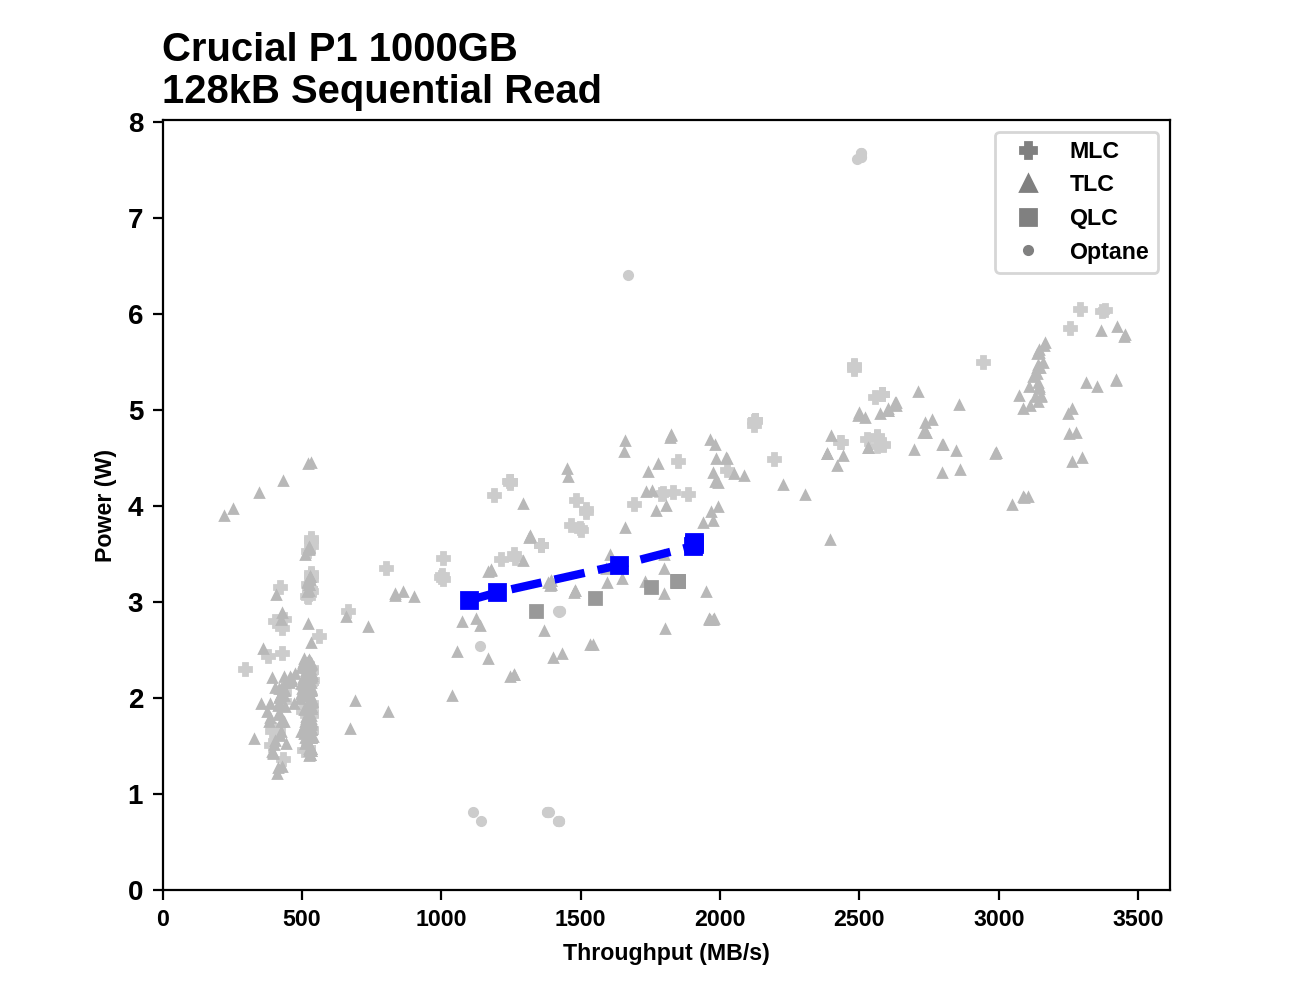
Looking at which part of the performance and power landscape the Crucial P1 occupies compared to all the other drives that have been subjected to our 2018 SSD tests, the P1 is very middle-of-the-road among NVMe drives for both performance and power consumption. There are drives with similar read performance profiles that require nearly 1W less, and high-performance drives that can deliver more than 1GB/s faster speeds than the P1 without using much more power than the P1 at its peak.
Sequential Write Performance
Our test of sequential write burst performance is structured identically to the sequential read burst performance test save for the direction of the data transfer. Each burst writes 128MB as 128kB operations issued at QD1, for a total of 1GB of data written to a drive containing 16GB of data.
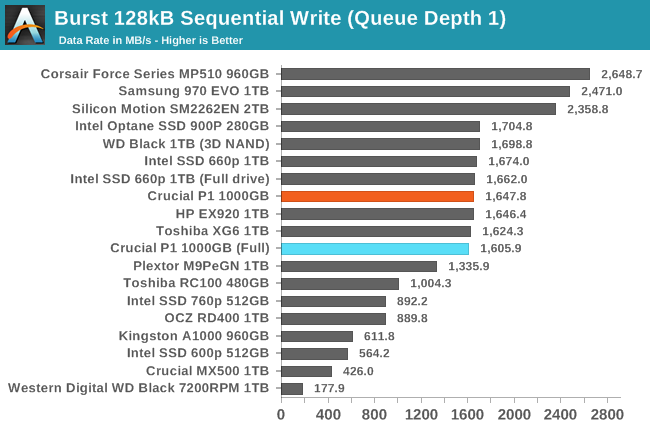
On the burst sequential write test, the Crucial P1 is on par with many high-end NVMe SSDs, thanks to the high write performance of its SLC cache. This test is short enough that the P1 doesn't overflow the SLC cache even when it is at its minimum size due to the drive being full.
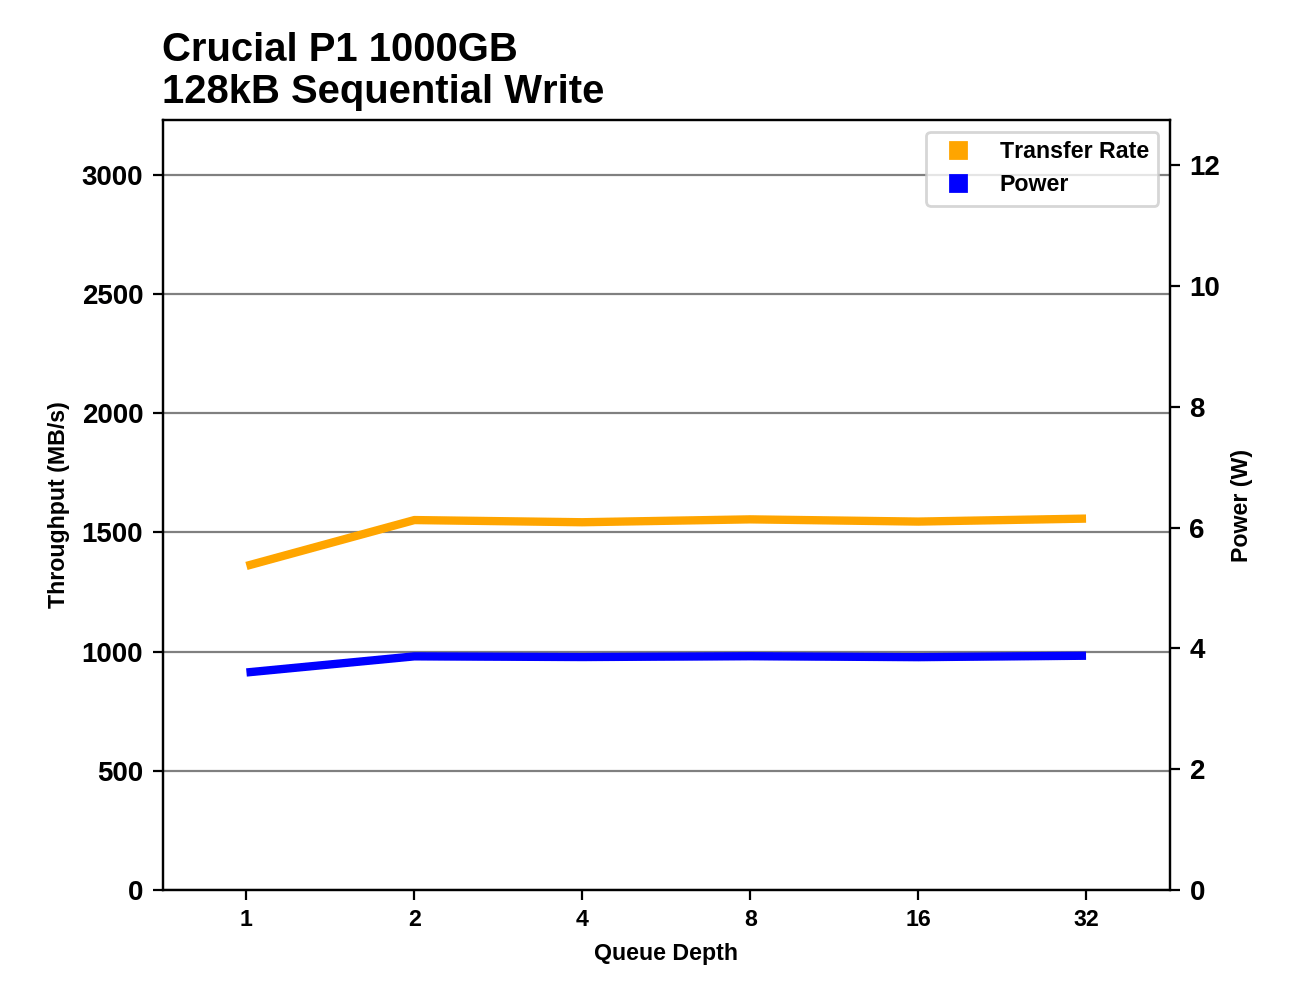
Our test of sustained sequential writes is structured identically to our sustained sequential read test, save for the direction of the data transfers. Queue depths range from 1 to 32 and each queue depth is tested for up to one minute or 32GB, followed by up to one minute of idle time for the drive to cool off and perform garbage collection. The test is confined to a 64GB span of the drive.
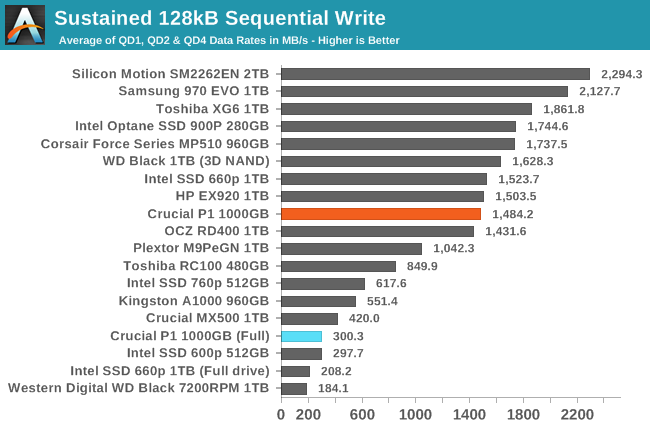
On the longer sequential write test, the Crucial P1 continues to perform well when the drive is mostly empty and the SLC cache is at its largest. When the drive is full, this test writes enough to overflow the cache and performance drops below that of mainstream SATA SSDs.
 |
|||||||||
| Power Efficiency in MB/s/W | Average Power in W | ||||||||
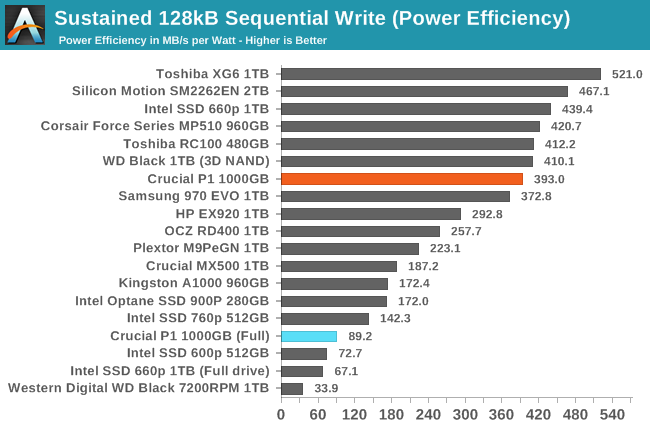
Power consumption by the Crucial P1 during the sustained sequential write test is lower than average for NVMe SSDs, so the efficiency is good when the test hits only the SLC cache. When the drive is full and the SLC cache overflows, the P1's efficiency is significantly worse than almost all of the competition, though the performance per Watt is still several times what a hard drive can manage.
 |
|||||||||
The Crucial P1 hits its full write speed at a queue depth of 2 or higher, when writing to the SLC cache. When the drive is full, the SLC cache overflows before the QD1 test phase is over, and performance bounces around a bit but stays generally quite low with each phase of the test. The Intel 660p is slightly faster when writing to its SLC cache, and performs more consistently when the cache is constantly overflowing.
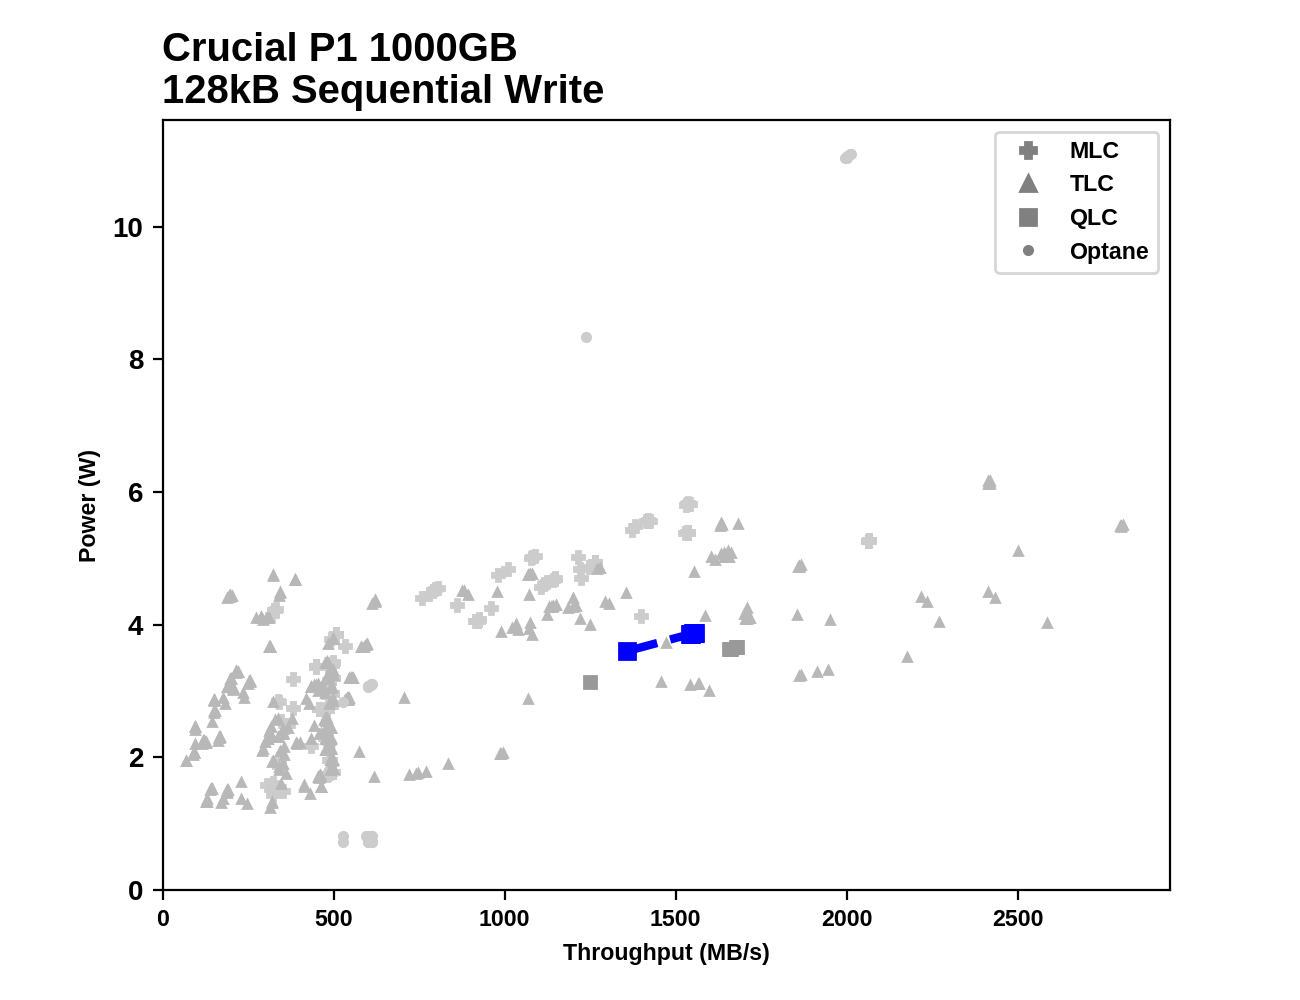
Compared against all the other drives that have completed our 2018 SSD test suite, the sequential write performance and power consumption of the Crucial P1 are better than most other low-end NVMe drives (or drives that would be considered low-end if they were still on the market). But there are numerous high-end drives that vastly outperform the P1, and some of them use a bit less power in doing so.
Whole-Drive Fill
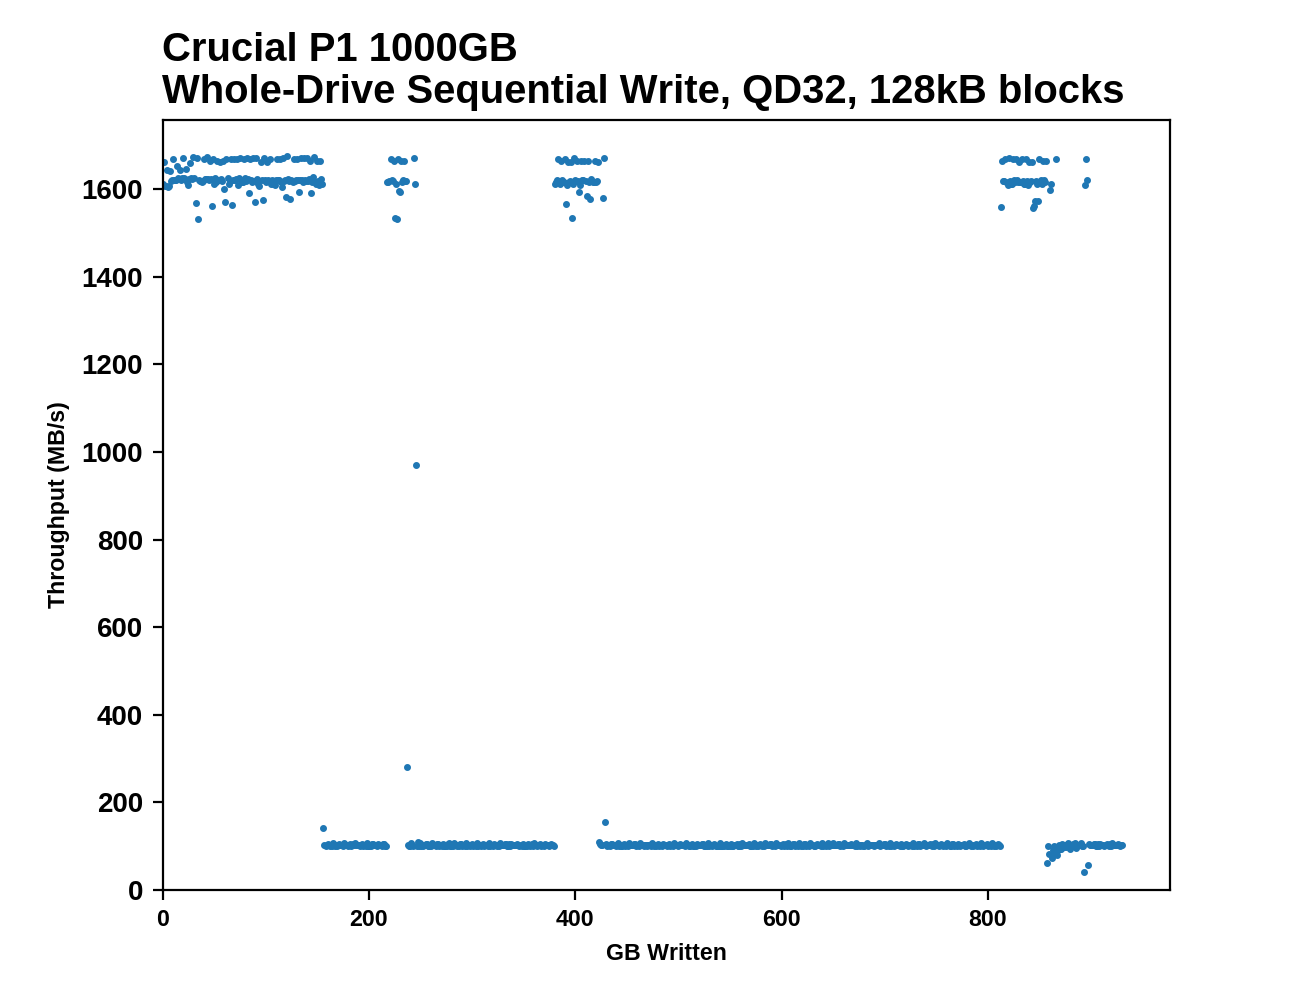
This test starts with a freshly-erased drive and fills it with 128kB sequential writes at queue depth 32, recording the write speed for each 1GB segment. This test is not representative of any ordinary client/consumer usage pattern, but it does allow us to observe transitions in the drive's behavior as it fills up. From this, we can estimate the size of any SLC write cache, and get a sense for how much performance remains on the rare occasions where real-world usage keeps writing data after filling the cache.
 |
|||||||||
The 1TB Crucial P1 manages about 155 GB of sequential writes before the SLC cache overflows and performance tanks. The drive does manage to free up some SLC cache on several occasions before the drive is completely full, so the write speed occasionally jumps back up. The Intel 660p only lasts for about 128 GB before its cache runs out, and while it does show some variability in write speed during the rest of the drive fill, it never gets all the way back up to the full SLC write speed.
 |
|||||||||
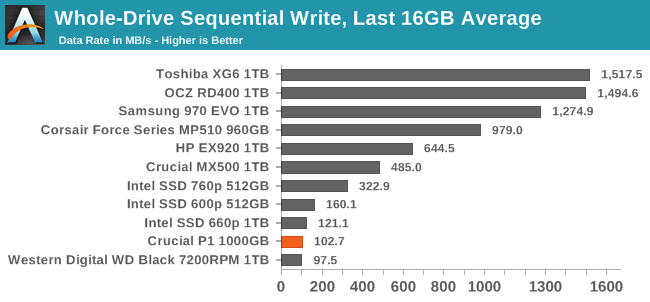
| Average Throughput for last 16 GB | Overall Average Throughput | ||||||||
For extremely large sequential write operations that overflow the SLC cache, the Crucial P1 and Intel 660p average out to about the same speed as a 7200RPM hard drive. The fast writes to the SLC cache don't last long enough to bring the average up very far above the steady-state write speeds of about 100MB/s. High-end NVMe SSDs with modern 3D TLC NAND and 8-channel controllers can sustain write speeds that are about an order of magnitude higher after the SLC caches run out.


66 Comments
View All Comments
Mikewind Dale - Thursday, November 8, 2018 - link
Sic:"A reduction in quantity and an increase in price will increase net revenue only if demand is elastic."
That should be "inelastic."
limitedaccess - Thursday, November 8, 2018 - link
The transition to TLC drives was also shortly followed with the transition to 3D NAND using higher process (larger) from smaller planar litho process. While smaller litho allowed more density it also came with the trade off of worse endurance/higher decay. So the transition to 3D NAND effectively offset the issues of MLC->TLC which is where we are today. What's the equivalent for TLC->QLC?Low litho planar TLC drives were the ones that were poorly received and performed worse then they reviewed in reality due to decay. And decay is the real issue here with QLC since no reviewer tests for it (it isn't the same as poor write endurance). Is that file I don't regularly access going to maintain the same read speeds or have massively higher latency to access due to the need for ECC to kick in?
0ldman79 - Monday, November 12, 2018 - link
I may not be correct on the exact numbers, but I think the NAND lithography has stopped at 22nm as they were having issues retaining data on 14nm, just no real benefit going to a smaller lithography.They may tune that in a couple of years, but the only way I can see that working with my rudimentary understanding of the system is to keep everything the same size as the 22nm (gates, gaps, fences, chains, roads, whatever, it's too late/early for me to remember the correct terms), same gaps only on a smaller process. They'd have no reduction in cost as they'd be using the same amount of each wafer, might have a reduction in power consumption.
I'm eager to see how they address the problem but it really looks like QLC may be a dead end. Eventually we're going to hit walls where lithography can't improve and we're going to have to come at the problem (cpu speed, memory speeds, NAND speeds, etc) from an entirely different angle than what we've been doing. For what, 40 years, we've been doing major design changes every 5 years or so and just relying on lithography to improve clock speeds.
I think that is about to cease entirely. They can probably go farther than what we're seeing but not economically.
Lolimaster - Friday, November 9, 2018 - link
Youre not specting a drive limited to 500MB to be as fast as a PCI-E 4x SSD with full support for it...TLC vs MLC all goes to endurance and degraded performance when the drive is full or the cache is exhausted.
Lolimaster - Friday, November 9, 2018 - link
Random performance seems the land of Optane and similar. Even the 16GB optane M10 absoluletely murders even the top of the line NVME Samsung MLC SSD.PaoDeTech - Thursday, November 8, 2018 - link
Yes, price is still too high. But it will come down. I think that the conclusions fail to highlight the main strength of this SSD: top performance / power. For portable devices, this is the key metric to consider. In this regard is far ahead any SATA SSD and almost all PCIe out there.Lolimaster - Friday, November 9, 2018 - link
Exactly. QLC should stick to big multiterabyte drives for avrg user or HEDT.Like 4TB+.
0ldman79 - Monday, November 12, 2018 - link
I think that's where they need to place QLC.Massive "read mostly" storage. xx layer TLC for a performance drive, QLC for massive data storage, ie; all of my Steam games installed on a 10 cent per gig "read mostly" drive while the OS and my general use is on a 22 cent per gig TLC.
That's what they're trying to do with that SLC cache, but I think they need to push it a lot farther, throw a 500GB TLC cache on a 4 terabyte QLC drive. That might be able to have it fit into the mainstream NVME lineup.
Flunk - Thursday, November 8, 2018 - link
MSRP seems a little high, I recently picked up an HP EX920 1TB for $255 and that's a much faster drive. Perhaps the street price will be lower.B3an - Thursday, November 8, 2018 - link
That latency is APPALLING and the performance is below par. If this was dirt cheap it might be worth it to some people, but at that price it's a joke.