The Intel 9th Gen Review: Core i9-9900K, Core i7-9700K and Core i5-9600K Tested
by Ian Cutress on October 19, 2018 9:00 AM EST- Posted in
- CPUs
- Intel
- Coffee Lake
- 14++
- Core 9th Gen
- Core-S
- i9-9900K
- i7-9700K
- i5-9600K
CPU Performance: System Tests
Our System Test section focuses significantly on real-world testing, user experience, with a slight nod to throughput. In this section we cover application loading time, image processing, simple scientific physics, emulation, neural simulation, optimized compute, and 3D model development, with a combination of readily available and custom software. For some of these tests, the bigger suites such as PCMark do cover them (we publish those values in our office section), although multiple perspectives is always beneficial. In all our tests we will explain in-depth what is being tested, and how we are testing.
All of our benchmark results can also be found in our benchmark engine, Bench.
Application Load: GIMP 2.10.4
One of the most important aspects about user experience and workflow is how fast does a system respond. A good test of this is to see how long it takes for an application to load. Most applications these days, when on an SSD, load fairly instantly, however some office tools require asset pre-loading before being available. Most operating systems employ caching as well, so when certain software is loaded repeatedly (web browser, office tools), then can be initialized much quicker.
In our last suite, we tested how long it took to load a large PDF in Adobe Acrobat. Unfortunately this test was a nightmare to program for, and didn’t transfer over to Win10 RS3 easily. In the meantime we discovered an application that can automate this test, and we put it up against GIMP, a popular free open-source online photo editing tool, and the major alternative to Adobe Photoshop. We set it to load a large 50MB design template, and perform the load 10 times with 10 seconds in-between each. Due to caching, the first 3-5 results are often slower than the rest, and time to cache can be inconsistent, we take the average of the last five results to show CPU processing on cached loading.
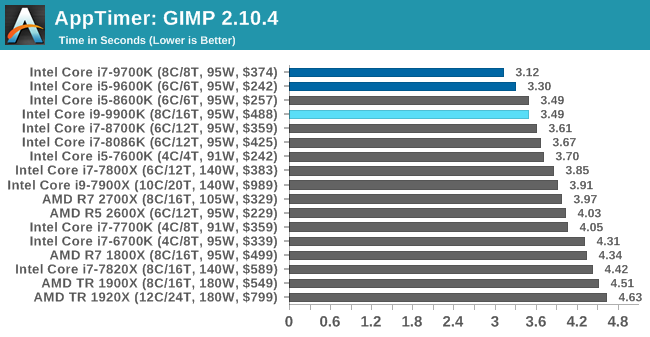
Application loading is typically single thread limited, but we see here that at some point it also becomes core-resource limited. Having access to more resources per thread in a non-HT environment helps the 8C/8T and 6C/6T processors get ahead of both of the 5.0 GHz parts in our testing.
FCAT: Image Processing
The FCAT software was developed to help detect microstuttering, dropped frames, and run frames in graphics benchmarks when two accelerators were paired together to render a scene. Due to game engines and graphics drivers, not all GPU combinations performed ideally, which led to this software fixing colors to each rendered frame and dynamic raw recording of the data using a video capture device.
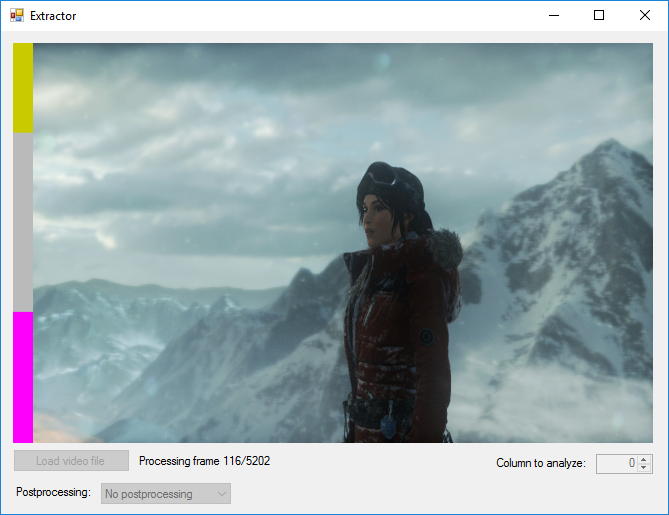
The FCAT software takes that recorded video, which in our case is 90 seconds of a 1440p run of Rise of the Tomb Raider, and processes that color data into frame time data so the system can plot an ‘observed’ frame rate, and correlate that to the power consumption of the accelerators. This test, by virtue of how quickly it was put together, is single threaded. We run the process and report the time to completion.
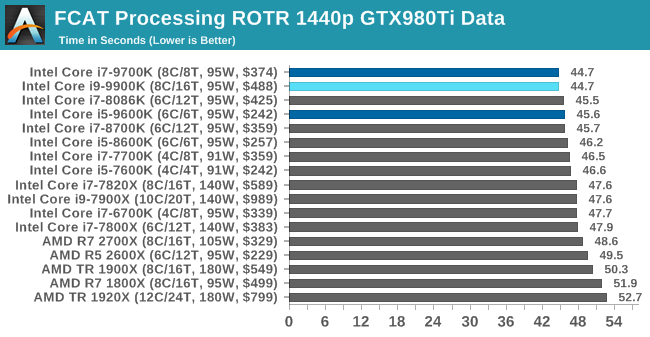
FCAT is another single thread limited scenario, and it looks like the new 9th gen parts do very well here. The 9700K and 9900K get the same time, split by milliseconds.
3D Particle Movement v2.1: Brownian Motion
Our 3DPM test is a custom built benchmark designed to simulate six different particle movement algorithms of points in a 3D space. The algorithms were developed as part of my PhD., and while ultimately perform best on a GPU, provide a good idea on how instruction streams are interpreted by different microarchitectures.
A key part of the algorithms is the random number generation – we use relatively fast generation which ends up implementing dependency chains in the code. The upgrade over the naïve first version of this code solved for false sharing in the caches, a major bottleneck. We are also looking at AVX2 and AVX512 versions of this benchmark for future reviews.
For this test, we run a stock particle set over the six algorithms for 20 seconds apiece, with 10 second pauses, and report the total rate of particle movement, in millions of operations (movements) per second. We have a non-AVX version and an AVX version, with the latter implementing AVX512 and AVX2 where possible.
3DPM v2.1 can be downloaded from our server: 3DPMv2.1.rar (13.0 MB)
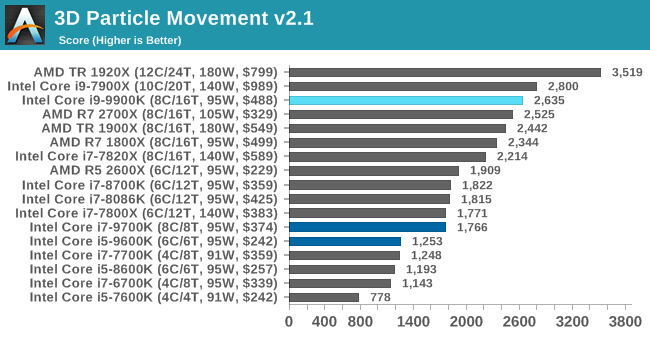
With a non-AVX code base, the 9900K shows the IPC and frequency improvements over the R7 2700X, although in reality it is not as big of a percentage jump as you might imagine. The processors without HT get pushed back a bit here.
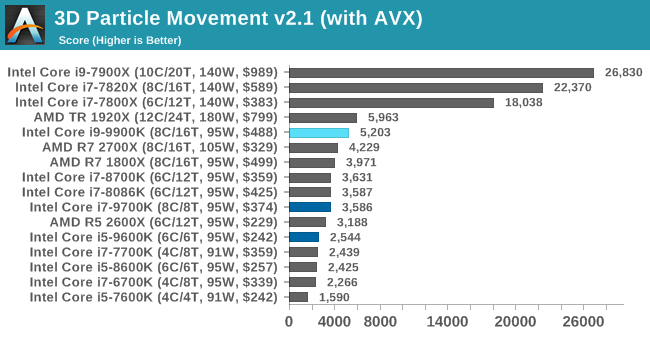
When we factor in AVX2/AVX512, the Skylake-X processors go off into a world of their own. The 9900K gets a bigger jump on the R7 2700X, more in line with what we expect, and the Core i7-9700K gets a boost as well.
Dolphin 5.0: Console Emulation
One of the popular requested tests in our suite is to do with console emulation. Being able to pick up a game from an older system and run it as expected depends on the overhead of the emulator: it takes a significantly more powerful x86 system to be able to accurately emulate an older non-x86 console, especially if code for that console was made to abuse certain physical bugs in the hardware.
For our test, we use the popular Dolphin emulation software, and run a compute project through it to determine how close to a standard console system our processors can emulate. In this test, a Nintendo Wii would take around 1050 seconds.
The latest version of Dolphin can be downloaded from https://dolphin-emu.org/
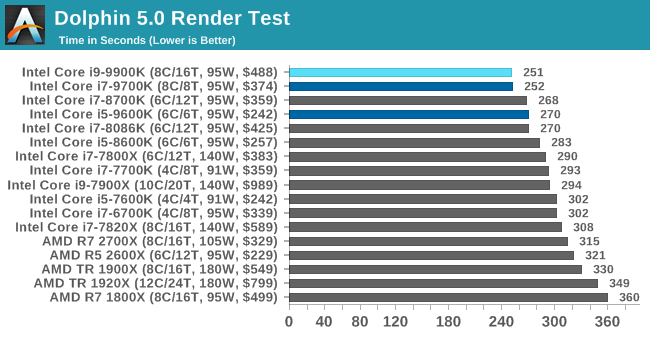
Dolphin is another single thread limited scenario, wher Intel processors have historically done well. Here the 9900K nudges out the 9700K by a second.
DigiCortex 1.20: Sea Slug Brain Simulation
This benchmark was originally designed for simulation and visualization of neuron and synapse activity, as is commonly found in the brain. The software comes with a variety of benchmark modes, and we take the small benchmark which runs a 32k neuron / 1.8B synapse simulation, equivalent to a Sea Slug.

Example of a 2.1B neuron simulation
We report the results as the ability to simulate the data as a fraction of real-time, so anything above a ‘one’ is suitable for real-time work. Out of the two modes, a ‘non-firing’ mode which is DRAM heavy and a ‘firing’ mode which has CPU work, we choose the latter. Despite this, the benchmark is still affected by DRAM speed a fair amount.
DigiCortex can be downloaded from http://www.digicortex.net/
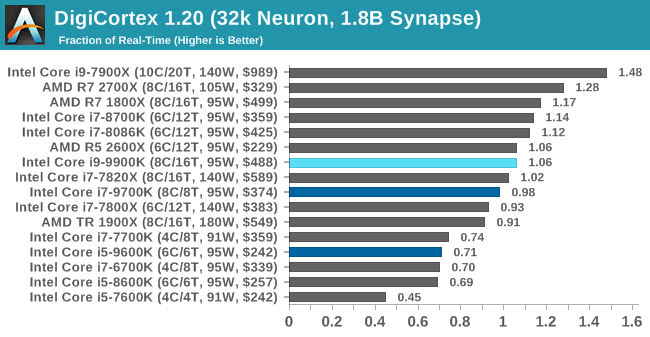
DigiCortex runs high on CPU performance and memory bandwidth, but it seems here that a 6-core Ryzen can match the 8-core 9900K pretty easily. the 8700K/8086K seem to do better on this test as well.
y-Cruncher v0.7.6: Microarchitecture Optimized Compute
I’ve known about y-Cruncher for a while, as a tool to help compute various mathematical constants, but it wasn’t until I began talking with its developer, Alex Yee, a researcher from NWU and now software optimization developer, that I realized that he has optimized the software like crazy to get the best performance. Naturally, any simulation that can take 20+ days can benefit from a 1% performance increase! Alex started y-cruncher as a high-school project, but it is now at a state where Alex is keeping it up to date to take advantage of the latest instruction sets before they are even made available in hardware.
For our test we run y-cruncher v0.7.6 through all the different optimized variants of the binary, single threaded and multi-threaded, including the AVX-512 optimized binaries. The test is to calculate 250m digits of Pi, and we use the single threaded and multi-threaded versions of this test.
Users can download y-cruncher from Alex’s website: http://www.numberworld.org/y-cruncher/
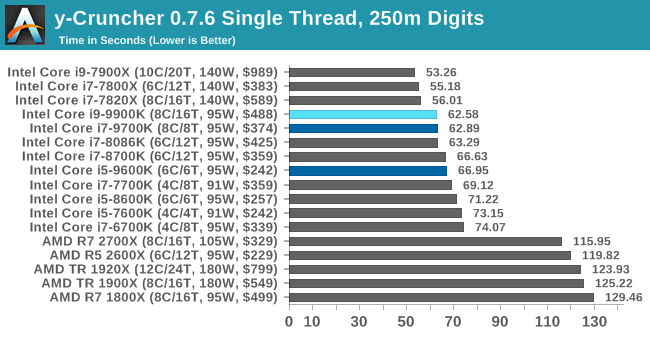
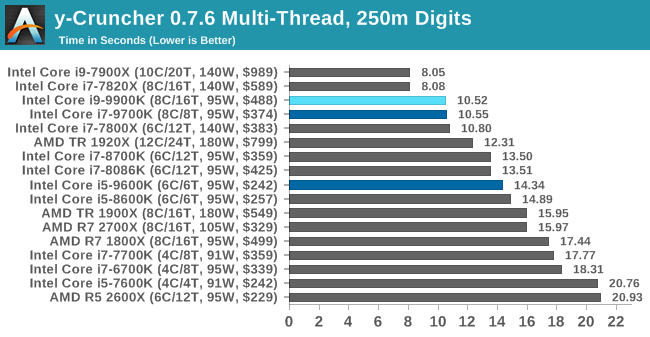
As y-cruncher has AVX2/AVX512 benefits, we see the Skylake-X processors again go off in their own little world. In multi-threaded, it takes 8 cores in the 9900K/9700K to get beyond a 6-core AVX512 enabled part.
Agisoft Photoscan 1.3.3: 2D Image to 3D Model Conversion
One of the ISVs that we have worked with for a number of years is Agisoft, who develop software called PhotoScan that transforms a number of 2D images into a 3D model. This is an important tool in model development and archiving, and relies on a number of single threaded and multi-threaded algorithms to go from one side of the computation to the other.
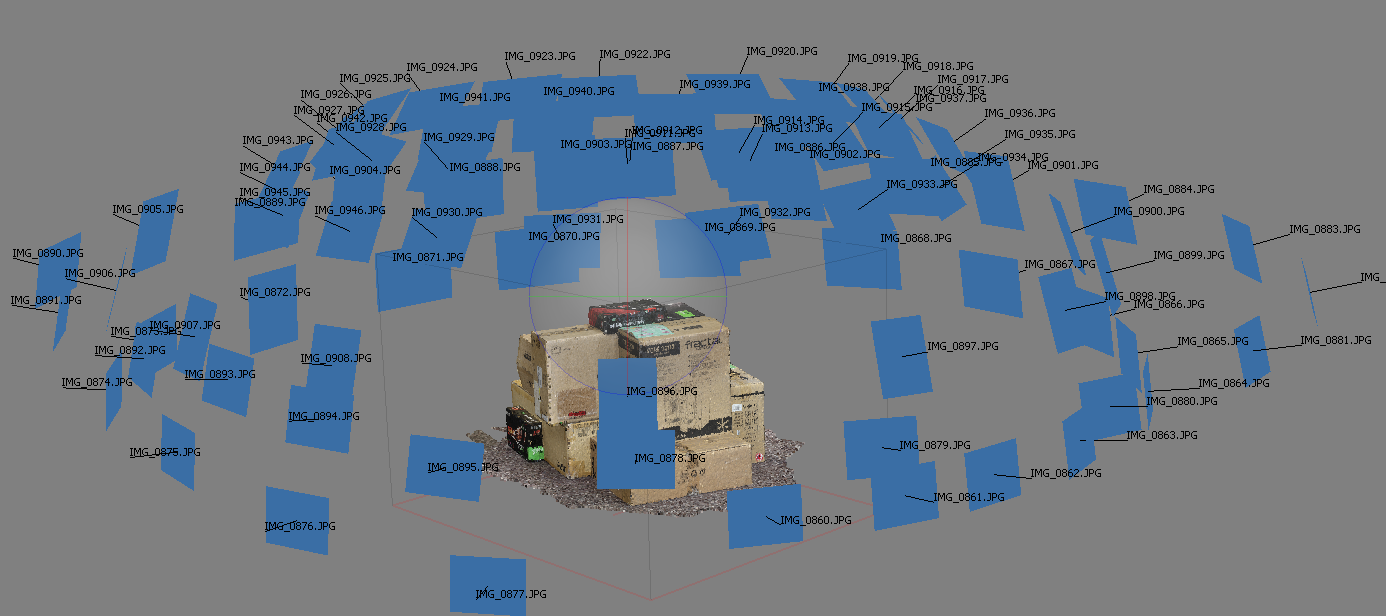
In our test, we take v1.3.3 of the software with a good sized data set of 84 x 18 megapixel photos and push it through a reasonably fast variant of the algorithms, but is still more stringent than our 2017 test. We report the total time to complete the process.
Agisoft’s Photoscan website can be found here: http://www.agisoft.com/
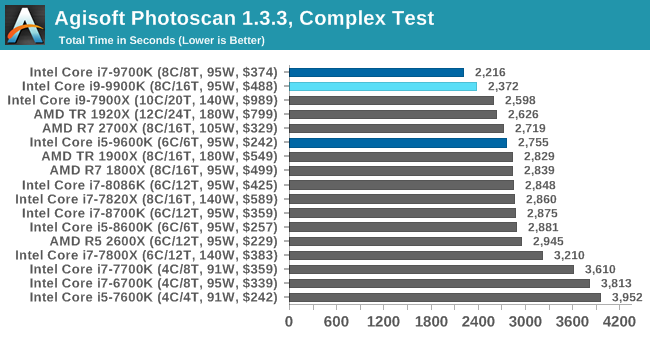
Photoscan is a task that seems to enjoy both high throughput, single threaded performance, and in this case it looks like having HT off as well.


274 Comments
View All Comments
3dGfx - Friday, October 19, 2018 - link
game developers like to build and test on the same machinemr_tawan - Saturday, October 20, 2018 - link
> game developers like to build and test on the same machineOh I thought they use remote debugging.
12345 - Wednesday, March 27, 2019 - link
Only thing I can think of as a gaming use for those would be to pass through a gpu each to several VMs.close - Saturday, October 20, 2018 - link
@Ryan, "There’s no way around it, in almost every scenario it was either top or within variance of being the best processor in every test (except Ashes at 4K). Intel has built the world’s best gaming processor (again)."Am I reading the iGPU page wrong? The occasional 100+% handicap does not seem to be "within variance".
daxpax - Saturday, October 20, 2018 - link
if you noticed 2700x is faster in half benchmarks for games but they didnt include itnathanddrews - Friday, October 19, 2018 - link
That wasn't a negative critique of the review, just the opposite in fact: from the selection of benchmarks you provided, it is EASY to see that given more GPU power, the new Intel chips will clearly outperform AMD most of the time - generally with average, but specifically minimum frames. From where I'm sitting - 3570K+1080Ti - I think I could save a lot of money by getting a 2600X/2700X OC setup and not miss out on too many fpses.philehidiot - Friday, October 19, 2018 - link
I think anyone with any sense (and the constraints of a budget / missus) will be stupid to buy this CPU for gaming. The sensible thing to do is to buy the AMD chip that provides 99% of the gaming performance for half the price (even better value when you factor in the mobo) and then to plough that money into a better GPU, more RAM and / or a better SSD. The savings from the CPU alone will allow you to invest a useful amount more into ALL of those areas. There are people who do need a chip like this but they are not gamers. Intel are pushing hard with both the limitations of their tech (see: stupid temperatures) and their marketing BS (see: outright lies) because they know they're currently being held by the short and curlies. My 4 year old i5 may well score within 90% of these gaming benchmarks because the limitation in gaming these days is the GPU. Sorry, Intel, wrong market to aim at.imaheadcase - Saturday, October 20, 2018 - link
I like how you said limitations in tech and point to temps, like any gamer cares about that. Every game wants raw performance, and the fact remains intel systems are still easier to go about it. The reason is simple, most gamers will upgrade from another intel system and use lots of parts from it that work with current generation stuff.Its like the whole Gsync vs non gsync. Its a stupid arguement, its not a tax on gsync when you are buying the best monitor anyways.
philehidiot - Saturday, October 20, 2018 - link
Those limitations affect overclocking and therefore available performance. Which is hardly different to much cheaper chips. You're right about upgrading though.emn13 - Saturday, October 20, 2018 - link
The AVX 512 numbers look suspicious. Both common sense and other examples online suggest that AVX512 should improve performance by much less than a factor 2. Additionally, AVX-512 causes varying amounts of frequency throttling; so you;re not going to get the full factor 2.This suggests to me that your baseline is somehow misleading. Are you comparing AVX512 to ancient SSE? To no vectorization at all? Something's not right there.