The iPhone XS & XS Max Review: Unveiling the Silicon Secrets
by Andrei Frumusanu on October 5, 2018 8:00 AM EST- Posted in
- Mobile
- Apple
- Smartphones
- iPhone XS
- iPhone XS Max
GPU Performance
The performance improvement of the A12 GPU was one of the biggest highlights of the keynote presentation, promising up to 50% higher performance versus the A11 GPU. Apple has achieved this by "simply" adding in a fourth GPU core, up from three on the A11, and by introducing memory compression on the GPU. The memory compression is what I think the most contributing factor to the increased microarchitectural performance of the GPU, as it really is a huge one-time shift, which admittedly, took Apple a long time to make.
One thing that I’d like to mention before going into the benchmarks, is that peak performance and peak power consumption of the latest Apple GPUs is a problem. We’ve seen Apple transition from promoting its sustained performance over time, to actually being one of the worst “offenders” in terms of actual performance degradation from the peak capabilities of the SoC. There’s reasons to this, but I’ll be addressing them shortly.
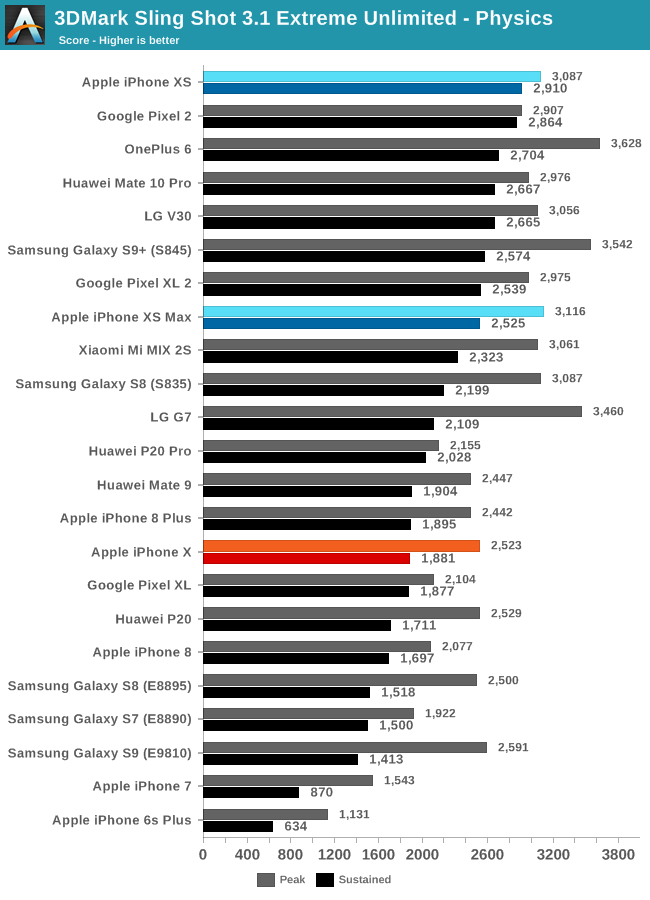
In the 3DMark Physics test, which is mostly a CPU-bound test that also stresses the overall platform power limits while the GPU is also doing work, we see the iPhone XS and the A12 achieve some great gains over last year’s iPhone. This had been a test that in the past had been particularly problematic for Apple CPUs, however it seems that this microarchitectural hiccup was solved in the A11 and the Monsoon cores. The Vortex cores along with the generally improved power efficiency of the SoC further raises the performance, finally matching the Arm’s cores in this particular test.
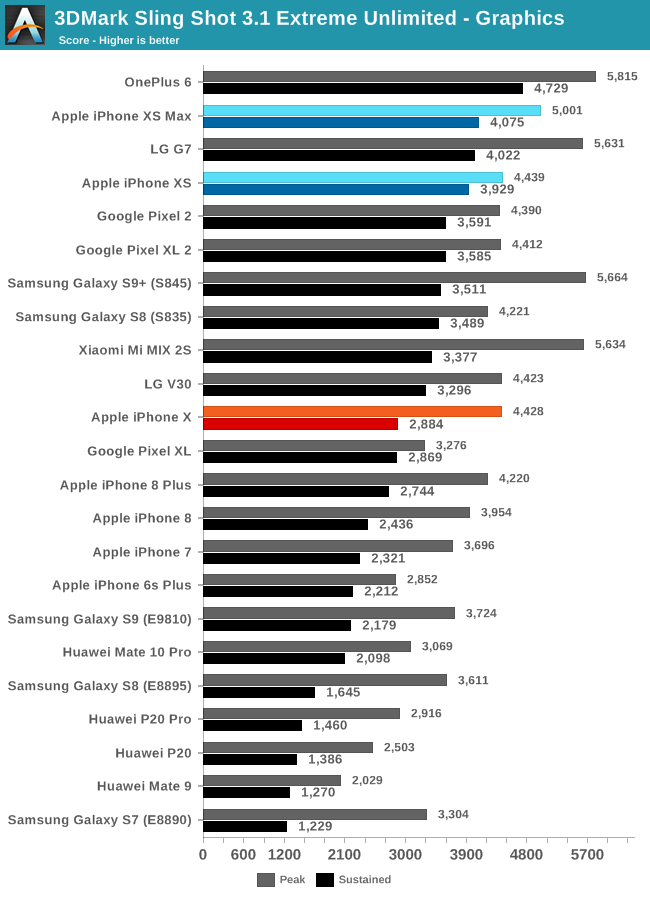
In the Graphics part of the 3DMark test, the iPhone XS showcases 41% better sustained performance over last year’s iPhone X. In this particular test, the OnePlus 6’s more generous thermals still allow the Snapdragon 845 to outperform the new chip.
In terms of peak performance, I encountered some great issues in 3DMark: I was completely unable to complete a single run on either the iPhone XS or XS Max while the devices were cool. If the device is cool enough, the GPU will boost to such high performance states that it will actually crash. I was consistently able to reproduce this over and over again. I attempted to measure power during this test, and the platform had instantaneous average power of 7-8 watts, figures above this which I suspect weren’t recorded by my measurement methodology. For the GPU to crash, it means that the power delivery is failing to deliver the necessary transient currents during operation and we’ll see a voltage dip that corrupts the GPU.
When iterating the test several times over a few attempts, in order to heat up the SoC until it decides to start off with a lower GPU frequency, it will successfully complete the test.
GFXBench
Kishonti most recently released the new GFXBench 5 Aztec Ruins test, which brings a newer, more modern, and complex workload to our test suite. In an ideal world we would be testing real games, however this is an incredible headache on mobile devices as there are essentially no games with built-in benchmarking modes. There are some tools to gather fps values, but the biggest concern here is repeatability of the workload when one manually plays the game – also a huge concern for many of the online games of today.
| GFXBench Sub-Tests | |||||
| AnandTech | Aztec High |
Aztec Normal |
Manhattan 3.1 |
T-Rex | |
| Scene length | 64.3s | 64.3s | 62s | 56s | |
| Resolution | 2560 x 1440 | 1920 x 1080 | 1920 x 1080 | 1920 x 1080 | |
| Compute Shaded Pixels | ~1.5% of work | ~1.5% of work | ~3% of work | ~2.4% of work | |
| Total Shaded Pixels | ~5.80M / frame ~161% of scene |
~2.64M / frame ~127% of scene |
~1.90M / frame ~92% of scene |
~0.65M / frame ~31% of scene |
|
| Av Triangles Per Frame | ~440K | ~207K | ~244K | ~724K | |
| Memory B/W Per Frame (Mali G72 GPU specific) |
VK | 652MB (413R + 239W) |
268MB (160R + 107W) |
135MB (88R + 46W) |
73MB (51R + 22W) |
| GL | 514MB (331R + 182W) |
242MB (154R + 87W) |
|||
I still think synthetic benchmark testing has a very solid place here – as long as you understand the characteristics of the benchmark. Kishonti’s GFXBench here has been an industry standard for years now, and the new Aztec test gives us a different kind of workload. The new tests are a lot more shader heavy, making use of more complex effects which stress the arithmetic power of the GPUs. While the data in the above table has been collected on an Arm Mali G72 GPU – it still should give an overall indication of what to expect on other architectures. The new tests are also very bandwidth hungry due to their larger textures.
In general games will correlate with benchmarks depending on the percentage of the various graphical workloads, being fillrate or texture heavy, having complex geometries, or simply the ever more increasing complexity of shader effects which demand more arithmetic power of a GPU.
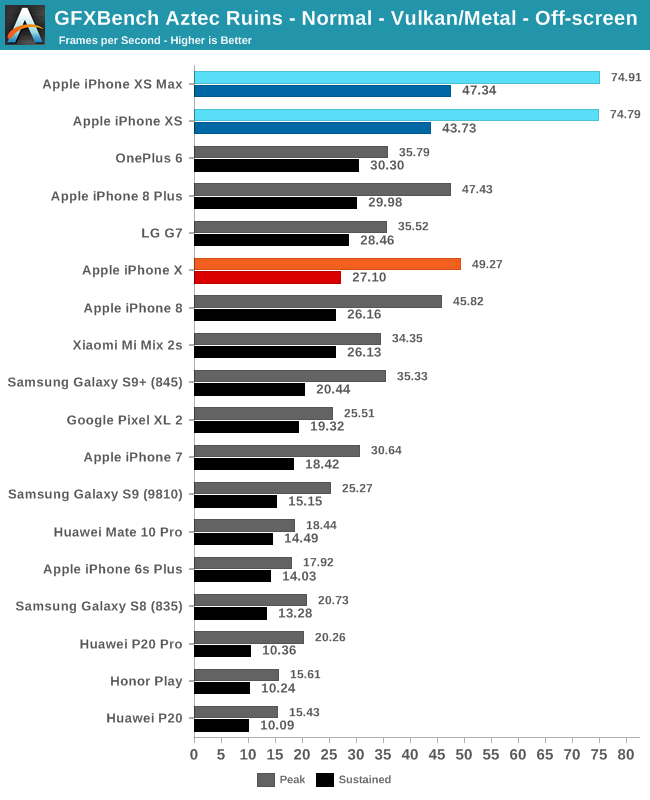
In Aztec Ruins in Normal mode, which is the less demanding new test, the new Apple A12 phones showcase some extremely high peak performance, showcasing a 51% increase over last year’s iPhones.
In terms of sustained performance, the figures quickly reduce after a few minutes and stabilise further down the road. Here, the iPhone XS outperforms the iPhone X by 61%. The Apple A12 is also able to beat the current leader, the Snapdragon 845 inside the OnePlus 6, by 45% in sustained performance.
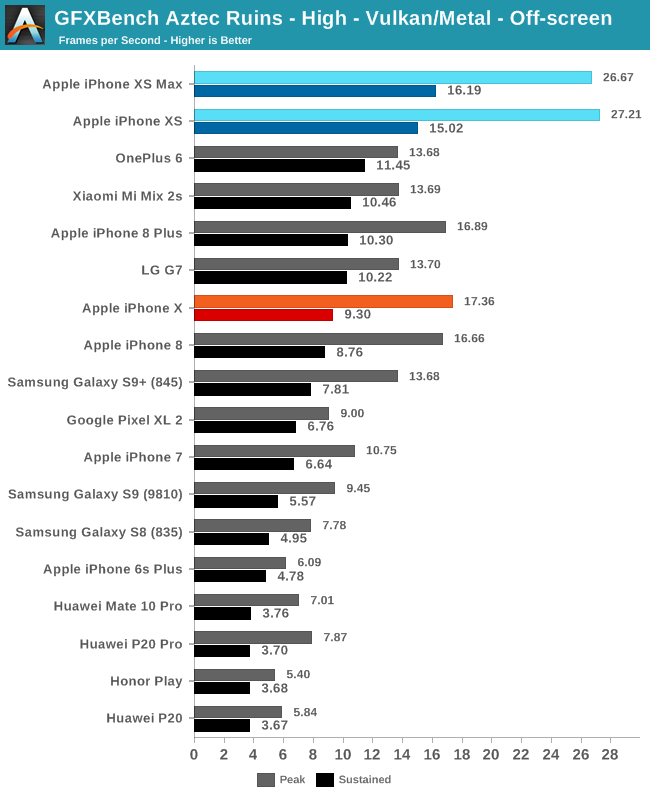
In the High mode of Aztec Ruins, we’re seeing an eerily similar performance ranking. The iPhone XS’s peak performance is again great, but what should matter is the sustained score. Here again the iPhone XS’s performance is 61% better over the iPhone X. The performance delta to the OnePlus 6’s Snapdragon 845 is reduced to 31% here, which is a tad less than the Normal run, it’s possible we’re hitting some bottlenecks here in some aspects of the microarchitecture.
GPU Power
Platform and GPU power for Apple devices has been something I wanted to publish for some time, but there complexities in achieving this. I was able to get reasonable figures for the new iPhone XS – however data on older SoCs is still something that might have to wait for a future opportunity.
I haven’t had time to measure Aztec across the swath of devices, so we’re still relying on the standard Manhattan 3.1 and T-Rex figures. First off, to get the full performance figures out of the way:
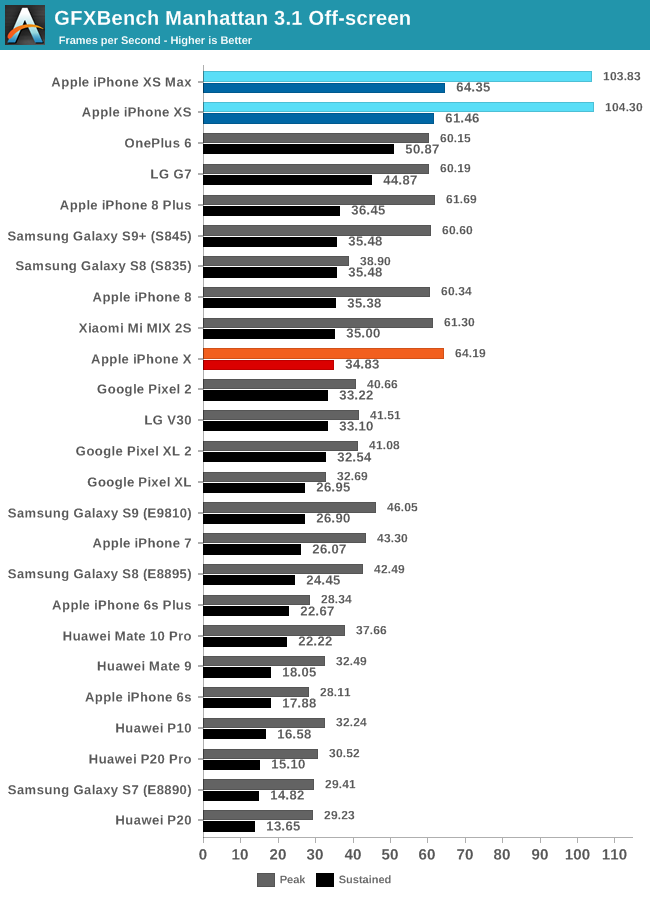
Again in Manhattan 3.1, the new iPhone XS performs an extraordinary 75% better than the iPhone X. The improvements here are not just because of the microarchitectural improvements of the GPU, and having an extra core, all along with the new process node of the SoC, but also thanks to the new memory compression which will reduce power consumption of the external DRAM, something that can represent up to 20-30% of system power in bandwidth heavy 3D workloads. Saved power on the DRAM means more thermal envelope that can be used by the GPU and SoC, increasing performance.
| GFXBench Manhattan 3.1 Offscreen Power Efficiency (System Active Power) |
||||
| Mfc. Process | FPS | Avg. Power (W) |
Perf/W Efficiency |
|
| iPhone XS (A12) Warm | 7FF | 76.51 | 3.79 | 20.18 fps/W |
| iPhone XS (A12) Cold / Peak | 7FF | 103.83 | 5.98 | 17.36 fps/W |
| Galaxy S9+ (Snapdragon 845) | 10LPP | 61.16 | 5.01 | 11.99 fps/W |
| Galaxy S9 (Exynos 9810) | 10LPP | 46.04 | 4.08 | 11.28 fps/W |
| Galaxy S8 (Snapdragon 835) | 10LPE | 38.90 | 3.79 | 10.26 fps/W |
| LeEco Le Pro3 (Snapdragon 821) | 14LPP | 33.04 | 4.18 | 7.90 fps/W |
| Galaxy S7 (Snapdragon 820) | 14LPP | 30.98 | 3.98 | 7.78 fps/W |
| Huawei Mate 10 (Kirin 970) | 10FF | 37.66 | 6.33 | 5.94 fps/W |
| Galaxy S8 (Exynos 8895) | 10LPE | 42.49 | 7.35 | 5.78 fps/W |
| Galaxy S7 (Exynos 8890) | 14LPP | 29.41 | 5.95 | 4.94 fps/W |
| Meizu PRO 5 (Exynos 7420) | 14LPE | 14.45 | 3.47 | 4.16 fps/W |
| Nexus 6P (Snapdragon 810 v2.1) | 20Soc | 21.94 | 5.44 | 4.03 fps/W |
| Huawei Mate 8 (Kirin 950) | 16FF+ | 10.37 | 2.75 | 3.77 fps/W |
| Huawei Mate 9 (Kirin 960) | 16FFC | 32.49 | 8.63 | 3.77 fps/W |
| Huawei P9 (Kirin 955) | 16FF+ | 10.59 | 2.98 | 3.55 fps/W |
The power figures here are system active power, meaning the total device power, minus the idle power of a given workload scenario (Which includes screen power among other things).
At peak performance, when the device is cool under 22°C ambient temperatures, the Apple A12’s GPU can get quite power hungry, reaching 6W of power. This wasn’t really the peak average of the GPU as I did mention that I saw 3DMark reach around 7.5W (before crashing).
Even at this high power figure, the efficiency of the A12 beats all other SoCs. While this is somewhat interesting, it’s incredibly important to emphasise Apple’s throttling behaviour. After only 3 minutes, or 3 benchmark runs, the phone will throttle by around 25%, to what I describe in the efficiency table as the “Warm” state. Here power reaches reasonable 3.79W. It’s to be noted that the power efficiency did not drastically go up, only improving by 16% over the peak figures. What this could point out is that the platform has a relatively shallow power curve, and performance is mostly limited by thermals.
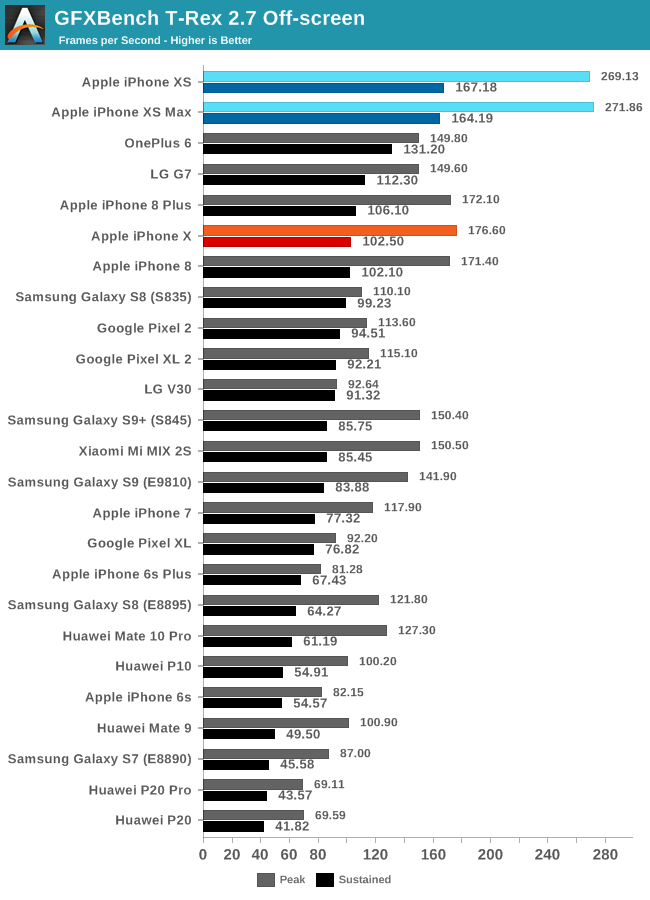
Moving on to T-Rex, again the iPhone XS showcased a similar 61% improvement in sustained performance.
| GFXBench T-Rex Offscreen Power Efficiency (System Active Power) |
||||
| Mfc. Process | FPS | Avg. Power (W) |
Perf/W Efficiency |
|
| iPhone XS (A12) Warm | 7FF | 197.80 | 3.95 | 50.07 fps/W |
| iPhone XS (A12) Cold / Peak | 7FF | 271.86 | 6.10 | 44.56 fps/W |
| Galaxy S9+ (Snapdragon 845) | 10LPP | 150.40 | 4.42 | 34.00 fps/W |
| Galaxy S9 (Exynos 9810) | 10LPP | 141.91 | 4.34 | 32.67 fps/W |
| Galaxy S8 (Snapdragon 835) | 10LPE | 108.20 | 3.45 | 31.31 fps/W |
| LeEco Le Pro3 (Snapdragon 821) | 14LPP | 94.97 | 3.91 | 24.26 fps/W |
| Galaxy S7 (Snapdragon 820) | 14LPP | 90.59 | 4.18 | 21.67 fps/W |
| Galaxy S8 (Exynos 8895) | 10LPE | 121.00 | 5.86 | 20.65 fps/W |
| Galaxy S7 (Exynos 8890) | 14LPP | 87.00 | 4.70 | 18.51 fps/W |
| Huawei Mate 10 (Kirin 970) | 10FF | 127.25 | 7.93 | 16.04 fps/W |
| Meizu PRO 5 (Exynos 7420) | 14LPE | 55.67 | 3.83 | 14.54 fps/W |
| Nexus 6P (Snapdragon 810 v2.1) | 20Soc | 58.97 | 4.70 | 12.54 fps/W |
| Huawei Mate 8 (Kirin 950) | 16FF+ | 41.69 | 3.58 | 11.64 fps/W |
| Huawei P9 (Kirin 955) | 16FF+ | 40.42 | 3.68 | 10.98 fps/W |
| Huawei Mate 9 (Kirin 960) | 16FFC | 99.16 | 9.51 | 10.42 fps/W |
Power consumption for T-Rex is in-line with what we saw in Manhattan, with the peak figures on a cold device reaching a little over 6W. After 3 runs, this again reduces to under 4W, at a 28% reduction in performance. Efficiency again doesn’t improve by much here, pointing out to a shallow power curve again.
It’s to be noted that the power measurements of the “Warm” runs don’t represent sustained performance, and I simply wanted to add an additional data-point to the table alongside the peak figures. Sustained power envelopes for most devices are in the 3-3.5W range.
So why does Apple post such big discrepancies between peak performance and sustained performance, when the latter was a keynote focus point for Apple as recent as the iPhone 6 and the A8? The change is due to how everyday GPU use-cases have changed, and how Apple uses the GPU for non 3D related workloads.
Apple makes heavy use of GPU compute for various uses, such as general hardware acceleration in apps to using the GPU compute for camera image processing. These are use-cases where sustained performance doesn’t really matter because they’re transactional workloads, meaning fixed workloads that need to be processed as fast as possible.
Android GPU compute has been a literal disaster over the last few years, and I primarily blame Google for not supporting OpenCL in AOSP – leaving support to be extremely patchy among vendors. RenderScript has never picked up much as it just doesn’t guarantee performance. The fragmentation of Android devices and SoCs has meant that in third-party apps GPU compute is essentially non-existent (Please correct me if I’m wrong!).
Apple’s vertical integration and tight control of the API stack means that GPU compute is a reality, and peak transactional GPU performance is a metric that is worth consideration.
Now while this does explain the throttling, I still do think Apple can do some kind of optimisation in regards to the thermals. I played some Fortnite on the iPhone XS’, and the way that the phones heated up isn’t something that I was very much fan of. Here the must be some kind of way to let actual games and applications which have a characteristic of sustained performance, actually start off with the GPU limited to this sustained performance state.
Other than the thermal and peak performance considerations, the iPhone XS and XS Max, thanks to the new A12 SoC, showcase industry leading performance and efficiency, and currently are the best mobile platforms for gaming, period.


253 Comments
View All Comments
alexdi - Tuesday, February 5, 2019 - link
As a tech geek, I agree with your analysis. I have an X because the XR looks like a cheap design and I appreciate AMOLED. I think this is a minority sentiment, though. The XR is a stellar handset, perhaps the best available for most people. Between the battery life, SoC, and Apple's generous iOS update policy, the longevity will be extraordinary. I expect to see "still happily rolling along" comments even into 2025.Anirudh2FL - Wednesday, June 26, 2019 - link
Is it just me or are iPhones fast becoming one of the worst flagships to take pics in low light/indoor light ?Are the pics as bad as they appear ?
Forgun - Tuesday, June 23, 2020 - link
Thanks for the useful information.