The AMD Threadripper 2990WX 32-Core and 2950X 16-Core Review
by Dr. Ian Cutress on August 13, 2018 9:00 AM ESTPower Consumption, TDP, and Prime95 vs POV-Ray
For most of us, processors hover around the 15W range in notebooks, and 65-95W in desktops. High-end desktop processors have always been power hungry, with numbers of 130W and 140W fairly common. When AMD launched a 220W processor on the old Vishera platform, pushing the Bulldozer family cores up to 5.0 GHz, we all thought AMD was completely mental – there were plenty of motherboards that were socket compatible at the time, although to actually harness 220W and up, a range of new high-end motherboards had to be announced. Intel’s highest on-roadmap processor part to date has an official TDP rating of 205W, but now AMD has gone one better, with 250W.
The two new WX processors, the 32-core 2990WX and 2970WX, are both rated for 250W. In both cases they have all four silicon dies active, six Infinity Fabric links active (as described in page 4), and aim to push the boundaries in performance, with AMD showing slides with a 3.6 GHz all-core turbo. The other two processors, X-series replacements, are at 180W, the same as the first generation Threadripper parts they replace.
However, not all TDPs are equal. How Intel and AMD measure TDP has changed over the years, and subsequently now have little value to the real world. Let me explain.
TDP Is a Joke
The value of TDP, or thermal design power, is not a measure of power consumption. It is technically a measure of cooler performance, and a cooler needs to be rated at the TDP level in order to perform regular functions. Actual power consumption should technically be higher – thermal losses from the processor into the socket and from the socket into the motherboard also contribute to cooling, but are not involved in the TDP number. However, for most use cases, TDP and power consumption are used interchangeably, as their differences are minor.
Given this is a review about AMD processors, we can start there. AMD’s TDP calculation relies on a simple formula:
TDP = (Load Temperature in Celsius – Idle Temperature in Celcius) / Thermal Capacity of Cooler
Thus typically AMD will quote for its Ryzen 7 2700X processor that with a load temperature of about 62C, an idle temperature of 42C, and a cooler with a thermal capacity of 0.189 C per Watt (the Wraith Max), we get a value of around 105W.
AMD’s formula has two problems in that the load temperature can be adjusted with fans / external air flow, and that the thermal capacity of the cooler can have a big impact in the result – with a large liquid cooler that has a higher thermal capacity, such as 0.400 C per Watt, then the rated TDP is actually lower: in the case of the Ryzen 7 2700X as above, it would come out as 50 W. AMD does use the thermal performance of its bundled cooler, just to keep things consistent, but it does mean that the TDP rating and the power consumption are not equal and can be manufacturered in a certain direction if AMD were simply to use a different cooler for its comparisons.
Intel’s version of TDP is a little more complex, for one main reason that has not made it into the ecosystem. Intel only defines its TDP for the base frequency, and not the turbo frequency. As a result, if Intel releases a processor with a 95W TDP, a base frequency of 3.2 GHz, a single-core turbo of 4.7 GHz, and an all-core turbo of 4.2 GHz, then Intel only guarantees that power consumption at the base frequency of 3.2 GHz will be 95W, not the all-core turbo. This leaves the base operation for the processor in any motherboard that uses turbo (all of them) to have a higher power draw than TDP in any loaded scenarios.
This is very annoying. Intel advertises the single core turbo quite prolifically in its marketing, and has recently decided that its all-core turbo values should not be published. We are told that it is proprietary, which is vast about-turn from its previous disclosure policy. Not only that, this data is freely available with the chips in hand. But it does mean that almost every processor will have an all-core turbo frequency above the base frequency, and thus can run above TDP very easily.
We can see this best with a Core i7-8700 and its 65W TDP. It has a 3.2 GHz base frequency, a single core turbo of 4.6 GHz, and an all-core turbo of 4.3 GHz. If we load up the threads and then limit the power consumption to 65W, we get the following:

So just a warning about when it comes to TDP values. Take them with a grain of salt. Or a spoonful.
Power Consumption
There are several ways to measure power consumption of a processor. The typical easy way is to use a power meter which gives the wall power consumption of the full system, including efficiency losses by the power delivery of the motherboard. The complex way is hooking up the required tools to the board to measure the current through the 12V connector, and measure the CPU voltage using the overclocking measurement points on certain motherboards. A third way is by reading the hardware registers with applicable software.
Reading registers is a double edged sword. First, you are relying on internal measurements, which often have one of the wider error margins. Second, you are relying on the CPU manufacturer to report the correct numbers, which is not always true (!). However on the plus side, we can often get more information out from the processor, such as a breakdown of per-core power, DRAM power, IO/Interconnect power, integrated graphics power, and a general look at how the power is distributed. The hardware registers are how the system tells itself how much power it is using, and how it has to adjust the voltage/frequency depending on current draw, power draw, or thermal performance. The other plus side is that we can roll it into our testing scripts fairly easily.
Testing for power consumption is also a topic to consider. Usually a power virus is used, which can prod every area of the processor simultaneously for the peak power draw. A power virus is often used as an overclocking stability test, but these have one drawback in that they typically do not represent real-world power draw. It is a fine line between a real-world test and a synthetic test designed to cram every joule of energy through a chip. Software such as LINPACK is often used as a highly optimized power test, or internal tools from Intel and AMD can stress a chip even harder.
Prime95 is an often used candidate, because it also ends up being hyper-optimized for almost every core and drives the power home. Its workload is semi-synthetic, based on calculating prime numbers, but the stress test forgoes the results and just aims at power. During this review, we started playing a little with POV-Ray as our power tester, as it seemed to cause more power draw than Prime95, while also being a real-world ray-tracing workload. As I am writing this, I am deciding which tool is best to measure power consumption: Prime95 has trouble with larger core counts (sometimes it is hard to get numbers beyond 25 threads), and to get POV-Ray to work technically we adjust the affinity loading, which is more about loading cores than threads, however the data suggests that it is actually the threads that are being loaded. I will point out which software we are using in our data at each stage, however our POV-Ray was developed mid-review, so most data is with Prime95.
Overall Power Consumption
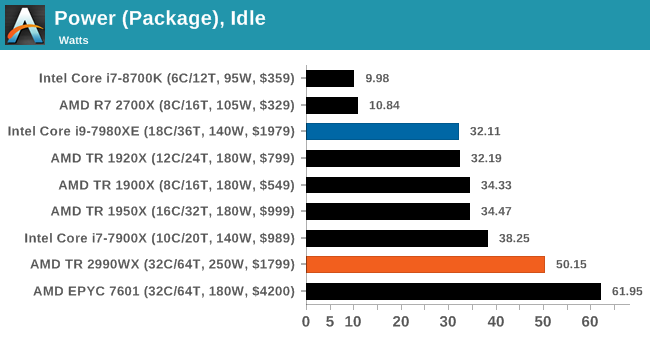
For this first set of data, I want to represent the full-chip power consumption measured in different scenarios. Firstly at idle, which as we’ve seen on Page 4 can be properly dominated by how the interconnect on the processor powers up and powers down.
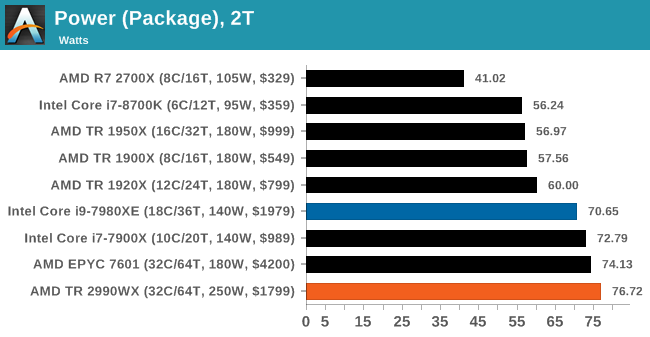
Next, we load a single core with two threads of Prime95. Our testing methodology forces both threads onto the same core for those that can accept multiple threads. Users focusing on a single task will be more in this area for power, or for systems where Windows is tinkering in the background.
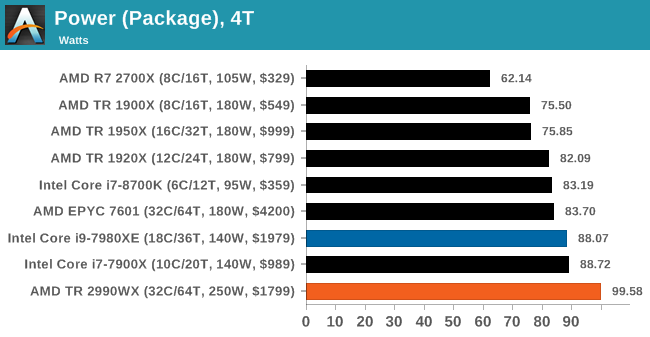
The third test is the system loaded with four threads of Prime95. This will cover the majority of how most people use systems day to day, with multiple browser tabs and windows open, several software packages on the go, or perhaps a game or two.
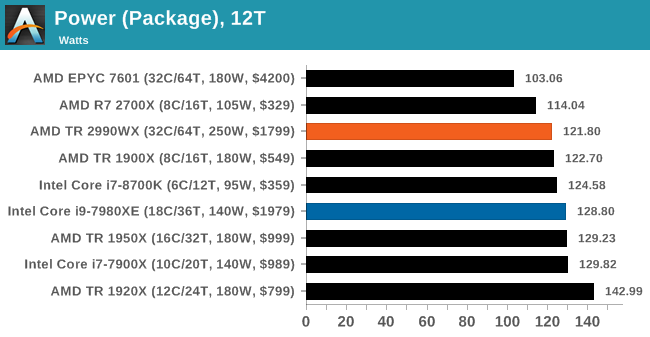
Moving up a gear to twelve threads of Prime95, we are moving more into the multi-taskers that have sizeable workloads. This will include gamers and streamers, or users who are rendering while also performing other tasks.
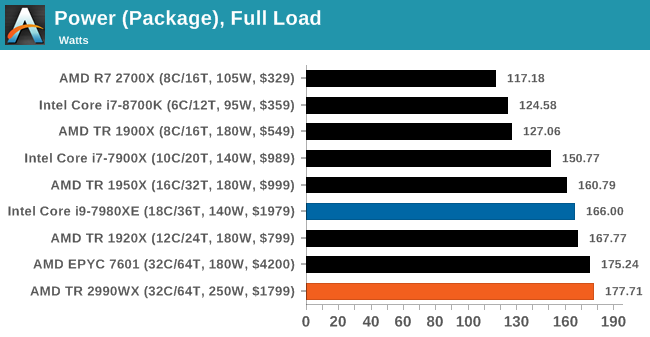
The final graph, for good measure, is the full load power draw. For this test we are running a full set of Prime95 threads, however in the future we will be using POV-Ray for this test as it tends to be more consistent, especially at high thread-count workloads. The only downside here is that an overclocked 2990WX can complete the POV-Ray test in under 20 seconds.
Per-Core Power Consumption
Before we created the POV-Ray power consumption test, I ran both of the new Threadripper processors we have on an all-threads test with Prime95, and extracted the power consumption of each core at each loading. Click each image to zoom in.

On the first core loading, we can see that the power consumption is ~23W, which is super high for a single Zeppelin core. This goes through to two cores loaded as well, but when we hit three cores we only top out around 18.8W per core. Given that this chip has four CCXes, we have to wonder if this is because the threads are being loaded onto the same CCX (which is what is happening, based on the processor enumeration), and we are hitting CCX power limits. At four cores loaded, each core is more around 17.4W.
Moving onto five cores loaded, and the fifth core sits at 18.2W while the other four are at 16.8W, indicating that this new core is located on a new CCX. When we move from eight cores to nine cores, we see the same thing whereby the ninth core has 17.5W of power, whereas the other eight are at 14.3W. The power distribution finally drops to 7-9W per core when we hit all 16 cores loaded.
At the end, we observe a total package power consumption of ~178W, near the 180W TDP, with ~135W on the cores and the rest on the non-core hardware (Infinity Fabric, IO, IMC).
Moving onto the 2990WX, and the story looks very odd indeed.
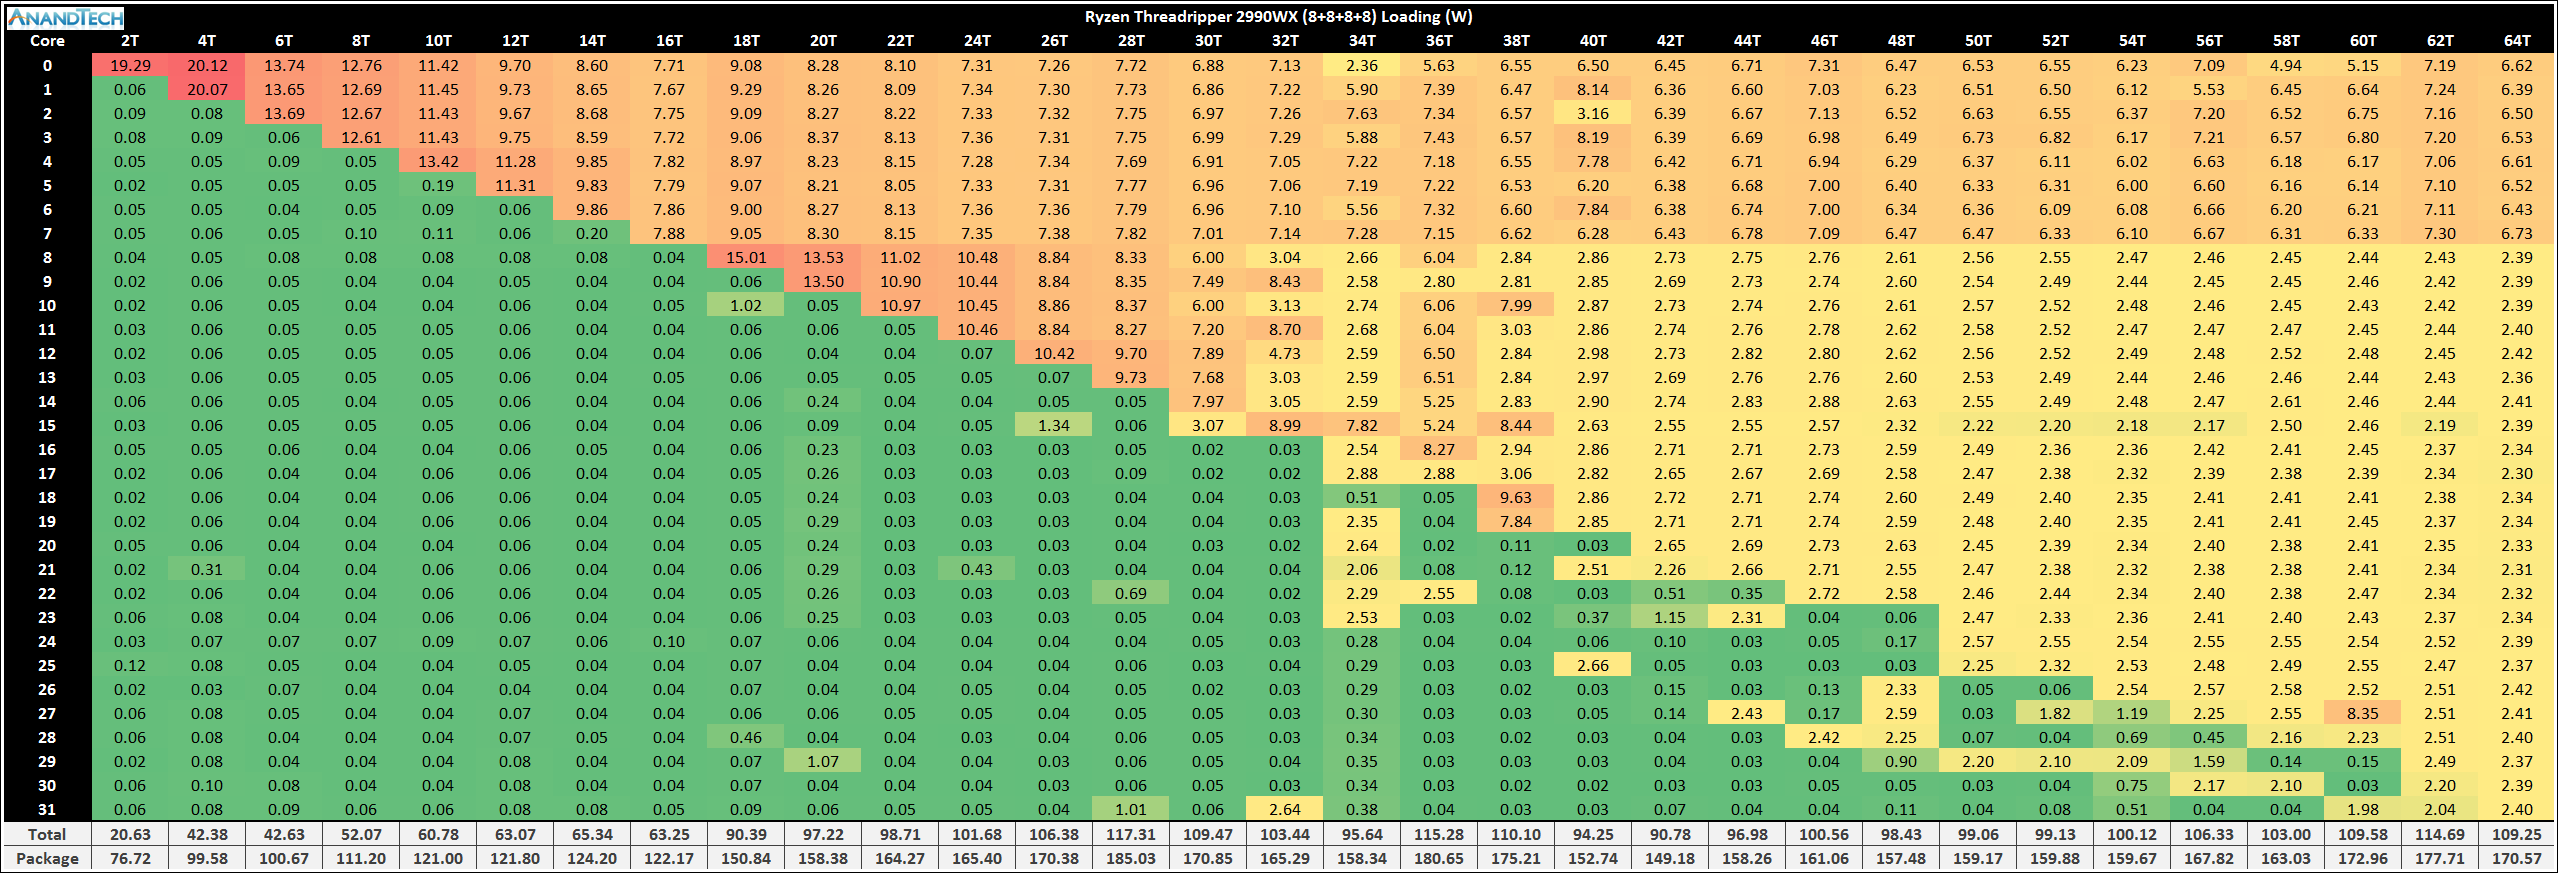
For the most part, the power consumption data up to 15 cores follows the same trend as the 2950X. However as we push on, it is clear that the first zeppelin die is clearly the favored – as more threads are loaded, power is taken from the second die, all the way down to 2.4W per core. The first zeppelin die, at full load, has around 6.6W per core, but all the other cores on the processor have 2.4W. There might be something in this test causing the first die to have preferential power over the others. It is also worth noting that the power consumption for the chip is near 180W, not the 250W as listed by TDP.
It was around this time that the POV-Ray version of the power script was developed. I ran it through the 2990WX to see the results. This time it was far more as expected:
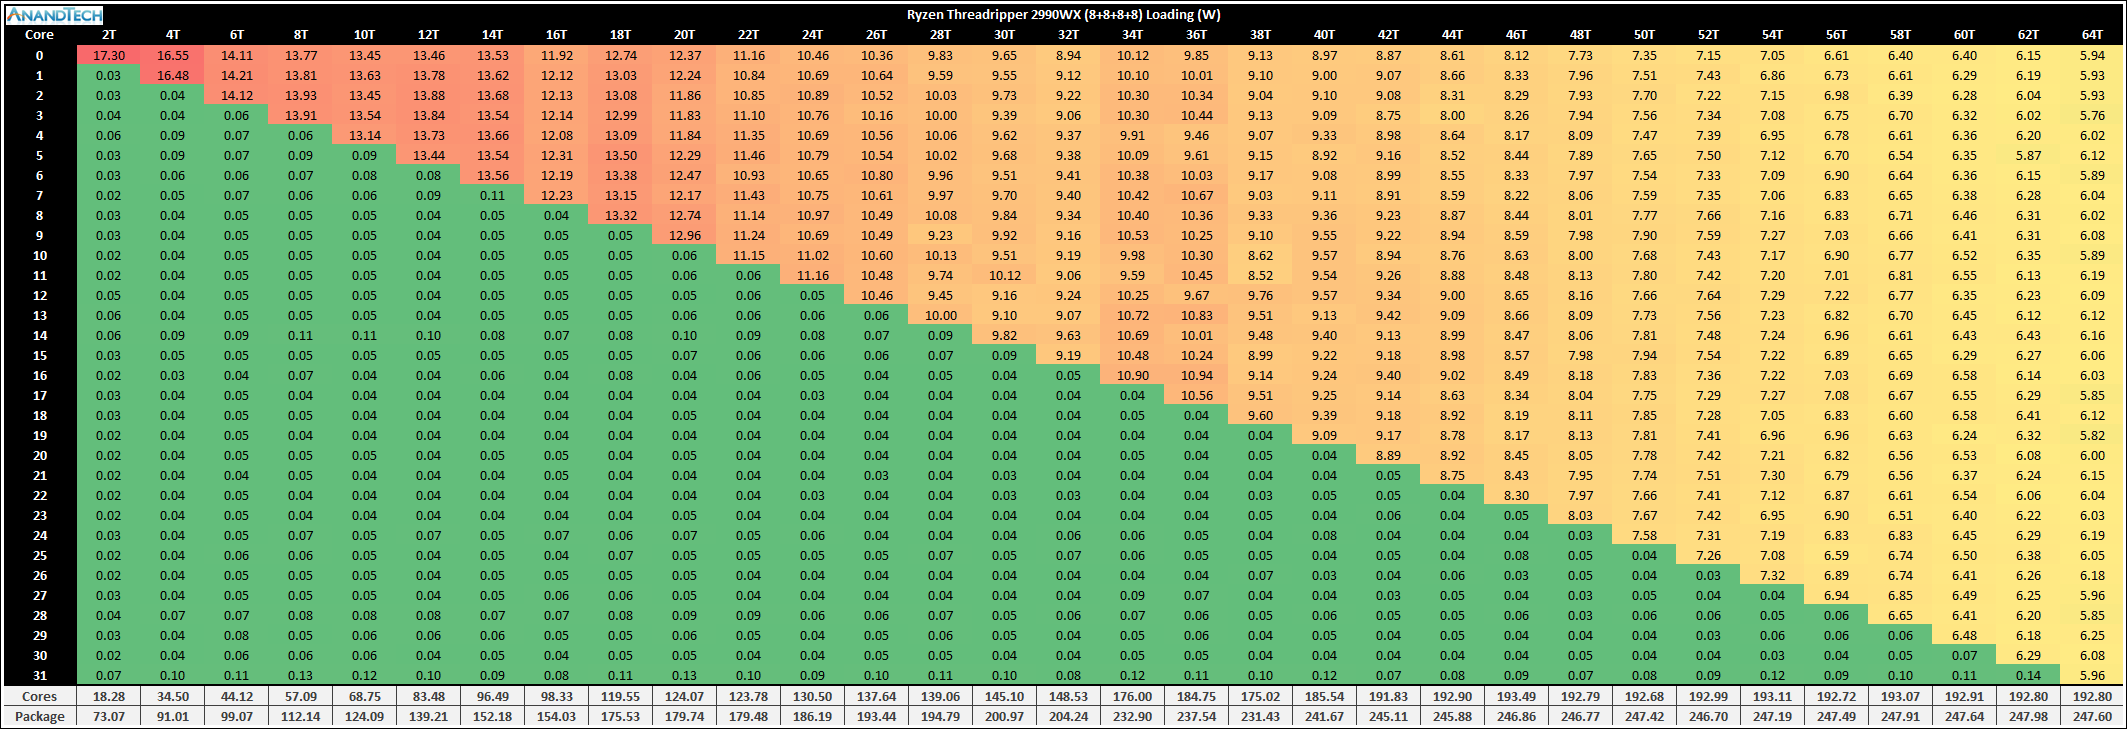
Surprisingly, the load became very evenly distributed as the number of threads was ramped, as we were able to fully use up to the 250W TDP even at stock levels with a good cooler. In the end we were using 193W for the cores and 55W for everything else, and at no point did we see active cores dangling below 3W – in fact when all the cores were loaded, each core seemed to find 6W to be comfortable. We hit the 240W-250W package power at around 40 threads loaded, and beyond that each core added meant the power had to be redistributed.
Two thoughts came to mind – the first was easily verifiable: the BIOS was stuck at 180W power consumption after putting in the 2950X perhaps? I checked and before I did the 2990WX power tests, I previously had had the 1920X in. I did a full BIOS reset, and did not see a change, indicating that this wasn’t a BIOS power limitation.
The second is to look at frequencies. Taking a single data point, 40 threads loaded, there was a slight differential, but only in power.
During the Prime95 test, the first silicon die was running at around 7W per core, and had a frequency of 3575 MHz. The second silicon die was shown at 3W per core, but at 3525 MHz. The other idle cores were at 1775 MHz or 2000 MHz, consuming milliwatts.
During the POV-Ray test, every active core was at around 9.1W per core, and had a frequency of 3575 MHz. All the idle cores were at 2000 MHz (three of which at 1775 MHz), again consuming milliwatts per core.
Aside from the per-core power numbers being reported, the chips seemed overall similar in frequencies, with the POV-Ray test a little higher, which comes through in the total power consumption under POV-Ray being higher.
Ultimately it comes down to this – power reporting with Prime95 beyond 20 cores or so, or on multi-die chips, doesn’t seem to work that well. Going forward we will be using our POV-Ray test, which also seems to draw more power.
Core vs Non-Core Power
Going back to the page where we spoke about Infinity Fabric frequency, we can do a similar plot under the POV-Ray test for the 2990WX.
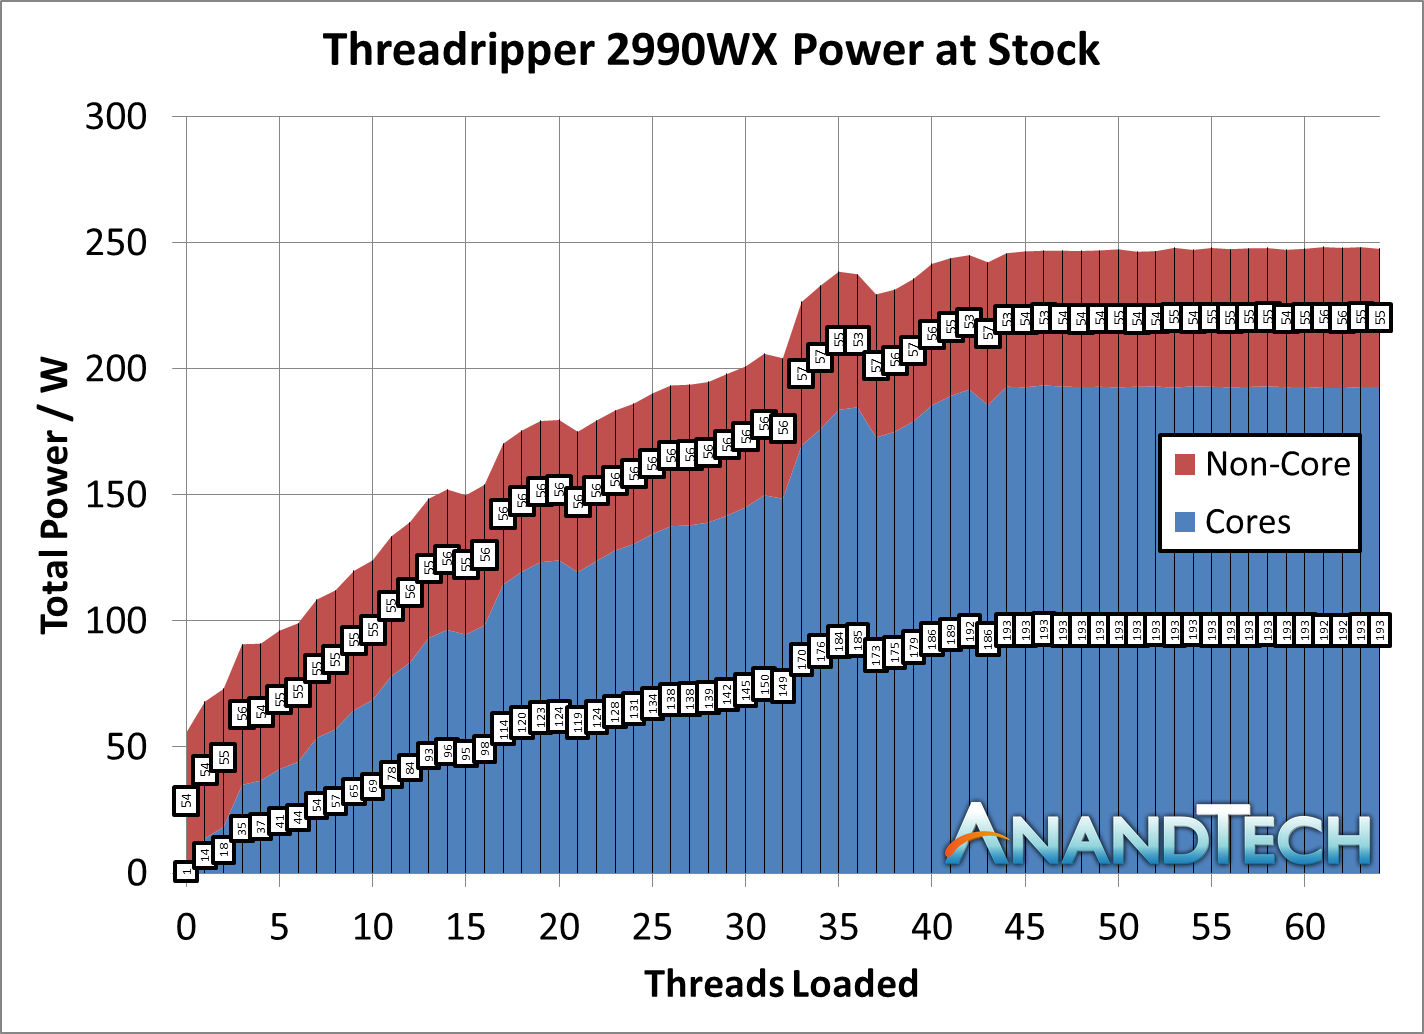
There’s still a good amount of variation in overall loading, with some wobbles, but the data (aside from peak consumption) is broadly in line with our Prime95 test, with the non-core power such as Infinity Fabric consuming 55-60W of the total. As a result we see the non-core power as a percentage of the total power go from 75% with two threads loaded down to 22% by the time 40 threads are loaded.


171 Comments
View All Comments
just4U - Monday, August 13, 2018 - link
Ian, were you testing this with the CM Wraith Cooler? If not is it something you plan to review?Ian Cutress - Monday, August 13, 2018 - link
Most of the testing data is with the Liqtech 240 liquid cooler, rated at 500W. I do have data taken with the Wraith Ripper, and I'll be putting some of that data out when this is wrapped up.IGTrading - Monday, August 13, 2018 - link
To be honest, with the top of the line 32core model, it is interesting to identify as many positive effect cases as possible, to see if that entire set of applications that truly benefit of the added cores will persuade power users to purchase it.Like you've said, it is a niche of a niche and seeing it be X% faster of Y% slower is not as interesting as seeing what it can actually do when it is used efficiently and if this this makes a compelling argument for power users.
PixyMisa - Tuesday, August 14, 2018 - link
Phoronix found that a few tests ran much faster on Linux - for 7zip compression in particular, 140% faster (as in, 2.4x). Some of these benchmarks could improve a lot with some tweaking to the Windows scheduler.phoenix_rizzen - Wednesday, August 15, 2018 - link
It'd be interesting to redo these tests on a monthly basis after Windows/BIOS updates are done, to see how performance changes over time as the Windows side of things is tweaked to support the new NUMA setup for TR2.At the very least, a follow-up benchmark run in 6 months would be nice.
Kevin G - Monday, August 13, 2018 - link
Chiplets!The power consumption figures are interesting but TR does have to manage one thing that the high end desktop chips from Intel don't: off-die traffic. The amount of power to move data off die is significantly higher than moving it around on-die. Even in that context, TR's energy consumption for just the fabric seems high. When only threads are loaded, they should only be with dies with the memory controllers leaving two dies idle. It doesn't appear that the fabric is powering down while those remote dies are also powering down. Any means of watching cores enter/exit sleep states in real time?
I'd also be fun to see with Windows Server what happens when all the cores on a die are unplugged from the system. Consdiering the AMD puts the home agent on the memory controller on each die, even without cores or memory attached, chances are that the home agent is still alive consuming power. It'd be interesting to see what happens on Sky Lake-SP as well if the home agents on the grid eventually power themselves down when there is nothing directly connected to them. It'd be worth comparing to the power consumption when a core is disabled in BIOS/EFI.
I also feel that this would be a good introduction for what is coming down the road with server chips and may reach the high end consumer products: chiplets. This would permit the removal of the off-die Infinity Links for something that is effectively on-die throughout the cluster of dies. That alone will save AMD several watts. The other thing about chiplets is that it would greatly simplify Thread Ripper: only two memory controller chiplets would be to be in the package vs. four as we have now. That should save AMD lots of power. (And for those reading this comment, yes, Intel has chiplet plans as well.). The other thing AMD could do is address how their cache coherency protocols work. AMD has hinted at some caching changes for Zen 2 but lacks specificity.
gagegfg - Monday, August 13, 2018 - link
do not seem to exist more than once the 16 additional core of the 2990wx compared to the 2950xIan Cutress - Monday, August 13, 2018 - link
https://www.anandtech.com/bench/product/2133?vs=21...Chaitanya - Monday, August 13, 2018 - link
Built for scientific workload.woozle341 - Monday, August 13, 2018 - link
Do you think the lack of AVX512 is an issue? I might build a workstation soon for data processing with R and Python for some Fortran models and post-processing. Skylake-X looks pretty good wit its quad memory channels despite its high price.