The AMD Threadripper 2990WX 32-Core and 2950X 16-Core Review
by Dr. Ian Cutress on August 13, 2018 9:00 AM ESTHEDT Benchmarks: Rendering Tests
Rendering is often a key target for processor workloads, lending itself to a professional environment. It comes in different formats as well, from 3D rendering through rasterization, such as games, or by ray tracing, and invokes the ability of the software to manage meshes, textures, collisions, aliasing, physics (in animations), and discarding unnecessary work. Most renderers offer CPU code paths, while a few use GPUs and select environments use FPGAs or dedicated ASICs. For big studios however, CPUs are still the hardware of choice.
Corona 1.3: Performance Render
An advanced performance based renderer for software such as 3ds Max and Cinema 4D, the Corona benchmark renders a generated scene as a standard under its 1.3 software version. Normally the GUI implementation of the benchmark shows the scene being built, and allows the user to upload the result as a ‘time to complete’.
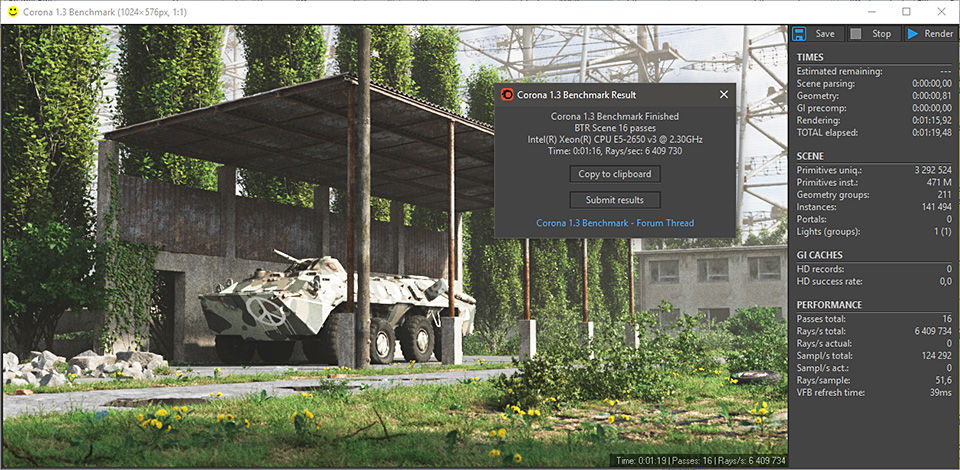
We got in contact with the developer who gave us a command line version of the benchmark that does a direct output of results. Rather than reporting time, we report the average number of rays per second across six runs, as the performance scaling of a result per unit time is typically visually easier to understand.
The Corona benchmark website can be found at https://corona-renderer.com/benchmark
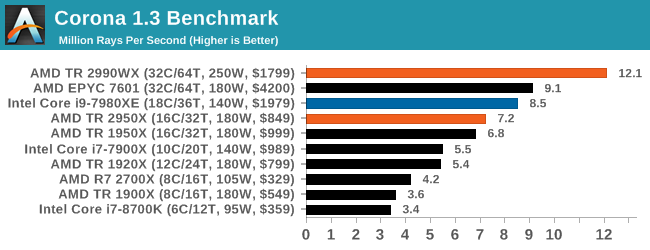
So this is where AMD broke our graphing engine. Because we report Corona in rays per second, having 12 million of them puts eight digits into our engine, which it then tries to interpret as a scientific number (1.2 x 10^7), which it can’t process in a graph. We had to convert this graph into millions of rays per second to get it to work.
The 2990WX hits out in front with 32 cores, with its higher frequency being the main reason it is so far ahead of the EPYC processor. The EPYC and Core i9 are close together, however the TR2950X at half the cost comes reasonably close.
Blender 2.79b: 3D Creation Suite
A high profile rendering tool, Blender is open-source allowing for massive amounts of configurability, and is used by a number of high-profile animation studios worldwide. The organization recently released a Blender benchmark package, a couple of weeks after we had narrowed our Blender test for our new suite, however their test can take over an hour. For our results, we run one of the sub-tests in that suite through the command line - a standard ‘bmw27’ scene in CPU only mode, and measure the time to complete the render.
Blender can be downloaded at https://www.blender.org/download/
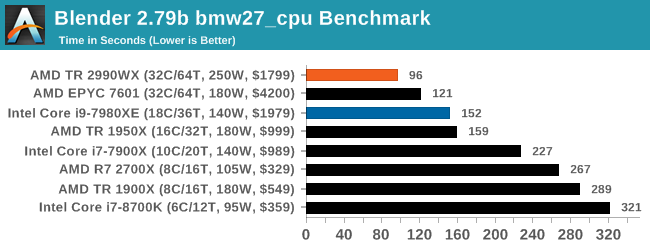
The additional cores on the 2990WX puts it out ahead of the EPYC and Core i9, with the 2990WX having an extra 58% throughput over the Core i9. That is very substantial indeed.
LuxMark v3.1: LuxRender via Different Code Paths
As stated at the top, there are many different ways to process rendering data: CPU, GPU, Accelerator, and others. On top of that, there are many frameworks and APIs in which to program, depending on how the software will be used. LuxMark, a benchmark developed using the LuxRender engine, offers several different scenes and APIs.
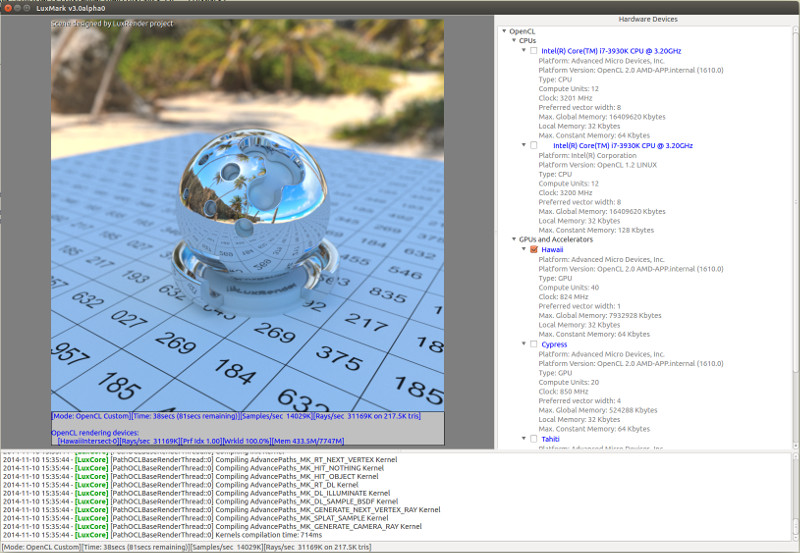
Taken from the Linux Version of LuxMark
In our test, we run the simple ‘Ball’ scene on both the C++ and OpenCL code paths, but in CPU mode. This scene starts with a rough render and slowly improves the quality over two minutes, giving a final result in what is essentially an average ‘kilorays per second’.
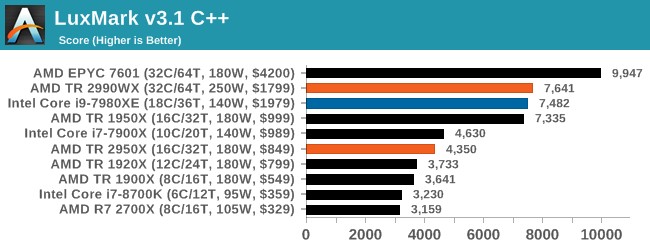
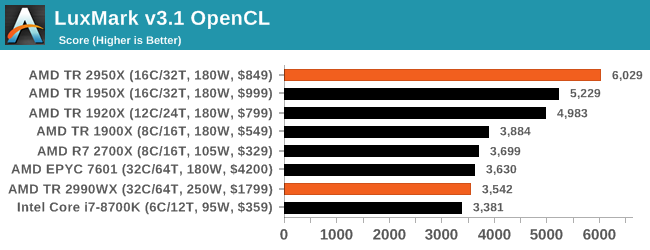
Intel’s Skylake-X processors seem to fail our OpenCL test for some reason, but in the C++ test the extra memory controllers on EPYC sets it ahead of both TR2 and Core i9. The 2990WX and Core i9 are almost equal here.
POV-Ray 3.7.1: Ray Tracing
The Persistence of Vision ray tracing engine is another well-known benchmarking tool, which was in a state of relative hibernation until AMD released its Zen processors, to which suddenly both Intel and AMD were submitting code to the main branch of the open source project. For our test, we use the built-in benchmark for all-cores, called from the command line.
POV-Ray can be downloaded from http://www.povray.org/
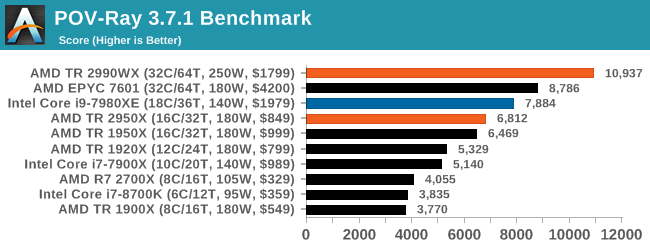
This test is another that loves the cores and frequency of the 2990WX, finishing the benchmark in almost 20 seconds. It might be time for a bigger built-in benchmark.


171 Comments
View All Comments
jospoortvliet - Saturday, August 18, 2018 - link
https://www.phoronix.com/scan.php?page=article&... has some.nul0b - Monday, August 13, 2018 - link
Ian please define how exactly you're calculating and deriving uncore and IF power utilization.alpha754293 - Monday, August 13, 2018 - link
I vote that from now on, all of the CPU reviews should be like this.Just raw data.
Lolimaster - Monday, August 13, 2018 - link
To resume:Intel's TDP is a blatant lie, it barely keeps at TDP at 6c/6t, meanwhile AMD stick on point or below TDP with their chips, boost included :D
Lolimaster - Monday, August 13, 2018 - link
Selling more shares from $1.65 now to $19 :DAMD Threadripper 2, ripping the blue hole.
Lolimaster - Monday, August 13, 2018 - link
It seems geekbench can't scale beyond 16cores.Lolimaster - Monday, August 13, 2018 - link
WHERE IS CINEBENCH?Lolimaster - Monday, August 13, 2018 - link
And I mean CB15Also, for some reason CB11.5 MT seems to be broken for TR, it stops caling at 12cores.
mapesdhs - Monday, August 13, 2018 - link
CB R15 is suffering issues aswell these days, at this level it can exhibit huge variance from one run to another.eastcoast_pete - Monday, August 13, 2018 - link
Thanks Ian, great article, look forward to seeing the full final version!My conclusions: All these are workstation processors, NOT for gaming; the Ryzen 2700X and the upcoming Intel octacore 9000 series are/will be better for gaming, both in value for money and absolute performance. That being said, the TR 2950X could be a great choice, if your productivity software can make good use of the 16 cores/32 threads, and if that same software isn't written to make strong use of AVX 512. If the applications that you buy these monsters can make heavy use of AVX 512, Intel's chips are currently hard or impossible to beat, even at the same price point. That being said, a 2950X workstation with 128 or 256 Gb of RAM (in quad channel, of course), plus some fast PCIe/NVMe SSDs and a big & fast graphics card would make an awesome video editing setup; and, the 60 PCIe channels would come in really handy for add-in boards. One fly in the ointment: AMD, since you're hamstringing TR with only quad-channel, at least let us use faster DDR4; how about officially supporting > 3.2 Ghz?
Unrelated: Love the testing setup where the system storage SSD ( 1TB) is the same size as the working memory (1 TB). With one of these, you know you're in the heavyweight division.
@Ian: I also really appreciate the testing of power draws by cores vs. interconnecting fabric. I also believe (as you wrote) that this is a much underappreciated hurdle in simply escalating the number of cores. I also wonder a. How is that affecting ARM-based multicore chips, especially once we are talking 32 cores and up, as for the chips intended for servers? and b. Is that one of the reasons (or THE reason) why ARM-based manycore solutions have not been getting much traction, and why companies like Qualcomm have stopped their development? Yes, the cores might be very efficient, but if those power savings are being gobbled up by the interconnects, fewer but broader and deeper cores might still end up winning the performance/wh race.
If you and/or Ryan (or any of your colleagues) could do a deep dive into the general issue of power use by the interconnecting fabric and the different architectures, I would really appreciate it.