The Intel SSD 660p SSD Review: QLC NAND Arrives For Consumer SSDs
by Billy Tallis on August 7, 2018 11:00 AM ESTPower Management Features
Real-world client storage workloads leave SSDs idle most of the time, so the active power measurements presented earlier in this review only account for a small part of what determines a drive's suitability for battery-powered use. Especially under light use, the power efficiency of a SSD is determined mostly be how well it can save power when idle.
For many NVMe SSDs, the closely related matter of thermal management can also be important. M.2 SSDs can concentrate a lot of power in a very small space. They may also be used in locations with high ambient temperatures and poor cooling, such as tucked under a GPU on a desktop motherboard, or in a poorly-ventilated notebook.
| Intel SSD 660p 1TB NVMe Power and Thermal Management Features |
|||
| Controller | Silicon Motion SM2263 | ||
| Firmware | NHF034C | ||
| NVMe Version |
Feature | Status | |
| 1.0 | Number of operational (active) power states | 3 | |
| 1.1 | Number of non-operational (idle) power states | 2 | |
| Autonomous Power State Transition (APST) | Supported | ||
| 1.2 | Warning Temperature | 77°C | |
| Critical Temperature | 80°C | ||
| 1.3 | Host Controlled Thermal Management | Supported | |
| Non-Operational Power State Permissive Mode | Not Supported | ||
The Intel SSD 660p's power and thermal management feature set is typical for current-generation NVMe SSDs. The rated exit latency from the deepest idle power state is quite a bit faster than what we have measured in practice from this generation of Silicon Motion controllers, but otherwise the drive's claims about its idle states seem realistic.
| Intel SSD 660p 1TB NVMe Power States |
|||||
| Controller | Silicon Motion SM2263 | ||||
| Firmware | NHF034C | ||||
| Power State |
Maximum Power |
Active/Idle | Entry Latency |
Exit Latency |
|
| PS 0 | 4.0 W | Active | - | - | |
| PS 1 | 3.0 W | Active | - | - | |
| PS 2 | 2.2 W | Active | - | - | |
| PS 3 | 30 mW | Idle | 5 ms | 5 ms | |
| PS 4 | 4 mW | Idle | 5 ms | 9 ms | |
Note that the above tables reflect only the information provided by the drive to the OS. The power and latency numbers are often very conservative estimates, but they are what the OS uses to determine which idle states to use and how long to wait before dropping to a deeper idle state.
Idle Power Measurement
SATA SSDs are tested with SATA link power management disabled to measure their active idle power draw, and with it enabled for the deeper idle power consumption score and the idle wake-up latency test. Our testbed, like any ordinary desktop system, cannot trigger the deepest DevSleep idle state.
Idle power management for NVMe SSDs is far more complicated than for SATA SSDs. NVMe SSDs can support several different idle power states, and through the Autonomous Power State Transition (APST) feature the operating system can set a drive's policy for when to drop down to a lower power state. There is typically a tradeoff in that lower-power states take longer to enter and wake up from, so the choice about what power states to use may differ for desktop and notebooks.
We report two idle power measurements. Active idle is representative of a typical desktop, where none of the advanced PCIe link or NVMe power saving features are enabled and the drive is immediately ready to process new commands. The idle power consumption metric is measured with PCIe Active State Power Management L1.2 state enabled and NVMe APST enabled if supported.
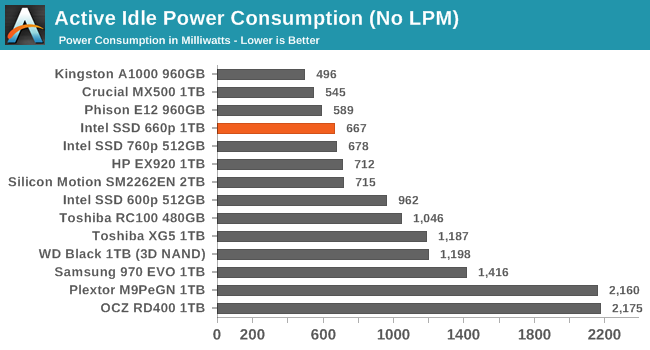
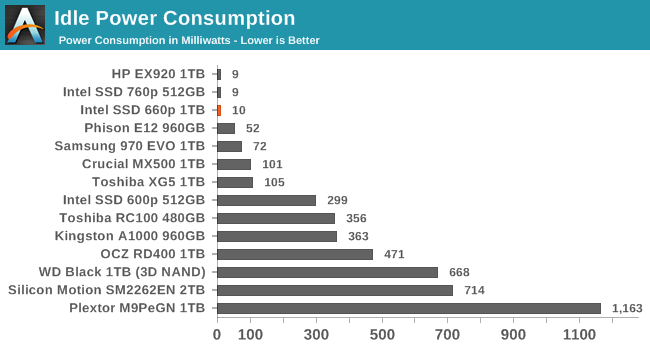
The Intel 660p has a slightly lower active idle power draw than the SM2262-based drives we've tested, thanks to the smaller controller and reduced DRAM capacity. It isn't the lowest active idle power we've measured from a NVMe SSD, but it is definitely better than most high-end NVMe drives. In the deepest idle state our desktop testbed can use, we measure an excellent 10mW draw.
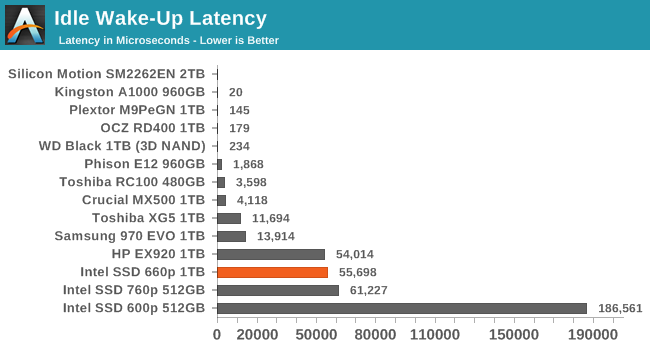
The Intel 660p's idle wake-up time of about 55ms is typical for Silicon Motion's current generation of controllers and much better than their first-generation NVMe controller as used in the Intel SSD 600p. The Phison E12 can wake up in under 2ms from a sleep state of about 52mW, but otherwise the NVMe SSDs that wake up quickly were saving far less power than the 660p's deep idle.


86 Comments
View All Comments
woggs - Tuesday, August 7, 2018 - link
2D nand was abandoned because it squeezed the storage element down to a size where it became infeasible to scale further and still store data reliably. The move to 3D nand took back the needed size of the memory element to store more charge. Cost reduction from scaling is no longer reliant directly on the reduction of the storage element. This is a key enabler for TLC and QLC.woggs - Tuesday, August 7, 2018 - link
Stated another way... Scaling 2D flash cells proportionally reduced the stored charge available to divide up into multiple levels, making any number of bits per cell proportionally more difficult. The the question of cost reduction was which is faster and cheaper: scale the cell to smaller size or deliver more bits/cell? 2 bits per cell was achievable fast enough to justify it's use for cost reduction in parallel with process scaling, which was taking 18 to 24 months a pop. TLC was achievable on 2D nodes (not the final ones) but not before the next process node would be available. 3D has completely changed the scaling game and makes more bits per cell feasible, with less degradation in the ability to deliver as the process scales. The early 3D nodes "weren't very good" because they were the first 3D nodes going through the new learning curve.PeachNCream - Tuesday, August 7, 2018 - link
Interesting performance measurements. Variable size pseudo-SLC really helps to cover up the QLC performance penalties which look pretty scary when the drive is mostly full. The .1 DWPD rating is bad, but typical consumers aren't likely to thrash a drive with that many writes on a daily basis though Anandtech's weighty benchmarks ate up 1% of the total rated endurance in what is a comparable blink of an eye in the overall life of a storage device.In the end, I don't think there's a value proposition in owning such the 660p in specific if you're compelled to leave a substantial chunk of the drive in an empty state so the performance doesn't rapidly decline. In effect, the buyer is purchasing more capacity than required to retain performance so why not just purchase a TLC or MLC drive and suffer less performance loss and therefore gain more usable space?
Oxford Guy - Tuesday, August 7, 2018 - link
The 840's TLC degraded performance because of falling voltages, not because of anyone "thrashing" the drive.However, it is also true that the performance of the 120 GB drive was appalling in steady state.
mapesdhs - Wednesday, August 8, 2018 - link
Again, 840 EVO; few sites covered the standard 840, there's not much data. I think it does suffer from the same issue, but most media coverage was about the EVO version.Spunjji - Wednesday, August 8, 2018 - link
It does suffer from the same problem. It wasn't fixed. Not sure why Oxford *keeps* bringing it up in response to unrelated comments, though.Oxford Guy - Friday, August 10, 2018 - link
The point is that there is more to SSD reliability than endurance ratings.Oxford Guy - Friday, August 10, 2018 - link
"few sites covered the standard 840"The 840 got a lot of hype and sales.
FunBunny2 - Tuesday, August 7, 2018 - link
with regard to power-off retention: is a stat estimation from existing USB sticks (on whatever node) and such, meaningful? whether or not, what might be the prediction?milkywayer - Tuesday, August 7, 2018 - link
My question is, should I truest this drive with valuable info if endurance can be an issue?If the PC is frequently powered On, will it refresh the cells?