The Intel SSD 660p SSD Review: QLC NAND Arrives For Consumer SSDs
by Billy Tallis on August 7, 2018 11:00 AM ESTSequential Read Performance
Our first test of sequential read performance uses short bursts of 128MB, issued as 128kB operations with no queuing. The test averages performance across eight bursts for a total of 1GB of data transferred from a drive containing 16GB of data. Between each burst the drive is given enough idle time to keep the overall duty cycle at 20%.
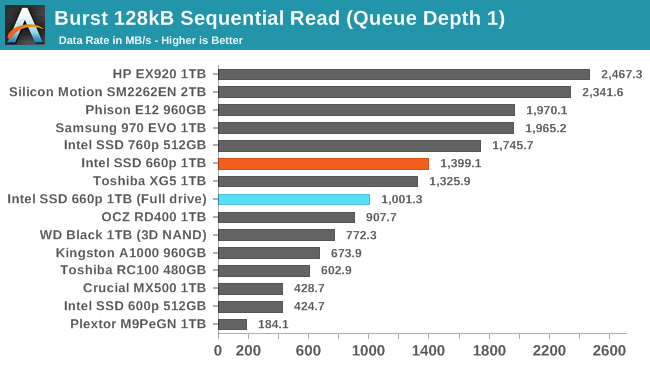
The burst sequential read performance of the Intel SSD 660p is lower than several of the fastest high-end drives, but is still pretty quick given the 4-channel controller used by the 660p. The read speed is only moderately impaired after filling the drive all the way.
Our test of sustained sequential reads uses queue depths from 1 to 32, with the performance and power scores computed as the average of QD1, QD2 and QD4. Each queue depth is tested for up to one minute or 32GB transferred, from a drive containing 64GB of data. This test is run twice: once with the drive prepared by sequentially writing the test data, and again after the random write test has mixed things up, causing fragmentation inside the SSD that isn't visible to the OS. These two scores represent the two extremes of how the drive would perform under real-world usage, where wear leveling and modifications to some existing data will create some internal fragmentation that degrades performance, but usually not to the extent shown here.
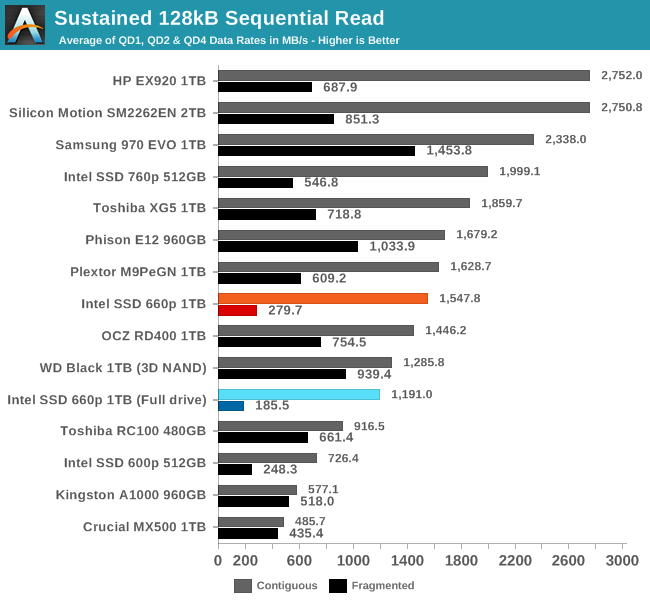
On the longer sequential read test that goes beyond QD1, the true high-end NVMe drives pull away from the 660p but it is still faster than most other low-end NVMe SSDs. Internal fragmentation is more of a problem for the 660p than the TLC drives, but this is not too surprising—the QLC NAND is likely using larger page and block sizes that add to the overhead of gathering data that has been dispersed by wear leveling during random writes.
 |
|||||||||
| Power Efficiency in MB/s/W | Average Power in W | ||||||||
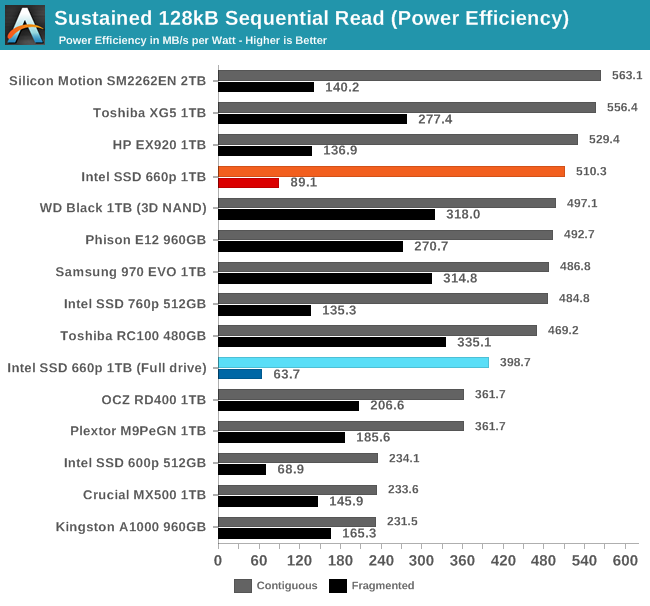
The power efficiency of sequential reads from the 660p is competitive with many of the best TLC SSDs, and isn't too far behind even after filling the drive all the way.
 |
|||||||||
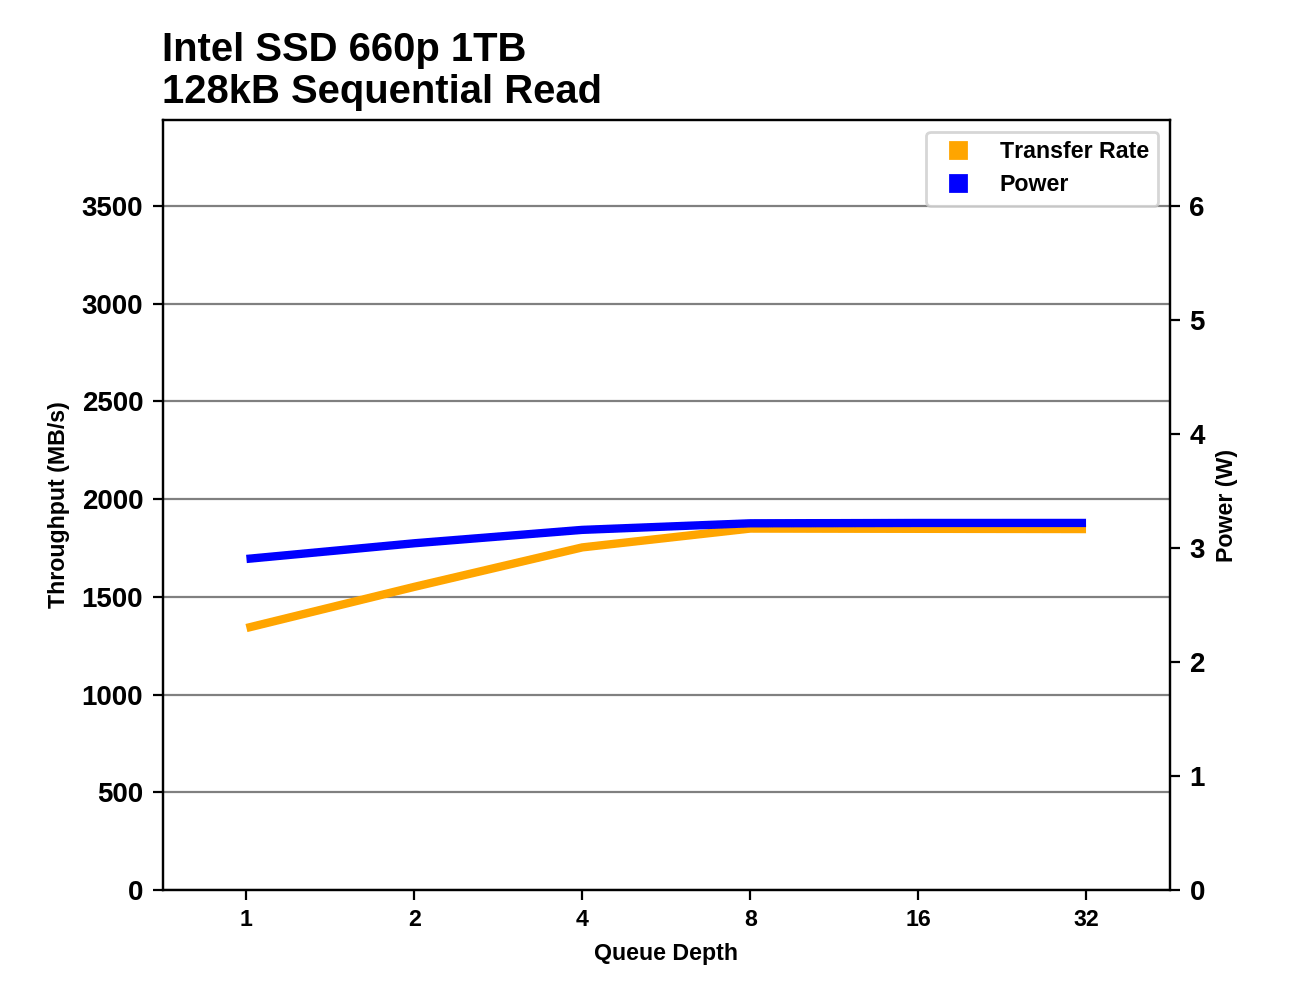
The 660p doesn't reach its maximum sequential read speed until around QD8, but it was already pretty quick at QD1 so the overall growth is relatively small.
Sequential Write Performance
Our test of sequential write burst performance is structured identically to the sequential read burst performance test save for the direction of the data transfer. Each burst writes 128MB as 128kB operations issued at QD1, for a total of 1GB of data written to a drive containing 16GB of data.
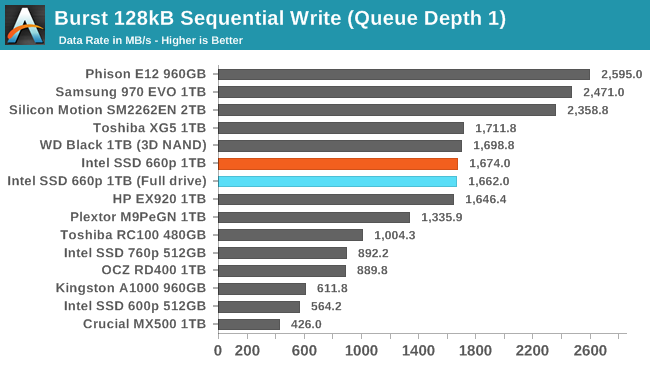
The burst sequential write test only hits the SLC write cache even when the Intel SSD 660p is completely full, so it performs comparably to many high-end NVMe drives.
Our test of sustained sequential writes is structured identically to our sustained sequential read test, save for the direction of the data transfers. Queue depths range from 1 to 32 and each queue depth is tested for up to one minute or 32GB, followed by up to one minute of idle time for the drive to cool off and perform garbage collection. The test is confined to a 64GB span of the drive.
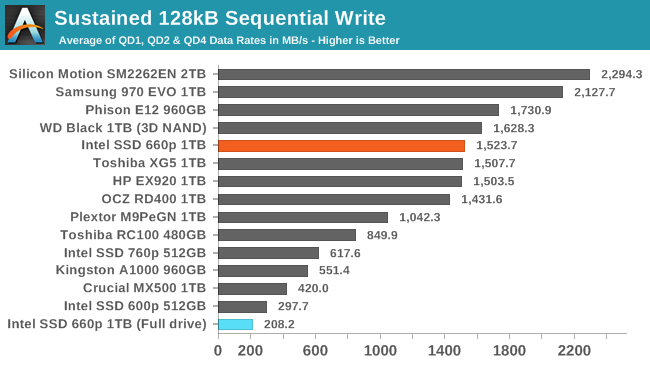
Our usual test conditions of a mostly-empty drive mean that the 660p's score on the sustained sequential write test reflects only writes to the SLC cache at its largest configuration. When the drive is full and the SLC cache has shrunk to just 12GB, the test quickly fills that cache and performance drops to last place.
 |
|||||||||
| Power Efficiency in MB/s/W | Average Power in W | ||||||||
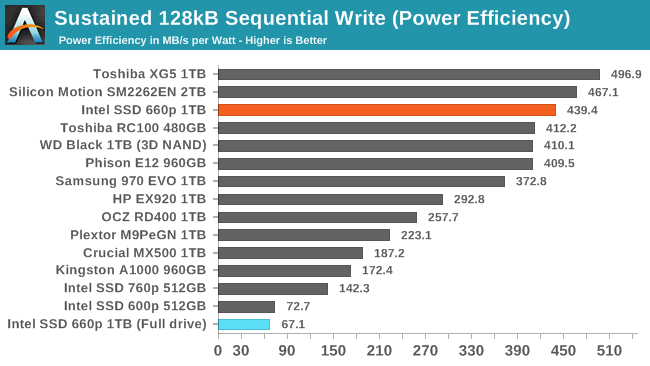
The power efficiency of the 660p when writing sequentially to the SLC cache is excellent, but it ends up slightly worse off than the 600p when the drive is full and the SLC cache is too small.
 |
|||||||||
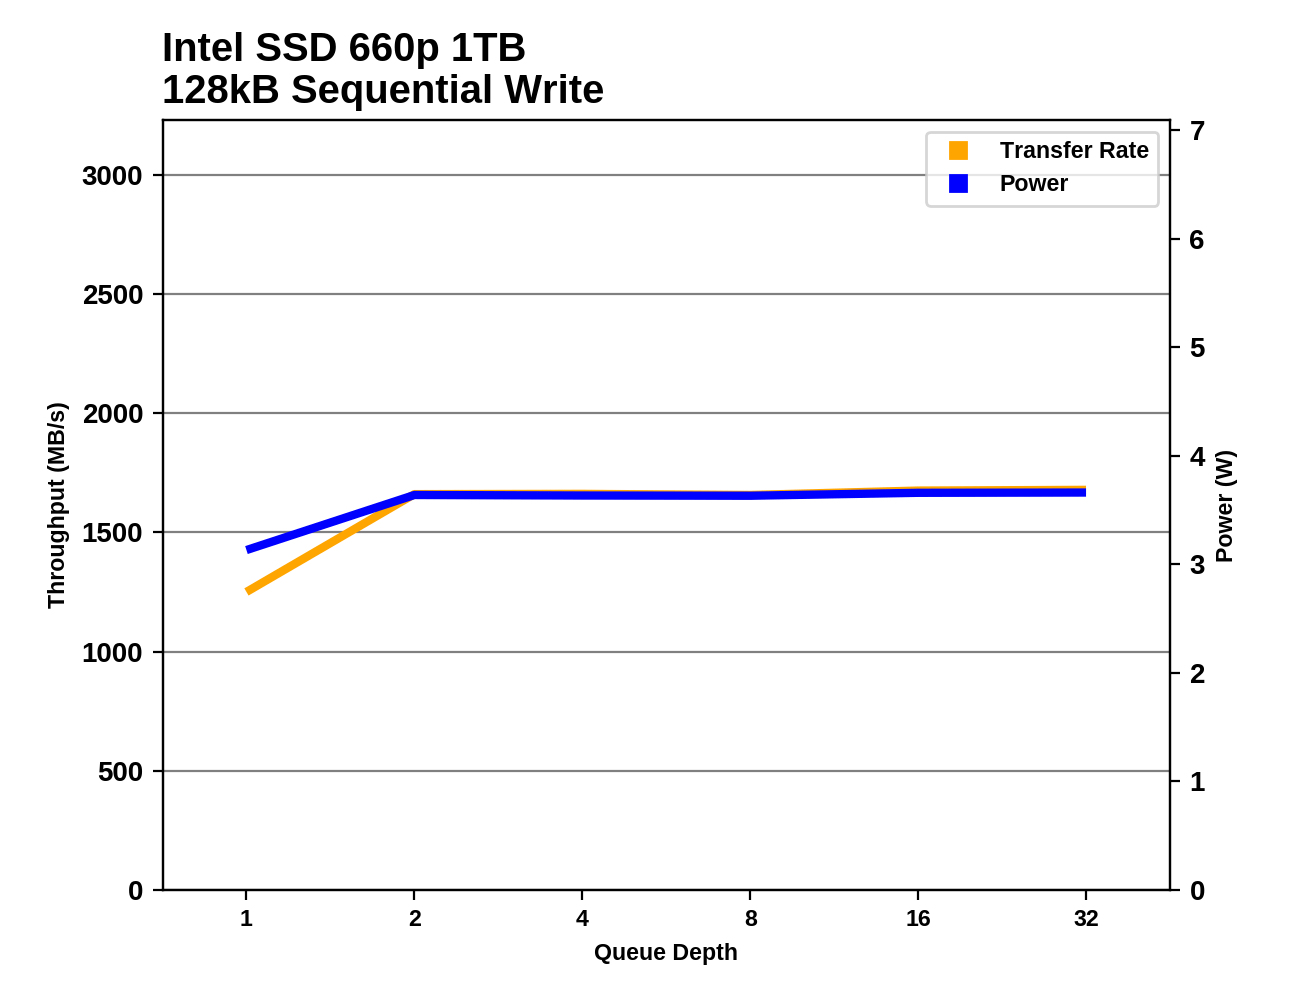
The 660p reaches its maximum sequential write speed at QD2 and maintains it for the rest of the test, showing that the drive is largely keeping up with flushing the SLC write cache during the idle phases of the test.


86 Comments
View All Comments
woggs - Tuesday, August 7, 2018 - link
2D nand was abandoned because it squeezed the storage element down to a size where it became infeasible to scale further and still store data reliably. The move to 3D nand took back the needed size of the memory element to store more charge. Cost reduction from scaling is no longer reliant directly on the reduction of the storage element. This is a key enabler for TLC and QLC.woggs - Tuesday, August 7, 2018 - link
Stated another way... Scaling 2D flash cells proportionally reduced the stored charge available to divide up into multiple levels, making any number of bits per cell proportionally more difficult. The the question of cost reduction was which is faster and cheaper: scale the cell to smaller size or deliver more bits/cell? 2 bits per cell was achievable fast enough to justify it's use for cost reduction in parallel with process scaling, which was taking 18 to 24 months a pop. TLC was achievable on 2D nodes (not the final ones) but not before the next process node would be available. 3D has completely changed the scaling game and makes more bits per cell feasible, with less degradation in the ability to deliver as the process scales. The early 3D nodes "weren't very good" because they were the first 3D nodes going through the new learning curve.PeachNCream - Tuesday, August 7, 2018 - link
Interesting performance measurements. Variable size pseudo-SLC really helps to cover up the QLC performance penalties which look pretty scary when the drive is mostly full. The .1 DWPD rating is bad, but typical consumers aren't likely to thrash a drive with that many writes on a daily basis though Anandtech's weighty benchmarks ate up 1% of the total rated endurance in what is a comparable blink of an eye in the overall life of a storage device.In the end, I don't think there's a value proposition in owning such the 660p in specific if you're compelled to leave a substantial chunk of the drive in an empty state so the performance doesn't rapidly decline. In effect, the buyer is purchasing more capacity than required to retain performance so why not just purchase a TLC or MLC drive and suffer less performance loss and therefore gain more usable space?
Oxford Guy - Tuesday, August 7, 2018 - link
The 840's TLC degraded performance because of falling voltages, not because of anyone "thrashing" the drive.However, it is also true that the performance of the 120 GB drive was appalling in steady state.
mapesdhs - Wednesday, August 8, 2018 - link
Again, 840 EVO; few sites covered the standard 840, there's not much data. I think it does suffer from the same issue, but most media coverage was about the EVO version.Spunjji - Wednesday, August 8, 2018 - link
It does suffer from the same problem. It wasn't fixed. Not sure why Oxford *keeps* bringing it up in response to unrelated comments, though.Oxford Guy - Friday, August 10, 2018 - link
The point is that there is more to SSD reliability than endurance ratings.Oxford Guy - Friday, August 10, 2018 - link
"few sites covered the standard 840"The 840 got a lot of hype and sales.
FunBunny2 - Tuesday, August 7, 2018 - link
with regard to power-off retention: is a stat estimation from existing USB sticks (on whatever node) and such, meaningful? whether or not, what might be the prediction?milkywayer - Tuesday, August 7, 2018 - link
My question is, should I truest this drive with valuable info if endurance can be an issue?If the PC is frequently powered On, will it refresh the cells?