The Intel SSD 660p SSD Review: QLC NAND Arrives For Consumer SSDs
by Billy Tallis on August 7, 2018 11:00 AM ESTMixed Random Performance
Our test of mixed random reads and writes covers mixes varying from pure reads to pure writes at 10% increments. Each mix is tested for up to 1 minute or 32GB of data transferred. The test is conducted with a queue depth of 4, and is limited to a 64GB span of the drive. In between each mix, the drive is given idle time of up to one minute so that the overall duty cycle is 50%.
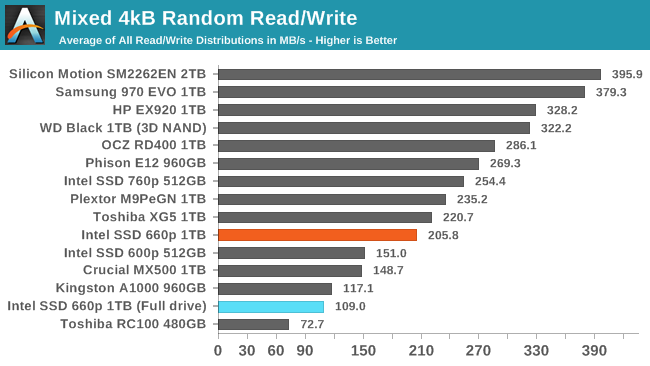
The mixed random I/O performance of the Intel SSD 660p is clearly above the other low-end NVMe drives we've tested, or the Crucial MX500 SATA drive. It scores closer to a mid-range NVMe SSD. After filling the drive, performance is cut in half, leaving it performing near low-end NVMe drives like the Phison E8-based Kingston A1000 and below the MX500.
 |
|||||||||
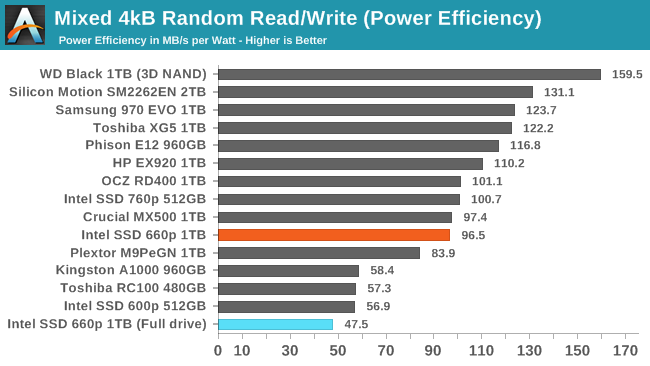
| Power Efficiency in MB/s/W | Average Power in W | ||||||||
The power efficiency of the 660p during the mixed random I/O test is unimpressive but doesn't stand out as being significantly worse that other low-end NVMe drives even when the test is run on a full drive.
 |
|||||||||
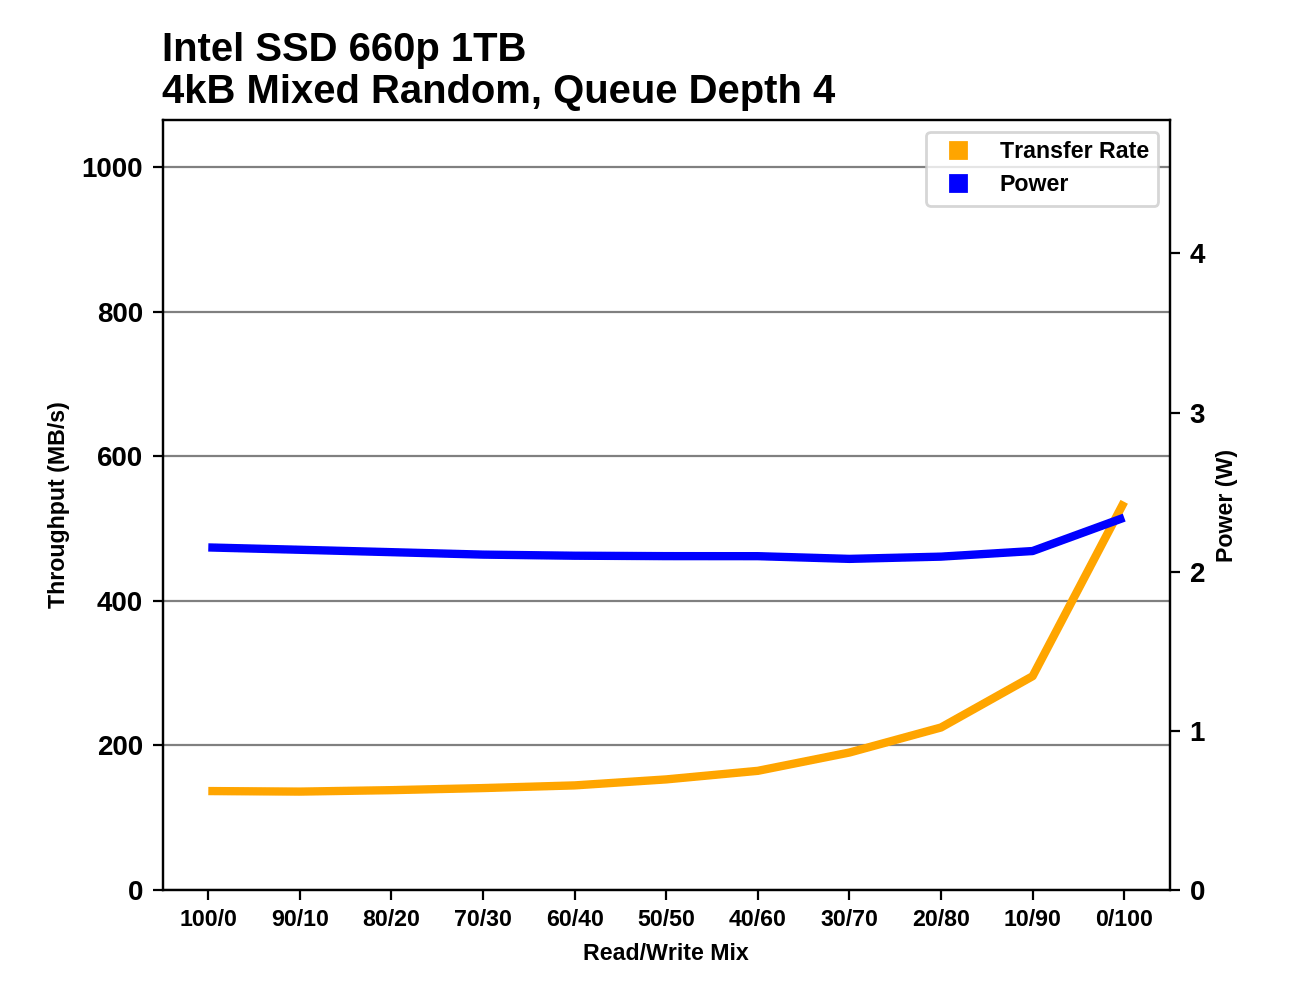
The Intel SSD 660p shows very slow performance growth throughout most of the test, but it picks up speed reasonably well toward the end as the workload shifts toward pure writes, and the SLC cache handles things well. When the drive is full, the reduced capacity of the SLC cache prevents speed from increasing much.
Mixed Sequential Performance
Our test of mixed sequential reads and writes differs from the mixed random I/O test by performing 128kB sequential accesses rather than 4kB accesses at random locations, and the sequential test is conducted at queue depth 1. The range of mixes tested is the same, and the timing and limits on data transfers are also the same as above.
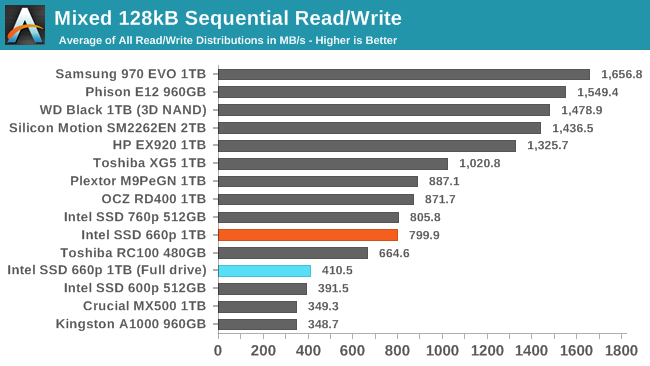
The Intel SSD 660p performs better than other entry-level NVMe SSDs or SATA drives when the mixed sequential I/O test is run on a mostly empty drive with a large SLC cache. After the drive is filled, performance drops down to slightly ahead of the 600p and Crucial MX500.
 |
|||||||||
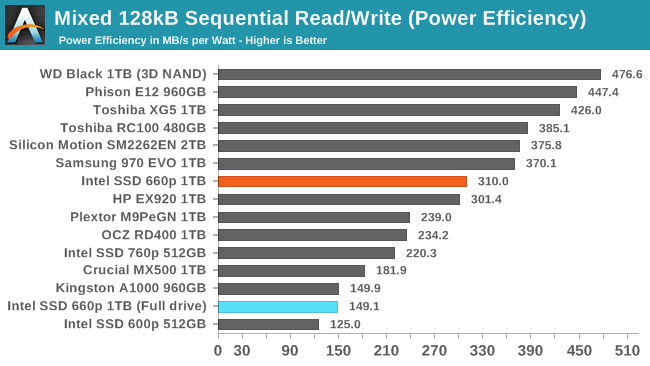
| Power Efficiency in MB/s/W | Average Power in W | ||||||||
The power efficiency of the Intel SSD 660p during the mixed sequential I/O test is decent when operating entirely out of the SLC cache, and on par with most other low-end NVMe drives when the 660p is full.
 |
|||||||||
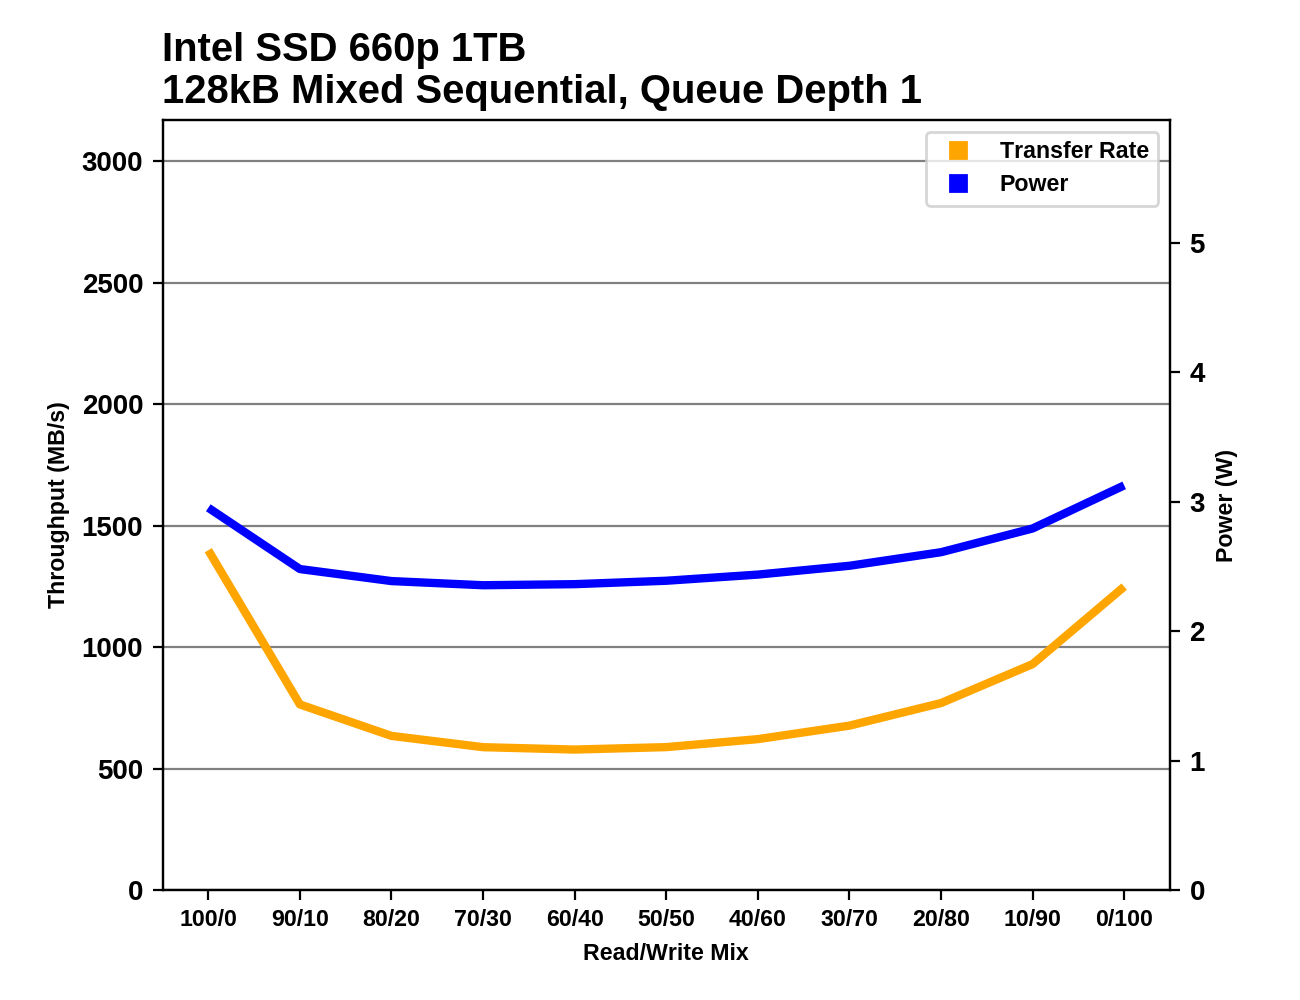
When the test is run on a mostly-empty 660p the performance shows a very typical bathtub curve and no sign of the SLC cache running out. When the drive is full, performance decreases steadily as the proportion of writes increases.


86 Comments
View All Comments
StrangerGuy - Tuesday, August 7, 2018 - link
"I am a TRUE PROFESSIONAL who can't pay more endurance for my EXTREME SSD WORKLOADS by either from my employer or by myself, I'm the poor 0.01% who is being oppressed by QLC!"Oxford Guy - Tuesday, August 7, 2018 - link
Memes didn't make the IBM Deathstar drives fun and games.StrangerGuy - Tuesday, August 7, 2018 - link
I'm sure you were the true prophetic one warning us about those crappy those 75GXPs before they were released, oh wait.I'm sorry why are you here and why should anyone listen to you again?
Oxford Guy - Tuesday, August 7, 2018 - link
Memes and trolling may be entertaining but this isn't really the place for it.jjj - Tuesday, August 7, 2018 - link
Not bad, at least for now when there are no QLC competitors.The pressure QLC will put on HDDs is gonna be interesting too.
damianrobertjones - Tuesday, August 7, 2018 - link
These drives will fill the bottom end... allowing the mid and high tiers to increase in price. Usual.Valantar - Wednesday, August 8, 2018 - link
Only if the performance difference is large enough to make them worth it - which it isn't, at least in this case. While the advent of TLC did push MLC prices up (mainly due to reduced production and sales volume), it seems unlikely for the same to happen here, as these drives aim for a market segment that has so far been largely unoccupied. (It's also worth mentioning here that silicon prices have been rising for quite a while, and also affects this.) There are a few TLC drives in the same segment, but those are also quite bad. This, on the other hand, competes with faster drives unless you fill it or the SLC cache. In other words, higher-end drives will have to either aim for customers with heavier workloads (which might imply higher prices, but would also mean optimizations for non-consumer usage scenarios) or push prices lower to compete.romrunning - Wednesday, August 8, 2018 - link
Well, QLC will slowly push out TLC, which was already pushing out MLC. It's not just pushing the prices of MLC/TLC up, mfgs are slowing phasing those lines out entirely. So even if I want a specific type, I may not be able to purchase it in consumerspace (maybe enterprise, with the resultant price hit).I hate that we're getting lower-performing items for the cheaper price - I'd rather get higher-performing at cheaper prices! :)
rpg1966 - Tuesday, August 7, 2018 - link
"In the past year, the deployment of 64-layer 3D NAND flash has allowed almost all of the SSD industry to adopt three bit per cell TLC flash"What does this mean? n-layer NAND isn't a requirement for TLC is it?
Ryan Smith - Tuesday, August 7, 2018 - link
3D NAND is not a requirement for TLC. However most of the 32/48 layer processes weren't very good, resulting in poorly performing TLC NAND. The 64 layer stuff has turned out much better, finally making TLC viable from all manufacturers.