The Intel Core i7-8086K Review
by Ian Cutress on June 11, 2018 8:00 AM EST- Posted in
- CPUs
- Intel
- Core i7
- Anniversary
- Coffee Lake
- i7-8086K
- 5 GHz
- 8086K
- 5.0 GHz
Benchmarking Performance: CPU Legacy Tests
Our legacy tests represent benchmarks that were once at the height of their time. Some of these are industry standard synthetics, and we have data going back over 10 years. All of the data here has been rerun on Windows 10, and we plan to go back several generations of components to see how performance has evolved.
All of our benchmark results can also be found in our benchmark engine, Bench.
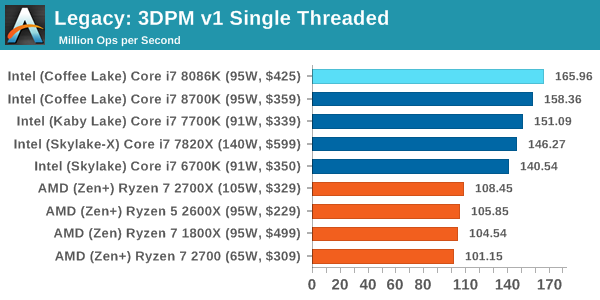
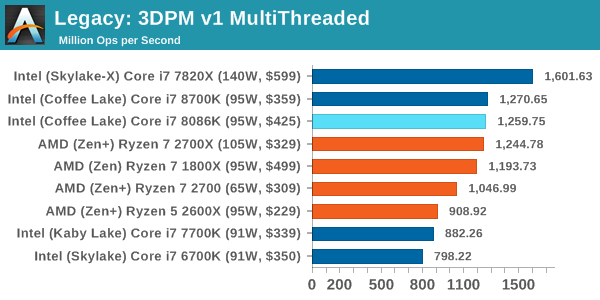
3D Particle Movement v1
3DPM is a self-penned benchmark, taking basic 3D movement algorithms used in Brownian Motion simulations and testing them for speed. High floating point performance, MHz and IPC wins in the single thread version, whereas the multithread version has to handle the threads and loves more cores. This is the original version, written in the style of a typical non-computer science student coding up an algorithm for their theoretical problem, and comes without any non-obvious optimizations not already performed by the compiler, such as false sharing.
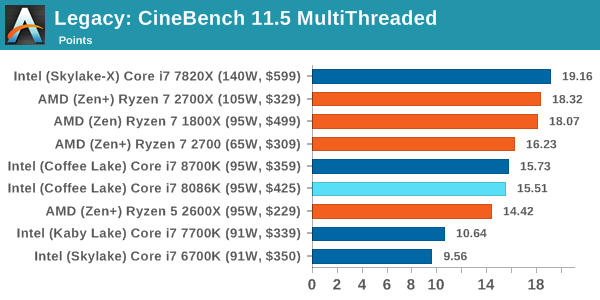
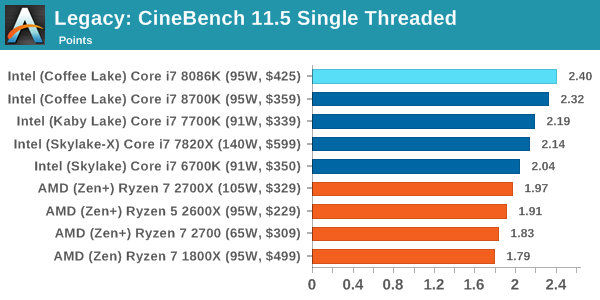
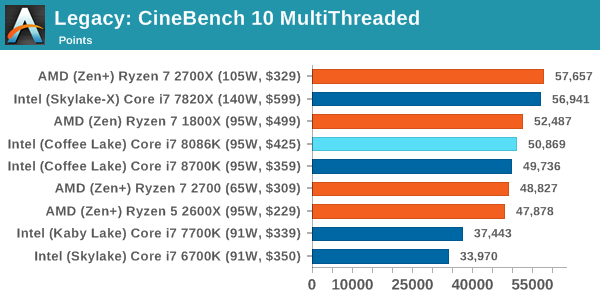
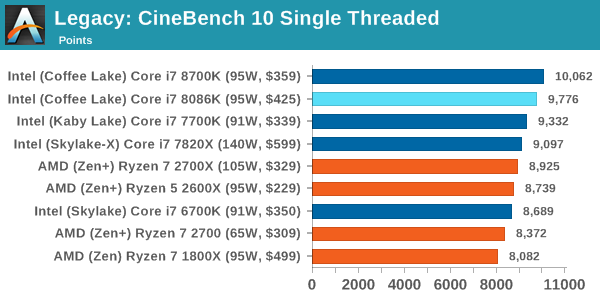
CineBench 11.5 and 10
Cinebench is a widely known benchmarking tool for measuring performance relative to MAXON's animation software Cinema 4D. Cinebench has been optimized over a decade and focuses on purely CPU horsepower, meaning if there is a discrepancy in pure throughput characteristics, Cinebench is likely to show that discrepancy. Arguably other software doesn't make use of all the tools available, so the real world relevance might purely be academic, but given our large database of data for Cinebench it seems difficult to ignore a small five minute test. We run the modern version 15 in this test, as well as the older 11.5 and 10 due to our back data.
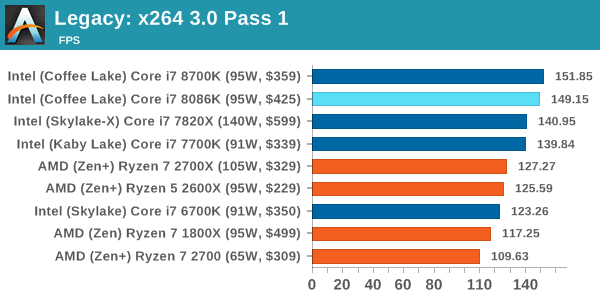
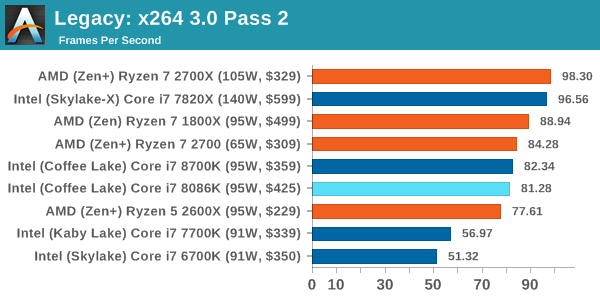
x264 HD 3.0
Similarly, the x264 HD 3.0 package we use here is also kept for historic regressional data. The latest version is 5.0.1, and encodes a 1080p video clip into a high quality x264 file. Version 3.0 only performs the same test on a 720p file, and in most circumstances the software performance hits its limit on high end processors, but still works well for mainstream and low-end. Also, this version only takes a few minutes, whereas the latest can take over 90 minutes to run.


111 Comments
View All Comments
peevee - Monday, June 11, 2018 - link
8086 being slower than 8700 just indicates an error in your methodology.For example, one has updated microcode for exploits and another does not.
TheinsanegamerN - Monday, June 18, 2018 - link
OOORrrrr....its a different motherboard, not the usual test bed. The motherboard used for this is an asrock board, which explains the difference in performance.Memo.Ray - Monday, June 11, 2018 - link
As I mentioned in my comment in the other article a couple of days ago:Intel managed to give away 8086 "binned" 8700K (AKA 8086K) and still make some money on top of it. win-win situation :D
https://www.anandtech.com/comments/12940/intels-co...
Xenphor - Monday, June 11, 2018 - link
How did they get such a lower score on the Dolphin benchmark with a 5ghz overclock on the 8086k? Isn't the benchmark single core only and considering the 8086 already turbos to 5ghz on a single core, why would there be that much of a difference? I tried it on my 8700k at 5ghz and only get a score of about 265-270 with 2666mhz ram.Ian Cutress - Monday, June 11, 2018 - link
The 5.0 GHz turbo, at stock, doesn't kick in that often. Depends on how the software sets its own affinity, and most do not. This is the danger with only single core turbo - with all the modern software in the background, even with Windows and scheduling, you rarely hit single core Turbo.Xenphor - Monday, June 11, 2018 - link
I suppose but even on the Dolphin forums spreadsheet the highest score is a 249 which is a 7700k at 5.2ghz.Ian Cutress - Tuesday, June 12, 2018 - link
I'll retest when I'm back home at the end of the week and recovered from jet lagXenphor - Tuesday, June 12, 2018 - link
Well don't feel like you have to. Just thought it was weird.Vatharian - Monday, June 11, 2018 - link
7 years ago, first batches of Core i7-2600K (like mine) were able to reach stable 5.0-5.2 GHz on water, on all 4 cores. Given 7 years difference and 32 vs 14 nm, I am maybe not disappointed (there are +2 cores, half a CPU more), but rather not amused. IPC is higher, that's one, DDR4 can reach 3 times higher frequencies than DDR3, that's two, so there are improvements, but given the bovine excrement that goes on chipset side and PCI-Express connectivity it's clear to see the stagnation.SanX - Monday, June 11, 2018 - link
Total flop. The processor in your phone is probably more hi-tech, has more transistors, more cores, and was made on more advances factories with 10nm litho being all sold below $25.