The Intel Core i7-8086K Review
by Ian Cutress on June 11, 2018 8:00 AM EST- Posted in
- CPUs
- Intel
- Core i7
- Anniversary
- Coffee Lake
- i7-8086K
- 5 GHz
- 8086K
- 5.0 GHz
Rise of the Tomb Raider
One of the newest games in the gaming benchmark suite is Rise of the Tomb Raider (RoTR), developed by Crystal Dynamics, and the sequel to the popular Tomb Raider which was loved for its automated benchmark mode. But don’t let that fool you: the benchmark mode in RoTR is very much different this time around.
Visually, the previous Tomb Raider pushed realism to the limits with features such as TressFX, and the new RoTR goes one stage further when it comes to graphics fidelity. This leads to an interesting set of requirements in hardware: some sections of the game are typically GPU limited, whereas others with a lot of long-range physics can be CPU limited, depending on how the driver can translate the DirectX 12 workload.
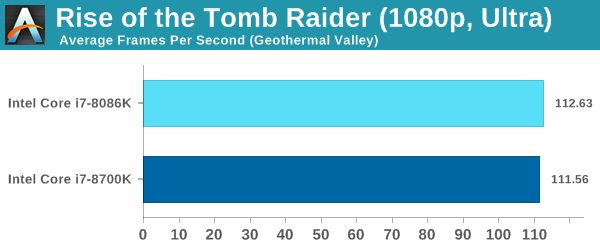
Where the old game had one benchmark scene, the new game has three different scenes with different requirements: Geothermal Valley (1-Valley), Prophet’s Tomb (2-Prophet) and Spine of the Mountain (3-Mountain) - and we test all three. These are three scenes designed to be taken from the game, but it has been noted that scenes like 2-Prophet shown in the benchmark can be the most CPU limited elements of that entire level, and the scene shown is only a small portion of that level. Because of this, we report the results for each scene on each graphics card separately.
Graphics options for RoTR are similar to other games in this type, offering some presets or allowing the user to configure texture quality, anisotropic filter levels, shadow quality, soft shadows, occlusion, depth of field, tessellation, reflections, foliage, bloom, and features like PureHair which updates on TressFX in the previous game.
Again, we test at 1920x1080 and 4K using our native 4K displays. At 1080p we run the High preset, while at 4K we use the Medium preset which still takes a sizable hit in frame rate.
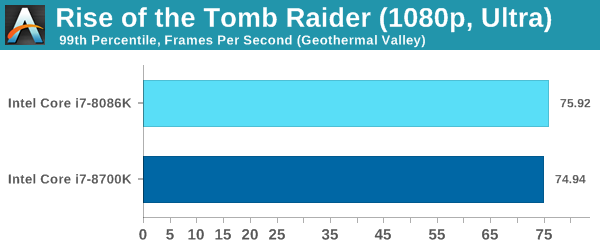
It is worth noting that RoTR is a little different to our other benchmarks in that it keeps its graphics settings in the registry rather than a standard ini file, and unlike the previous TR game the benchmark cannot be called from the command-line. Nonetheless we scripted around these issues to automate the benchmark four times and parse the results. From the frame time data, we report the averages, 99th percentiles, and our time under analysis.
All of our benchmark results can also be found in our benchmark engine, Bench.
ASRock RX 580 Performance


111 Comments
View All Comments
peevee - Monday, June 11, 2018 - link
8086 being slower than 8700 just indicates an error in your methodology.For example, one has updated microcode for exploits and another does not.
TheinsanegamerN - Monday, June 18, 2018 - link
OOORrrrr....its a different motherboard, not the usual test bed. The motherboard used for this is an asrock board, which explains the difference in performance.Memo.Ray - Monday, June 11, 2018 - link
As I mentioned in my comment in the other article a couple of days ago:Intel managed to give away 8086 "binned" 8700K (AKA 8086K) and still make some money on top of it. win-win situation :D
https://www.anandtech.com/comments/12940/intels-co...
Xenphor - Monday, June 11, 2018 - link
How did they get such a lower score on the Dolphin benchmark with a 5ghz overclock on the 8086k? Isn't the benchmark single core only and considering the 8086 already turbos to 5ghz on a single core, why would there be that much of a difference? I tried it on my 8700k at 5ghz and only get a score of about 265-270 with 2666mhz ram.Ian Cutress - Monday, June 11, 2018 - link
The 5.0 GHz turbo, at stock, doesn't kick in that often. Depends on how the software sets its own affinity, and most do not. This is the danger with only single core turbo - with all the modern software in the background, even with Windows and scheduling, you rarely hit single core Turbo.Xenphor - Monday, June 11, 2018 - link
I suppose but even on the Dolphin forums spreadsheet the highest score is a 249 which is a 7700k at 5.2ghz.Ian Cutress - Tuesday, June 12, 2018 - link
I'll retest when I'm back home at the end of the week and recovered from jet lagXenphor - Tuesday, June 12, 2018 - link
Well don't feel like you have to. Just thought it was weird.Vatharian - Monday, June 11, 2018 - link
7 years ago, first batches of Core i7-2600K (like mine) were able to reach stable 5.0-5.2 GHz on water, on all 4 cores. Given 7 years difference and 32 vs 14 nm, I am maybe not disappointed (there are +2 cores, half a CPU more), but rather not amused. IPC is higher, that's one, DDR4 can reach 3 times higher frequencies than DDR3, that's two, so there are improvements, but given the bovine excrement that goes on chipset side and PCI-Express connectivity it's clear to see the stagnation.SanX - Monday, June 11, 2018 - link
Total flop. The processor in your phone is probably more hi-tech, has more transistors, more cores, and was made on more advances factories with 10nm litho being all sold below $25.